


 |
市场调查报告书
商品编码
1716667
气体净化器市场机会、成长动力、产业趋势分析及 2025 - 2034 年预测Gas Purifiers Market Opportunity, Growth Drivers, Industry Trend Analysis, and Forecast 2025 - 2034 |
||||||
2024 年全球气体净化器市场估值达 20.1 亿美元,预计 2025 年至 2034 年期间的复合年增长率为 5.8%。对先进气体净化解决方案的需求不断增长,源于日益增长的环境问题以及针对空气品质和减排的更严格的全球法规。随着世界各地的监管机构实施更严格的标准来控制污染物和减少温室气体,各行各业越来越多地采用气体净化器来遵守这些不断变化的法规。随着企业专注于满足监管基准和加强永续发展努力,对可靠的气体净化系统的需求正在迅速增长。这一趋势得到了减少工业排放和确保各个製造过程中空气更安全、更清洁的迫切要求的支持。此外,工业化程度的提高以及人们对环境保护意识的增强,也推动了对高效能气体净化器的需求。该公司正在优先考虑先进的净化技术,以配合全球减少环境影响的努力,从而加速该市场的成长轨迹。
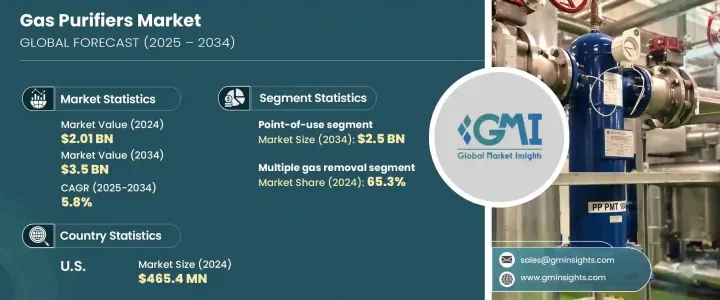
气体净化器市场分为使用点气体净化器和大宗气体净化器,其中使用点系统因其精确性和可靠性而获得了显着的吸引力。 2024 年,使用点部分的市场规模达到 14 亿美元,预计到 2034 年将超过 25 亿美元,这得益于应用现场对局部气体净化的需求不断增长。这些系统旨在即时输送高纯度气体,提供增强的性能和一致的输出品质。对确保无污染操作的解决方案的需求不断增长,极大地促进了关键行业对使用点净化器的采用。它们能够在不影响气体品质的情况下进行现场净化,使其成为精度至关重要的操作的首选。
| 市场范围 | |
|---|---|
| 起始年份 | 2024 |
| 预测年份 | 2025-2034 |
| 起始值 | 20.1亿美元 |
| 预测值 | 35亿美元 |
| 复合年增长率 | 5.8% |
根据应用,市场分为单一气体净化器和多种气体去除系统,其中后者占相当大的份额。多种气体去除系统在 2024 年创造了 13.1 亿美元的收入,并在 2025 年至 2034 年期间占据了 65.3% 的市场份额。这一领域的快速成长是由对能够同时消除各种气体杂质的综合系统日益增长的需求所推动的。这些整合净化解决方案使产业能够透过单一设定处理多种污染物,从而简化流程并保持高营运效率。它们的多功能性和满足广泛净化需求的能力是推动市场扩张的关键因素。
光是美国气体净化器市场在 2024 年的价值就达到 4.654 亿美元,预计到 2034 年将以 6.5% 的复合年增长率成长,这得益于对提高营运性能和满足严格环境要求的高效系统的需求。
目录
第一章:方法论与范围
第二章:执行摘要
第三章:行业洞察
- 产业生态系统分析
- 影响价值链的因素
- 利润率分析
- 中断
- 未来展望
- 製造商
- 经销商
- 衝击力
- 成长动力
- 严格的环境法规和政策
- 扩大最终用途产业
- 产业陷阱与挑战
- 高昂的资本和营运成本
- 成长动力
- 技术与创新格局
- 成长潜力分析
- 监管格局
- 定价分析
- 波特的分析
- PESTEL分析
第四章:竞争格局
- 介绍
- 公司市占率分析
- 竞争定位矩阵
- 战略展望矩阵
第五章:市场估计与预测:按类型,2021 年至 2034 年
- 主要趋势
- 使用点
- 大宗气体净化器/场地/设施
第六章:市场估计与预测:依操作压力,2021 年至 2034 年
- 主要趋势
- 低于100Psi
- 100Psi至200 Psi
- 200 磅/平方英吋 400 磅/平方英寸
- 高于400Psi
第七章:市场估计与预测:按应用,2021 年至 2034 年
- 主要趋势
- 单一气体净化器
- 多重气体去除
第 8 章:市场估计与预测:按最终用途产业,2021 年至 2034 年
- 主要趋势
- 半导体
- 化学和石化行业
- 医疗保健产业
- 金属和采矿业
- 食品和饮料业
- 其他(太阳能和能源等)
第九章:市场估计与预测:按配销通路,2021 年至 2034 年
- 主要趋势
- 直接的
- 间接
第十章:市场估计与预测:按地区,2021 年至 2034 年
- 主要趋势
- 北美洲
- 我们
- 加拿大
- 欧洲
- 德国
- 英国
- 法国
- 义大利
- 西班牙
- 亚太地区
- 中国
- 印度
- 日本
- 韩国
- 澳洲
- 拉丁美洲
- 巴西
- 墨西哥
- MEA
- 阿联酋
- 沙乌地阿拉伯
- 南非
第 11 章:公司简介
- Air Water Mechatronics Inc.
- Applied Energy Systems, Inc.
- Entegris, Inc.
- Linde Plc
- Markes International Ltd
- Matheson Tri-Gas, Inc.
- MBRAUN
- Merck KGaA
- Mott
- NuPure Corporation
- Pall Corporation
- Parker Hannifin Corp
- SAES Getters SpA
- Thermo Fisher Scientific Inc.
- VICI Metronics
The Global Gas Purifiers Market reached a valuation of USD 2.01 billion in 2024 and is anticipated to expand at a CAGR of 5.8% from 2025 to 2034. The rising demand for advanced gas purification solutions stems from growing environmental concerns and stricter global regulations targeting air quality and emission reductions. With regulatory bodies worldwide enforcing tougher standards to control pollutants and reduce greenhouse gases, industries are increasingly adopting gas purifiers to comply with these evolving mandates. As businesses focus on meeting regulatory benchmarks and enhancing sustainability efforts, the need for reliable gas purification systems is growing rapidly. This trend is supported by the urgent requirement to reduce industrial emissions and ensure safer, cleaner air across various manufacturing processes. Furthermore, increasing industrialization, along with heightened awareness about environmental protection, is fueling the demand for efficient gas purifiers. Companies are prioritizing advanced purification technologies to align with global efforts aimed at reducing environmental impact, thus accelerating the growth trajectory of this market.
The gas purifiers market is segmented into point-of-use and bulk gas purifiers, with point-of-use systems gaining significant traction due to their precision and reliability. In 2024, the point-of-use segment reached USD 1.4 billion and is projected to surpass USD 2.5 billion by 2034, supported by a growing need for localized gas purification at the site of application. These systems are engineered to deliver high-purity gases in real time, offering enhanced performance and consistent output quality. The rising demand for solutions that ensure contamination-free operations is significantly boosting the adoption of point-of-use purifiers in critical industries. Their ability to deliver on-site purification without compromising on gas quality makes them a preferred choice for operations where precision is crucial.
| Market Scope | |
|---|---|
| Start Year | 2024 |
| Forecast Year | 2025-2034 |
| Start Value | $2.01 Billion |
| Forecast Value | $3.5 Billion |
| CAGR | 5.8% |
On the basis of application, the market is divided into single gas purifiers and multiple gas removal systems, with the latter accounting for a considerable share. Multiple gas removal systems generated USD 1.31 billion in 2024 and represented 65.3% of the market share between 2025 and 2034. The rapid growth of this segment is driven by the increasing need for comprehensive systems capable of eliminating various gas impurities simultaneously. These integrated purification solutions enable industries to streamline processes and maintain high operational efficiency by handling multiple contaminants in a single setup. Their versatility and ability to address a broad range of purification needs are key factors fueling market expansion.
The U.S. gas purifiers market alone was valued at USD 465.4 million in 2024 and is expected to grow at a CAGR of 6.5% through 2034, propelled by the demand for efficient systems that enhance operational performance and meet stringent environmental requirements.
Table of Contents
Chapter 1 Methodology & Scope
- 1.1 Market scope & definition
- 1.2 Base estimates & calculations
- 1.3 Forecast parameters
- 1.4 Data sources
- 1.4.1 Primary
- 1.4.2 Secondary
- 1.4.2.1 Paid sources
- 1.4.2.2 Public sources
Chapter 2 Executive Summary
- 2.1 Industry 3600 synopsis, 2021 - 2034
Chapter 3 Industry Insights
- 3.1 Industry ecosystem analysis
- 3.1.1 Factor affecting the value chain
- 3.1.2 Profit margin analysis
- 3.1.3 Disruptions
- 3.1.4 Future outlook
- 3.1.5 Manufacturers
- 3.1.6 Distributors
- 3.2 Impact forces
- 3.2.1 Growth drivers
- 3.2.1.1 Stringent Environmental Regulations and Policies
- 3.2.1.2 Expanding End Use Industries
- 3.2.2 Industry pitfalls & challenges
- 3.2.2.1 High Capital and Operational Costs
- 3.2.1 Growth drivers
- 3.3 Technology & innovation landscape
- 3.4 Growth potential analysis
- 3.5 Regulatory landscape
- 3.6 Pricing analysis
- 3.7 Porter’s analysis
- 3.8 PESTEL analysis
Chapter 4 Competitive Landscape, 2024
- 4.1 Introduction
- 4.2 Company market share analysis
- 4.3 Competitive positioning matrix
- 4.4 Strategic outlook matrix
Chapter 5 Market Estimates & Forecast, By Type, 2021 – 2034 (USD Million) (Thousand Units)
- 5.1 Key Trends
- 5.2 Point-of-use
- 5.3 Bulk gas purifier/site/facility
Chapter 6 Market Estimates & Forecast, By Operating Pressure, 2021 – 2034 (USD Million) (Thousand Units)
- 6.1 Key trends
- 6.2 Below 100Psi
- 6.3 100Psi to 200 Psi
- 6.4 200Psi 400 Psi
- 6.5 Above 400Psi
Chapter 7 Market Estimates & Forecast, By Application, 2021 – 2034, (USD Million) (Thousand Units)
- 7.1 Key trends
- 7.2 Single gas purifier
- 7.3 Multiple gas removal
Chapter 8 Market Estimates & Forecast, By End Use Industry, 2021 – 2034, (USD Million) (Thousand Units)
- 8.1 Key trends
- 8.2 Semiconductor
- 8.3 Chemicals & petrochemicals industry
- 8.4 Healthcare industry
- 8.5 Metals & mining industry
- 8.6 Food & beverages industry
- 8.7 Others (solar and energy etc.)
Chapter 9 Market Estimates & Forecast, By Distribution Channel, 2021 – 2034, (USD Million) (Thousand Units)
- 9.1 Key trends
- 9.2 Direct
- 9.3 Indirect
Chapter 10 Market Estimates & Forecast, By Region, 2021 – 2034, (USD Million) (Thousand Units)
- 10.1 Key trends
- 10.2 North America
- 10.2.1 U.S.
- 10.2.2 Canada
- 10.3 Europe
- 10.3.1 Germany
- 10.3.2 U.K.
- 10.3.3 France
- 10.3.4 Italy
- 10.3.5 Spain
- 10.4 Asia Pacific
- 10.4.1 China
- 10.4.2 India
- 10.4.3 Japan
- 10.4.4 South Korea
- 10.4.5 Australia
- 10.5 Latin America
- 10.5.1 Brazil
- 10.5.2 Mexico
- 10.6 MEA
- 10.6.1 UAE
- 10.6.2 Saudi Arabia
- 10.6.3 South Africa
Chapter 11 Company Profiles (Business Overview, Financial Data, Product Landscape, Strategic Outlook, SWOT Analysis)
- 11.1 Air Water Mechatronics Inc.
- 11.2 Applied Energy Systems, Inc.
- 11.3 Entegris, Inc.
- 11.4 Linde Plc
- 11.5 Markes International Ltd
- 11.6 Matheson Tri-Gas, Inc.
- 11.7 MBRAUN
- 11.8 Merck KGaA
- 11.9 Mott
- 11.10 NuPure Corporation
- 11.11 Pall Corporation
- 11.12 Parker Hannifin Corp
- 11.13 SAES Getters S.p.A.
- 11.14 Thermo Fisher Scientific Inc.
- 11.15 VICI Metronics
