


 |
市场调查报告书
商品编码
1716698
储存区域网路交换器市场机会、成长动力、产业趋势分析及 2025 - 2034 年预测Storage Area Network Switches Market Opportunity, Growth Drivers, Industry Trend Analysis, and Forecast 2025 - 2034 |
||||||
2024 年全球储存区域网路交换器市场规模达到 214 亿美元,预计 2025 年至 2034 年的复合年增长率为 10.8%。这一增长得益于全球高速 5G 网路的部署、高速光纤的广泛采用以及资料中心和云端运算日益增长的重要性。这些进步正在推动企业从传统的 SAN 储存系统转向更复杂、高连接埠密度的交换互连。因此,SAN 交换器现在被认为是现代基础架构的必需品,它提供可扩展的储存解决方案,确保跨多个云端平台的无缝资料移动。
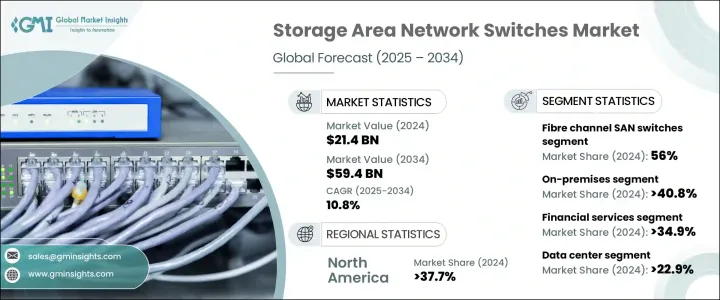
SAN 交换器市场主要分为两种:光纤通道 SAN 交换器和乙太网路SAN 交换器。 2024年,光纤通道SAN交换机将占据市场主导地位,占有56%的份额,预计成长速度最快,复合年增长率为12%。光纤通道 SAN 交换器越来越受到高效能环境的青睐,尤其是在需要低延迟和可靠储存解决方案的行业,例如医疗保健和金融。
| 市场范围 | |
|---|---|
| 起始年份 | 2024 |
| 预测年份 | 2025-2034 |
| 起始值 | 214亿美元 |
| 预测值 | 594亿美元 |
| 复合年增长率 | 10.8% |
根据部署类型,市场分为内部部署、基于云端和混合模型。 2024 年,内部部署部分将占据最大的市场份额,超过 40.8%,而基于云端的 SAN 交换器是成长最快的部分,预计复合年增长率为 12.4%。 2024 年本地储存市场价值为 87 亿美元,预计该市场将保持稳定成长,因为医疗保健和国防等产业的合规性规定非常严格,而安全、高效能的储存对这些产业至关重要。
就应用而言,SAN 交换器市场分为资料储存和备份、虚拟化、资料中心、企业网路、云端运算等。资料中心占据最大的市场份额,到2024年将占到总量的22.9%,预计成长最快,复合年增长率为12.6%。这一趋势与超大规模资料中心对储存解决方案不断增长的需求有关,而这种需求是由对高效能和节能係统的需求所驱动的。
对于终端使用产业,金融服务引领市场,到 2024 年将占总市场份额的 34.9%,预计成长最快,复合年增长率为 12.2%。随着金融机构越来越依赖 SAN 交换器执行高频交易和即时资料处理等任务,对这些技术的需求预计会持续上升。
从地理上看,北美是 SAN 交换器最大的市场,到 2024 年将占全球份额的 37.7%。同时,受快速数位转型的推动,亚太地区正经历最快的成长,预计复合年增长率为 12.2%。
目录
第一章:方法论与范围
第二章:执行摘要
第三章:行业洞察
- 产业生态系统分析
- 供应商矩阵
- 利润率分析
- 技术与创新格局
- 专利分析
- 重要新闻和倡议
- 产业衝击力
- 成长动力
- 5G和光纤网路的扩展
- 汽车光达集成
- 医学影像需求不断成长
- 工业自动化与智慧製造
- 资料中心和云端运算服务的扩展。
- 产业陷阱与挑战
- 高资本支出
- 技术快速淘汰
- 成长动力
- 成长潜力分析
- 波特的分析
- PESTEL分析
- 未来市场趋势
- 监管格局
第四章:市场估计与预测:依类型,2021 年至 2034 年
- 主要趋势
- 光纤通道 SAN 交换机
- 4 Gbps
- 8 Gbps
- 16 Gbps
- 32 Gbps
- 乙太网路SAN 交换机
- 1 GbE
- 10 GbE
- 25 GbE
- 40 Gb以太网
- 100 GbE
第五章:市场估计与预测:依部署类型 2021 – 2034
- 主要趋势
- 本地
- 云
- 杂交种
第六章:市场估计与预测:按应用 2021 年至 2034 年
- 主要趋势
- 资料储存和备份
- 虚拟化
- 资料中心
- 企业网路
- 云端运算
- 其他的
第七章:市场估计与预测:依最终用途产业 2021 年至 2034 年
- 主要趋势
- 金融服务
- 电信
- 政府
- 媒体和娱乐
- 航空
- 其他的
第八章:市场估计与预测:按地区,2021-2034 年
- 主要趋势
- 北美洲
- 美国
- 加拿大
- 欧洲
- 德国
- 英国
- 法国
- 西班牙
- 义大利
- 欧洲其他地区
- 亚太地区
- 日本
- 中国
- 印度
- 韩国
- 澳新银行
- 亚太其他地区
- 拉丁美洲
- 巴西
- 墨西哥
- 拉丁美洲其他地区
- 中东和非洲
- 南非
- 阿联酋
- 沙乌地阿拉伯
- 中东和非洲其他地区
第九章:公司简介
- Arista Networks, Inc.
- ATTO Technology, Inc.
- Brocade Communications Systems, Inc.
- Cisco Systems, Inc.
- Dell Technologies Inc.
- Extreme Networks, Inc.
- Fortinet, Inc.
- Fujitsu Limited
- Hewlett Packard Enterprise (HPE) Development LP
- Huawei Technologies Co., Ltd.
- IBM Corporation
- Juniper Networks, Inc.
- Lenovo Group Limited
- NEC Corporation
- QLogic Corporation (part of Marvell Technology Group)
The Global Storage Area Network Switches Market reached USD 21.4 billion in 2024 and is expected to grow at a CAGR of 10.8% from 2025 to 2034. This growth is driven by the global rollout of high-speed 5G networks, widespread adoption of high-speed fiber optics, and the growing importance of data centers and cloud computing. These advancements are pushing organizations to move from traditional SAN storage systems to more sophisticated, high-port-density switching interconnects. As a result, SAN switches are now considered essential for modern infrastructures, providing scalable storage solutions that ensure seamless data mobility across multiple cloud platforms.
The market for SAN switches is divided into two primary types: fiber channel SAN switches and Ethernet SAN switches. In 2024, fiber channel SAN switches dominate the market, holding a share of 56%, and are expected to grow at the fastest rate, with a CAGR of 12%. Fiber channel SAN switches are increasingly preferred for high-performance environments, particularly in sectors that require low-latency and reliable storage solutions, such as healthcare and finance.
| Market Scope | |
|---|---|
| Start Year | 2024 |
| Forecast Year | 2025-2034 |
| Start Value | $21.4 Billion |
| Forecast Value | $59.4 Billion |
| CAGR | 10.8% |
By deployment type, the market is segmented into on-premises, cloud-based, and hybrid models. In 2024, the on-premises segment holds the largest market share at over 40.8%, while cloud-based SAN switches are the fastest-growing segment, expected to grow at a CAGR of 12.4%. The on-premises market is valued at USD 8.7 billion in 2024 and is projected to maintain steady growth due to strict compliance regulations in industries such as healthcare and defense, where secure, high-performance storage is critical.
In terms of application, the SAN switches market is categorized into data storage and backup, virtualization, data centers, enterprise networking, cloud computing, and others. Data centers hold the largest market share, accounting for 22.9% of the total in 2024, and are expected to see the fastest growth with a CAGR of 12.6%. This trend is linked to the expanding demand for storage solutions in hyperscale data centers, driven by the need for high-performance and energy-efficient systems.
For end-use industries, financial services lead the market, making up 34.9% of the total market share in 2024, with the fastest growth projected at a CAGR of 12.2%. As financial institutions increasingly rely on SAN switches for tasks such as high-frequency trading and real-time data processing, the demand for these technologies is expected to continue rising.
Geographically, North America is the largest market for SAN switches, accounting for 37.7% of the global share in 2024. Meanwhile, the Asia-Pacific region is experiencing the fastest growth, with a projected CAGR of 12.2%, fueled by the region's rapid digital transformation.
Table of Contents
Chapter 1 Methodology & Scope
- 1.1 Market scope & definitions
- 1.2 Research design
- 1.2.1 Research approach
- 1.2.2 Data collection methods
- 1.3 Base estimates & calculations
- 1.3.1 Base year calculation
- 1.3.2 Key trends for market estimation
- 1.4 Forecast model
- 1.5 Primary research and validation
- 1.5.1 Primary sources
- 1.5.2 Data mining sources
Chapter 2 Executive Summary
- 2.1 Industry 3600 synopsis
Chapter 3 Industry Insights
- 3.1 Industry ecosystem analysis
- 3.2 Vendor matrix
- 3.3 Profit margin analysis
- 3.4 Technology & innovation landscape
- 3.5 Patent analysis
- 3.6 Key news and initiatives
- 3.7 Industry impact forces
- 3.7.1 Growth drivers
- 3.7.1.1 Expansion of 5G and fiber networks
- 3.7.1.2 Automotive LiDAR integration
- 3.7.1.3 Increasing demand for medical imaging
- 3.7.1.4 Industrial automation and smart manufacturing
- 3.7.1.5 Expansion of data centers and cloud computing services.
- 3.7.2 Industry pitfalls & challenges
- 3.7.2.1 High capital expenditure
- 3.7.2.2 Rapid technological obsolescence
- 3.7.1 Growth drivers
- 3.8 Growth potential analysis
- 3.9 Porter's analysis
- 3.10 PESTEL analysis
- 3.11 Future market trends
- 3.12 Regulatory landscape
Chapter 4 Market Estimates and Forecast, By Type, 2021 – 2034 ($ Bn)
- 4.1 Key trends
- 4.2 Fibre channel SAN switches
- 4.2.1 4 Gbps
- 4.2.2 8 Gbps
- 4.2.3 16 Gbps
- 4.2.4 32 Gbps
- 4.3 Ethernet SAN switches
- 4.3.1 1 GbE
- 4.3.2 10 GbE
- 4.3.3 25 GbE
- 4.3.4 40 GbE
- 4.3.5 100 GbE
Chapter 5 Market Estimates and Forecast, By Deployment Type 2021 – 2034 (USD Bn)
- 5.1 Key trends
- 5.2 On-premises
- 5.3 Cloud
- 5.4 Hybrid
Chapter 6 Market Estimates and Forecast, By Application 2021 – 2034 (USD Bn)
- 6.1 Key trends
- 6.2 Data storage and backup
- 6.3 Virtualization
- 6.4 Data centers
- 6.5 Enterprise networking
- 6.6 Cloud computing
- 6.7 Others
Chapter 7 Market Estimates and Forecast, By End Use Industry 2021 – 2034 (USD Bn)
- 7.1 Key trends
- 7.2 Financial services
- 7.3 Telecommunications
- 7.4 Government
- 7.5 Media and entertainment
- 7.6 Aviation
- 7.7 Others
Chapter 8 Market Estimates and Forecast, By Region, 2021– 2034 ($ Bn)
- 8.1 Key trends
- 8.2 North America
- 8.2.1 The U.S.
- 8.2.2 Canada
- 8.3 Europe
- 8.3.1 Germany
- 8.3.2 UK
- 8.3.3 France
- 8.3.4 Spain
- 8.3.5 Italy
- 8.3.6 Rest of Europe
- 8.4 Asia Pacific
- 8.4.1 Japan
- 8.4.2 China
- 8.4.3 India
- 8.4.4 South Korea
- 8.4.5 ANZ
- 8.4.6 Rest of Asia Pacific
- 8.5 Latin America
- 8.5.1 Brazil
- 8.5.2 Mexico
- 8.5.3 Rest of Latin America
- 8.6 Middle East and Africa
- 8.6.1 South Africa
- 8.6.2 UAE
- 8.6.3 Saudi Arabia
- 8.6.4 Rest of Middle East and Africa
Chapter 9 Company Profiles
- 9.1 Arista Networks, Inc.
- 9.2 ATTO Technology, Inc.
- 9.3 Brocade Communications Systems, Inc.
- 9.4 Cisco Systems, Inc.
- 9.5 Dell Technologies Inc.
- 9.6 Extreme Networks, Inc.
- 9.7 Fortinet, Inc.
- 9.8 Fujitsu Limited
- 9.9 Hewlett Packard Enterprise (HPE) Development LP
- 9.10 Huawei Technologies Co., Ltd.
- 9.11 IBM Corporation
- 9.12 Juniper Networks, Inc.
- 9.13 Lenovo Group Limited
- 9.14 NEC Corporation
- 9.15 QLogic Corporation (part of Marvell Technology Group)
 储存区域网路市场分析及预测(至2035年):按类型、产品类型、服务、技术、元件、应用、部署类型、最终用户、解决方案和安装类型划分
 伺服器储存区域网路市场 - 全球产业规模、份额、趋势、机会、预测:按组件、类型、组织、地区和竞争对手划分,2021-2031 年
 控制器区域网路 (CAN):全球市场份额和排名、总收入和需求预测 (2025-2031)
 全球控制器区域网路(CAN)收发器市场
 储存区域网路市场规模、份额和趋势分析报告:按组件、SAN 类型、技术、组织规模、最终用途、地区和细分市场预测,2025 年至 2033 年
 储存区域网路(SAN) 市场:按组件、按 SAN 类型、按技术、按最终用户、垂直行业和按地区
 储存区域网路 (SAN) 交换器市场,按类型、按部署类型、按应用、按最终用户、按国家和地区 - 2025 年至 2032 年全球行业分析、市场规模、市场份额和预测
 储存区域网路)市场规模、份额及成长分析(按组件、技术、SAN 类型、最终用途行业和地区)- 2025 年至 2032 年行业预测
 2030 年伺服器储存区域网路市场预测:按类型、服务、应用、最终用户和地区进行的全球分析
 2024-2028 年全球储存区域网路(SAN) 市场