


 |
市场调查报告书
商品编码
1716719
轮廓仪市场机会、成长动力、产业趋势分析及 2025 - 2034 年预测Profilometer Market Opportunity, Growth Drivers, Industry Trend Analysis, and Forecast 2025 - 2034 |
||||||
2024 年全球轮廓仪市场价值为 5.324 亿美元,预计 2025 年至 2034 年期间的复合年增长率为 5%。轮廓仪在半导体製造、汽车、航太和医疗设备等行业中发挥着至关重要的作用,用于测量表面粗糙度、纹理和形状。这些测量确保产品符合严格的品质标准并维持可靠的性能。随着製造流程变得越来越先进以及对更高精度的要求不断提高,对轮廓仪的需求预计也会增加。轮廓仪在现代生产环境中变得不可或缺,帮助製造商以极高的精度捕捉详细的表面特征。由于奈米技术的进步、设备小型化以及工业应用日益复杂,它们的重要性日益增加。此外,各行各业都在拥抱自动化和工业 4.0 趋势,这进一步推动了对轮廓仪等高精度计量工具的需求,以优化生产效率和品质控制。
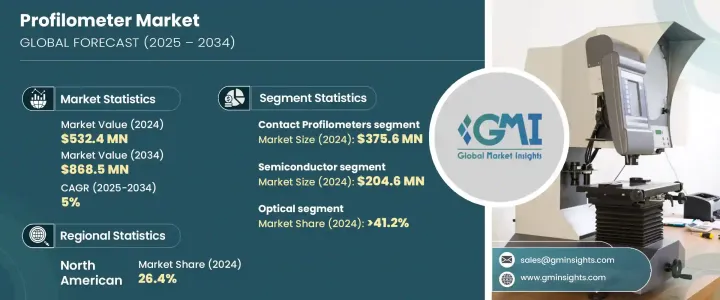
轮廓仪市场主要分为两种:接触式和非接触式。 2024 年,接触式轮廓仪的产值达到 3.756 亿美元,预计 2025 年至 2034 年的复合年增长率为 5.1%。接触式轮廓仪以其在测量粗糙度、形状和台阶高度方面的高精度而闻名,这使得它们在精度至关重要的行业中必不可少。即使在恶劣的工业环境中,油、碎片和不平坦的表面可能会干扰其他测量方法,这些设备也能提供可靠的结果。与可能受环境因素影响的非接触式轮廓仪不同,接触式轮廓仪直接与表面接触,提供一致且高度精确的测量。它们的耐用性和在苛刻环境下有效运作的能力使它们成为汽车和航太等领域应用的首选,因为这些领域的表面一致性和品质至关重要。
| 市场范围 | |
|---|---|
| 起始年份 | 2024 |
| 预测年份 | 2025-2034 |
| 起始值 | 5.324亿美元 |
| 预测值 | 8.685亿美元 |
| 复合年增长率 | 5% |
轮廓仪市场服务广泛的终端产业,包括汽车、半导体、医疗、航太、电子和製造业。 2024 年,半导体产业创造了 2.046 亿美元的收入,预计到 2034 年将以 5.2% 的复合年增长率成长。半导体产业正在快速发展,特征尺寸不断缩小,公差越来越严格,需要高精度测量工具来维持製造品质。轮廓仪在确保半导体表面符合要求的标准以及设备按照精确的规格生产方面发挥关键作用。随着业界向 5G、物联网和人工智慧设备等先进技术迈进,对精细表面测量的需求变得更加明显。
北美占据轮廓仪市场的 26.4%,2024 年创造了 1.407 亿美元的市场规模。该地区拥有多个备受瞩目的行业,包括航太、汽车、电子和医疗设备,所有这些行业都严重依赖轮廓仪来保持其製造过程中的准确性和品质。这些行业使用轮廓仪来评估表面粗糙度、纹理和形状,确保其产品符合最高品质标准。这些产业越来越多地采用先进的製造技术和严格的品质控制法规,推动了对轮廓仪的需求,使其成为维持北美工业格局竞争优势的重要工具。
目录
第一章:方法论与范围
第二章:执行摘要
第三章:行业洞察
- 产业生态系统分析
- 供应商格局
- 定价分析
- 技术与创新格局
- 重要新闻和倡议
- 监管格局
- 製造商
- 经销商
- 衝击力
- 成长动力
- 快速的城市化和生活方式的改变
- 酒店业蓬勃发展
- 提高消费者的卫生意识
- 增加可支配收入
- 产业陷阱与挑战
- 技术的复杂性与成本
- 维护和校准
- 成长动力
- 成长潜力分析
- 波特的分析
- PESTEL分析
第四章:竞争格局
- 介绍
- 公司市占率分析
- 竞争定位矩阵
- 战略展望矩阵
第五章:市场估计与预测:依类型,2021-2034
- 主要趋势
- 接触式轮廓仪
- 非接触式轮廓仪
第六章:市场估计与预测:依技术,2021-2034 年
- 主要趋势
- 光学的
- 触控笔
- 雷射扫描
- 干涉测量法
第七章:市场估计与预测:依最终用途,2021-2034
- 主要趋势
- 汽车
- 半导体
- 医疗/保健
- 航太
- 电子产品
- 製造业
第八章:市场估计与预测:按配销通路,2021-2034 年
- 主要趋势
- 直销
- 间接销售
第九章:市场估计与预测:按地区,2021-2034
- 主要趋势
- 北美洲
- 我们
- 加拿大
- 欧洲
- 英国
- 德国
- 法国
- 义大利
- 西班牙
- 俄罗斯
- 亚太地区
- 中国
- 印度
- 日本
- 韩国
- 澳洲
- 拉丁美洲
- 巴西
- 墨西哥
- MEA
- 南非
- 沙乌地阿拉伯
- 阿联酋
第十章:公司简介
- Alicona Imaging GmbH
- AMETEK, Inc.
- Bruker Nano Surfaces and Metrology
- Jenoptik Group
- KLA Corporation
- LS Starrett Company
- Mahr Inc.
- Mitutoyo America Corporation
- Pigeon Corporation
- Schaefer Technologie GmbH
- Sensofar
- Solarius, Inc.
- Teraspyöra-Steelwheel Oy
- TOKYO SEIMITSU Co., Ltd.
- Zygo Corporation
The Global Profilometer Market was valued at USD 532.4 million in 2024 and is projected to grow at a CAGR of 5% between 2025 and 2034. Profilometers play a crucial role in industries such as semiconductor manufacturing, automotive, aerospace, and medical devices, where they are used to measure surface roughness, texture, and form. These measurements ensure that products meet stringent quality standards and maintain reliable performance. As manufacturing processes become more advanced and demand for higher precision increases, the need for profilometers is expected to rise. Profilometers are becoming indispensable in modern production environments, helping manufacturers capture detailed surface characteristics with exceptional accuracy. Their importance is growing due to advancements in nanotechnology, miniaturization of devices, and the increasing complexity of industrial applications. Furthermore, industries are embracing automation and Industry 4.0 trends, which further drive the need for high-precision metrology tools like profilometers to optimize production efficiency and quality control.
The profilometer market is primarily segmented into two types: contact and non-contact. In 2024, contact profilometers generated USD 375.6 million and are expected to grow at a CAGR of 5.1% from 2025 to 2034. Contact profilometers are known for their high precision in measuring roughness, form, and step heights, making them essential in industries where accuracy is critical. These devices provide reliable results, even in harsh industrial settings where oil, debris, and uneven surfaces might interfere with other measurement methods. Unlike non-contact profilometers, which can be impacted by environmental factors, contact profilometers engage directly with the surface, delivering consistent and highly accurate measurements. Their durability and ability to function effectively in demanding environments make them the preferred choice for applications in sectors such as automotive and aerospace, where surface consistency and quality are paramount.
| Market Scope | |
|---|---|
| Start Year | 2024 |
| Forecast Year | 2025-2034 |
| Start Value | $532.4 Million |
| Forecast Value | $868.5 Million |
| CAGR | 5% |
The profilometer market serves a broad range of end-use industries, including automotive, semiconductor, medical, aerospace, electronics, and manufacturing. In 2024, the semiconductor segment generated USD 204.6 million and is projected to grow at a CAGR of 5.2% through 2034. The semiconductor industry is evolving rapidly, with shrinking feature sizes and tighter tolerances necessitating high-precision measurement tools to maintain manufacturing quality. Profilometers play a critical role in ensuring that semiconductor surfaces meet required standards and that devices are produced with exact specifications. As the industry moves toward advanced technologies such as 5G, IoT, and AI-powered devices, the need for meticulous surface measurement becomes even more pronounced.
North America accounted for 26.4% of the profilometer market and generated USD 140.7 million in 2024. The region is home to several high-profile industries, including aerospace, automotive, electronics, and medical devices, all of which heavily rely on profilometers to maintain accuracy and quality in their manufacturing processes. These industries use profilometers to assess surface roughness, texture, and form, ensuring that their products meet the highest quality standards. The increasing adoption of advanced manufacturing technologies and stringent quality control regulations across these industries are driving the demand for profilometers, making them a vital tool in maintaining competitive advantage in North America's industrial landscape.
Table of Contents
Chapter 1 Methodology & Scope
- 1.1 Research design
- 1.1.1 Research approach
- 1.1.2 Data collection methods
- 1.2 Base estimates and calculations
- 1.2.1 Base year calculation
- 1.2.2 Key trends for market estimates
- 1.3 Forecast model
- 1.4 Primary research & validation
- 1.4.1 Primary sources
- 1.4.2 Data mining sources
- 1.4.2.1 Market definitions
Chapter 2 Executive Summary
- 2.1 Industry 3600 synopsis, 2021-2034
Chapter 3 Industry Insights
- 3.1 Industry ecosystem analysis
- 3.2 Supplier landscape
- 3.3 Pricing analysis
- 3.4 Technology & innovation landscape
- 3.5 Key news & initiatives
- 3.6 Regulatory landscape
- 3.7 Manufacturers
- 3.8 Distributors
- 3.9 Impact forces
- 3.9.1 Growth drivers
- 3.9.1.1 Rapid urbanization and lifestyle changes
- 3.9.1.2 Growing hospitality sector
- 3.9.1.3 Increasing consumer awareness on hygiene
- 3.9.1.4 Increasing disposable income
- 3.9.2 Industry pitfalls & challenges
- 3.9.2.1 Complexity and cost of technology
- 3.9.2.2 Maintenance and calibration
- 3.9.1 Growth drivers
- 3.10 Growth potential analysis
- 3.11 Porter's analysis
- 3.12 PESTEL analysis
Chapter 4 Competitive Landscape, 2024
- 4.1 Introduction
- 4.2 Company market share analysis
- 4.3 Competitive positioning matrix
- 4.4 Strategic outlook matrix
Chapter 5 Market Estimates & Forecast, By Type, 2021-2034 (USD Million) (Million Units)
- 5.1 Key trends
- 5.2 Contact profilometers
- 5.3 Non-contact profilometers
Chapter 6 Market Estimates & Forecast, By Technology, 2021-2034 (USD Million) (Million Units)
- 6.1 Key trends
- 6.2 Optical
- 6.3 Stylus
- 6.4 Laser scan
- 6.5 Interferometry
Chapter 7 Market Estimates & Forecast, By End Use, 2021-2034 (USD Million) (Million Units)
- 7.1 Key trends
- 7.2 Automotive
- 7.3 Semiconductor
- 7.4 Medical/Healthcare
- 7.5 Aerospace
- 7.6 Electronics
- 7.7 Manufacturing
Chapter 8 Market Estimates & Forecast, By Distribution Channel, 2021-2034 (USD Million) (Million Units)
- 8.1 Key trends
- 8.2 Direct sales
- 8.3 Indirect sales
Chapter 9 Market Estimates & Forecast, By Region, 2021-2034 (USD Million) (Million Units)
- 9.1 Key trends
- 9.2 North America
- 9.2.1 U.S.
- 9.2.2 Canada
- 9.3 Europe
- 9.3.1 UK
- 9.3.2 Germany
- 9.3.3 France
- 9.3.4 Italy
- 9.3.5 Spain
- 9.3.6 Russia
- 9.4 Asia Pacific
- 9.4.1 China
- 9.4.2 India
- 9.4.3 Japan
- 9.4.4 South Korea
- 9.4.5 Australia
- 9.5 Latin America
- 9.5.1 Brazil
- 9.5.2 Mexico
- 9.6 MEA
- 9.6.1 South Africa
- 9.6.2 Saudi Arabia
- 9.6.3 UAE
Chapter 10 Company Profiles
- 10.1 Alicona Imaging GmbH
- 10.2 AMETEK, Inc.
- 10.3 Bruker Nano Surfaces and Metrology
- 10.4 Jenoptik Group
- 10.5 KLA Corporation
- 10.6 L.S. Starrett Company
- 10.7 Mahr Inc.
- 10.8 Mitutoyo America Corporation
- 10.9 Pigeon Corporation
- 10.10 Schaefer Technologie GmbH
- 10.11 Sensofar
- 10.12 Solarius, Inc.
- 10.13 Teraspyöra-Steelwheel Oy
- 10.14 TOKYO SEIMITSU Co., Ltd.
- 10.15 Zygo Corporation

