


 |
市场调查报告书
商品编码
1716725
电动葫芦市场机会、成长动力、产业趋势分析及2025-2034年预测Electric Hoist Market Opportunity, Growth Drivers, Industry Trend Analysis, and Forecast 2025 - 2034 |
||||||
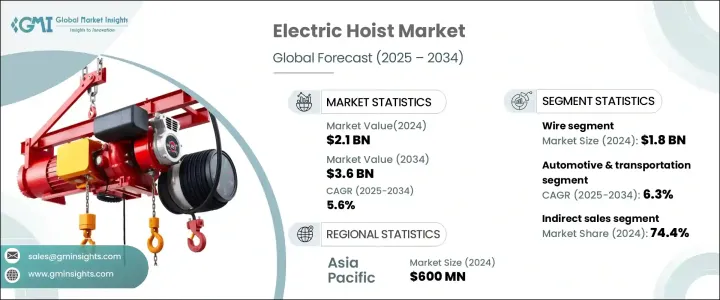
2024 年全球电动葫芦市场价值为 21 亿美元,预计 2025 年至 2034 年的复合年增长率为 5.6%。智慧和物联网电动葫芦的日益普及正在透过整合即时监控、预测性维护和自动化系统彻底改变物料搬运。这些先进的起重机配备了物联网感测器、人工智慧工具和无线控制,使产业能够远端监控性能、优化工作流程并防止设备故障。与需要定期检查和定期维护的传统起重机不同,智慧起重机依靠即时资料来检测磨损的早期迹象,从而最大限度地减少停机时间并降低营运成本。它们还透过降低过载、过热和机械故障等风险来提高工作场所的安全性。感测器监测负载能力、振动和系统性能,当检测到异常时停止操作,确保更高的效率和工人安全。
远端监控和控制系统进一步加强了对智慧起重机的需求,使管理人员能够从任何位置追踪起吊装置性能、负载状况和能耗。这些系统对于在大型设施或远端站点操作多台升降机的行业特别有益。智慧升降机收集的资料有助于提高效能、减少能源使用和自动执行关键任务,使其成为现代工业环境中不可或缺的一部分。
| 市场范围 | |
|---|---|
| 起始年份 | 2024 |
| 预测年份 | 2025-2034 |
| 起始值 | 21亿美元 |
| 预测值 | 36亿美元 |
| 复合年增长率 | 5.6% |
电动起吊装置市场按类型分为炼式葫芦和钢索葫芦。钢丝绳葫芦在 2024 年创造了 18 亿美元的收入,预计在预测期内的复合年增长率为 5.6%。钢丝绳葫芦因其强度、耐用性和承受重载的能力而占据市场主导地位,适用于汽车、建筑、造船、航太和重型机械行业的应用。它们比炼式起重机具有更高的速度和效率,可以快速移动材料并最大限度地减少生产停机时间。在需要极少维护和较长使用寿命的环境中,包括高温、高尘和腐蚀性环境,钢丝绳葫芦是首选。它们能够提供平稳、安静的运行,从而提高工作场所的安全性和效率。
就终端使用产业而言,电动起吊装置市场面向航太、汽车和运输、建筑、能源、海洋和航运、物流、物料搬运、石油和天然气以及农业等领域。汽车和运输领域在 2024 年占据了超过 12% 的市场份额,预计到 2034 年将以 6.3% 的复合年增长率增长。电动葫芦需求的不断增长源于汽车製造、维护和物流领域对自动化、物料搬运和重型起重的需求日益增长。工业 4.0 技术正在推动整合物联网的电动葫芦的应用,这对于处理轻型电动车零件和先进製造工厂的装配线自动化至关重要。
电动起吊装置市场的通路分为直接销售和间接销售。 2024 年间接销售占据主导地位,占 74.4% 的份额,这是因为製造商利用广泛的分销商、经销商和第三方供应商网络来接触更广泛的客户群,而无需建立昂贵的销售系统。间接通路可协助製造商渗透到发展中市场,这些市场的当地经销商拥有强大的客户关係和区域专业知识。经销商提供的融资和租赁选择也使中小企业能够使用电动葫芦,以支持市场扩张。
2024 年,亚太地区引领全球电动起吊装置市场,占约 30.9% 的市场份额,创造约 6 亿美元的收入。该地区的主导地位是由主要国家在製造业、基础设施和建筑业的大量投资所推动的,从而导致对物料搬运设备的需求增加。低成本劳动力和原料的供应使该地区成为电动起吊装置生产和出口中心。该地区自动化程度的不断提高和电子商务的兴起进一步推动了对电动葫芦的需求,巩固了亚太地区在全球市场的领导地位。
目录
第一章:方法论与范围
第二章:执行摘要
第三章:行业洞察
- 产业生态系统分析
- 供应商概况
- 定价分析
- 技术与创新格局
- 重要新闻和倡议
- 监管格局
- 製造商
- 经销商
- 零售商
- 对部队的影响
- 成长动力
- 工业自动化日益兴起
- 基础建设不断推进
- 注重安全性和人体工学
- 产业陷阱与挑战
- 激烈的价格竞争
- 严格的安全规定
- 成长动力
- 成长潜力分析
- 消费者购买行为
- 波特的分析
- PESTEL分析
第四章:竞争格局
- 介绍
- 公司市占率分析
- 竞争定位矩阵
- 战略展望矩阵
第五章:市场估计与预测:按类型,2021 - 2034 年(十亿美元)
- 主要趋势
- 链
- 金属丝
第六章:市场估计与预测:按产能(吨),2021-2034 年(十亿美元)
- 主要趋势
- 0.25-5.0
- 5.1-10
- 10.1-15
- 15.1-20
- 20.1-32
第七章:市场估计与预测:按最终用途产业,2021 - 2034 年(十亿美元)
- 主要趋势
- 航太
- 汽车与运输
- 建造
- 活力
- 海运和航运
- 运输与物流
- 物料处理
- 石油和天然气
- 农业和林业
- 其他的
第八章:市场估计与预测:按应用,2021 - 2034 年(十亿美元)
- 主要趋势
- 商业復苏
- 起重机
- 固定的
- 移动的
- 工作船
- 公用事业
- 其他的
第九章:市场估计与预测:按配销通路,2021 - 2034 年(十亿美元)
- 主要趋势
- 直接的
- 间接
第十章:市场估计与预测:按地区,2021 - 2034 年(十亿美元)
- 主要趋势
- 北美洲
- 我们
- 加拿大
- 欧洲
- 英国
- 德国
- 法国
- 义大利
- 西班牙
- 俄罗斯
- 亚太地区
- 中国
- 印度
- 日本
- 澳洲
- 韩国
- 拉丁美洲
- 巴西
- 墨西哥
- 阿根廷
- MEA
- 阿联酋
- 南非
- 沙乌地阿拉伯
第 11 章:公司简介
- ABUS Cranes
- Columbus McKinnon
- Crosby Group
- Demag Cranes and Components
- Hitachi Industrial Equipment Systems
- IMER International
- Ingersoll Rand
- JASO Industrial Cranes
- KITO
- Konecranes
- Kran Direkt
- Street Crane
- Tianjin Kunda Hoisting Equipment
- Verlinde
- Yale
The Global Electric Hoist Market was valued at USD 2.1 billion in 2024 and is projected to expand at a CAGR of 5.6% from 2025 to 2034. The increasing adoption of intelligent and IoT-enabled electric hoists is revolutionizing material handling by integrating real-time monitoring, predictive maintenance, and automated systems. These advanced hoists come equipped with IoT sensors, AI-powered tools, and wireless controls that allow industries to remotely monitor performance, optimize work processes, and prevent equipment failures. Unlike traditional hoists that require periodic inspections and scheduled maintenance, smart hoists rely on real-time data to detect early signs of wear, minimizing downtime and reducing operational costs. They also enhance workplace safety by mitigating risks such as overload, overheating, and machinery breakdowns. Sensors monitor load capacity, vibrations, and system performance to halt operations when anomalies are detected, ensuring higher efficiency and worker safety.
Remote monitoring and control systems further strengthen the demand for smart hoists by enabling managers to track hoist performance, load conditions, and energy consumption from any location. These systems are particularly beneficial for industries that operate multiple hoists across large facilities or remote sites. The data collected from smart hoists aids in improving performance, reducing energy usage, and automating critical tasks, making them indispensable in modern industrial settings.
| Market Scope | |
|---|---|
| Start Year | 2024 |
| Forecast Year | 2025-2034 |
| Start Value | $2.1 Billion |
| Forecast Value | $3.6 Billion |
| CAGR | 5.6% |
The electric hoist market is segmented by type into chain and wire hoists. Wire hoists generated USD 1.8 billion in revenue in 2024 and are expected to grow at a CAGR of 5.6% over the forecast period. Wire rope hoists dominate the market due to their strength, durability, and ability to handle heavy loads, making them suitable for applications in automotive, construction, shipbuilding, aerospace, and heavy machinery industries. They offer greater speed and efficiency than chain hoists, allowing materials to be moved quickly and minimizing production downtime. Wire rope hoists are preferred in environments that require minimal maintenance and longer operational life, including high-temperature, high-dust, and corrosive settings. Their ability to provide smooth, quiet operation enhances workplace safety and efficiency.
In terms of end-use industries, the electric hoist market caters to sectors such as aerospace, automotive and transportation, construction, energy, marine and shipping, logistics, material handling, oil and gas, and agriculture. The automotive and transportation segment accounted for over 12% of the market in 2024 and is projected to grow at a CAGR of 6.3% until 2034. The increasing demand for electric hoists stems from the growing need for automation, material handling, and heavy lifting in automotive manufacturing, maintenance, and logistics. Industry 4.0 technologies are driving the adoption of electric hoists with IoT integration, which is vital for handling lightweight EV components and automating assembly lines in advanced manufacturing facilities.
Distribution channels in the electric hoist market are categorized as direct and indirect sales. Indirect sales dominated in 2024, accounting for a 74.4% share, due to the extensive network of distributors, dealers, and third-party suppliers that manufacturers utilize to reach a broader customer base without building costly sales systems. Indirect channels help manufacturers penetrate developing markets where local distributors have strong customer relationships and regional expertise. Financing and leasing options provided by dealers also make electric hoists accessible to SME , supporting market expansion.
Asia Pacific led the global electric hoist market in 2024, holding around 30.9% of the market share and generating approximately USD 600 million in revenue. The region's dominance is driven by significant investments in manufacturing, infrastructure, and construction across key countries, leading to higher demand for material handling equipment. The availability of low-cost labor and raw materials contributes to the region's position as a hub for electric hoist production and export. The increasing adoption of automation and the rise of e-commerce in the region is further driving the need for electric hoists, solidifying Asia Pacific's leadership in the global market.
Table of Contents
Chapter 1 Methodology & Scope
- 1.1 Research design
- 1.1.1 Research approach
- 1.1.2 Data collection methods
- 1.2 Base estimates and calculations
- 1.2.1 Base year calculation
- 1.2.2 Key trends for market estimates
- 1.3 Forecast model
- 1.4 Primary research & validation
- 1.4.1 Primary sources
- 1.4.2 Data mining sources
- 1.5 Market definitions
Chapter 2 Executive Summary
- 2.1 Industry synopsis, 2021 - 2034
Chapter 3 Industry Insights
- 3.1 Industry ecosystem analysis
- 3.2 Supplier Landscape
- 3.3 Pricing analysis
- 3.4 Technology & innovation landscape
- 3.5 Key news & initiatives
- 3.6 Regulatory landscape
- 3.7 Manufacturers
- 3.8 Distributors
- 3.9 Retailers
- 3.10 Impact on forces
- 3.10.1 Growth drivers
- 3.10.1.1 Rising industrial automation
- 3.10.1.2 Growing infrastructure development
- 3.10.1.3 Focus on safety and ergonomics
- 3.10.2 Industry pitfalls & challenges
- 3.10.2.1 Intense price competition
- 3.10.2.2 Stringent safety regulations
- 3.10.1 Growth drivers
- 3.11 Growth potential analysis
- 3.12 Consumer buying behavior
- 3.13 Porter's analysis
- 3.14 PESTEL analysis
Chapter 4 Competitive Landscape, 2024
- 4.1 Introduction
- 4.2 Company market share analysis
- 4.3 Competitive positioning matrix
- 4.4 Strategic outlook matrix
Chapter 5 Market Estimates & Forecast, By Type, 2021 - 2034 ($Bn) (Thousand Units)
- 5.1 Key trends
- 5.2 Chain
- 5.3 Wire
Chapter 6 Market Estimates & Forecast, By Capacity (Tons), 2021 - 2034 ($Bn) (Thousand Units)
- 6.1 Key trends
- 6.2 0.25-5.0
- 6.3 5.1-10
- 6.4 10.1-15
- 6.5 15.1-20
- 6.6 20.1-32
Chapter 7 Market Estimates & Forecast, By End Use Industry, 2021 - 2034 ($Bn) (Thousand Units)
- 7.1 Key trends
- 7.2 Aerospace
- 7.3 Automotive & transportation
- 7.4 Construction
- 7.5 Energy
- 7.6 Marine & shipping
- 7.7 Transportation & logistics
- 7.8 Material handling
- 7.9 Oil & gas
- 7.10 Agricultural & forestry
- 7.11 Others
Chapter 8 Market Estimates & Forecast, By Application, 2021 - 2034 ($Bn) (Thousand Units)
- 8.1 Key trends
- 8.2 Commercial recovery
- 8.3 Cranes
- 8.3.1 Fixed
- 8.3.2 Mobile
- 8.4 Workboat
- 8.5 Utility
- 8.6 Others
Chapter 9 Market Estimates & Forecast, By Distribution Channel, 2021 - 2034 ($Bn) (Thousand Units)
- 9.1 Key trends
- 9.2 Direct
- 9.3 Indirect
Chapter 10 Market Estimates & Forecast, By Region, 2021 - 2034 ($Bn) (Thousand Units)
- 10.1 Key trends
- 10.2 North America
- 10.2.1 U.S.
- 10.2.2 Canada
- 10.3 Europe
- 10.3.1 UK
- 10.3.2 Germany
- 10.3.3 France
- 10.3.4 Italy
- 10.3.5 Spain
- 10.3.6 Russia
- 10.4 Asia Pacific
- 10.4.1 China
- 10.4.2 India
- 10.4.3 Japan
- 10.4.4 Australia
- 10.4.5 South Korea
- 10.5 Latin America
- 10.5.1 Brazil
- 10.5.2 Mexico
- 10.5.3 Argentina
- 10.6 MEA
- 10.6.1 UAE
- 10.6.2 South Africa
- 10.6.3 Saudi Arabia
Chapter 11 Company Profiles
- 11.1 ABUS Cranes
- 11.2 Columbus McKinnon
- 11.3 Crosby Group
- 11.4 Demag Cranes and Components
- 11.5 Hitachi Industrial Equipment Systems
- 11.6 IMER International
- 11.7 Ingersoll Rand
- 11.8 JASO Industrial Cranes
- 11.9 KITO
- 11.10 Konecranes
- 11.11 Kran Direkt
- 11.12 Street Crane
- 11.13 Tianjin Kunda Hoisting Equipment
- 11.14 Verlinde
- 11.15 Yale
 矿用提升钢索市场:依材料、结构、芯线、涂层、直径及润滑方式分類的全球预测,2026-2032年
 2026年全球起吊装置市场报告
 起重机和起吊装置市场 - 全球产业规模、份额、趋势、机会、预测:按类型、应用、地区和竞争格局划分,2021-2031年全球螺旋起吊装置市场(按产品类型、起重能力、安装类型、终端用户产业和分销管道划分)预测(2026-2032年)
 电动钢绳起吊装置市场-2026-2031年预测2025年全球人员与物料电梯市场报告
 矿山提升系统市场规模、份额和趋势分析报告:按产品、应用、采矿类型、动力来源、地区和细分市场预测(2025-2033 年)起重机和起吊装置市场:按安装类型、起吊装置类型、操作模式、起重机类型、起重机能力范围和最终用户划分-2025-2032年全球预测
 全球电动起吊装置市场
 全球起重机和起吊装置市场(按类型、营运、起重能力、产业和地区划分)-预测至2030年