


 |
市场调查报告书
商品编码
1721528
电容器组市场机会、成长动力、产业趋势分析及 2025 - 2034 年预测Capacitor Bank Market Opportunity, Growth Drivers, Industry Trend Analysis, and Forecast 2025 - 2034 |
||||||
2024 年全球电容器组市场价值为 31 亿美元,预计到 2034 年将以 4% 的复合年增长率成长,达到 46 亿美元。这一增长源于已开发和发展中能源密集型经济体继续优先考虑能源效率和电网可靠性。随着全球电力需求以前所未有的速度成长,各行各业和政府都开始将电容器组视为稳定电压等级、提高功率因数和减少能量损失的重要组成部分。电力基础设施的现代化,特别是在快速城市化地区的电力基础设施的现代化,为这些系统的部署创造了繁荣的前景。市场参与者正在透过推出符合下一代电网要求的紧凑、智慧和数位化电容器组来满足这一需求。风能和太阳能等再生能源越来越多地融入电网,也增加了对无功功率支援的需求,使得电容器组成为实现能源转型目标的关键推动因素。为了实现永续发展目标,政策制定者正在推动以最高效率运作的低损耗电力系统。这些趋势得到了全球范围内专注于长期电网升级和弹性增强专案的公私合作伙伴关係的进一步支持。
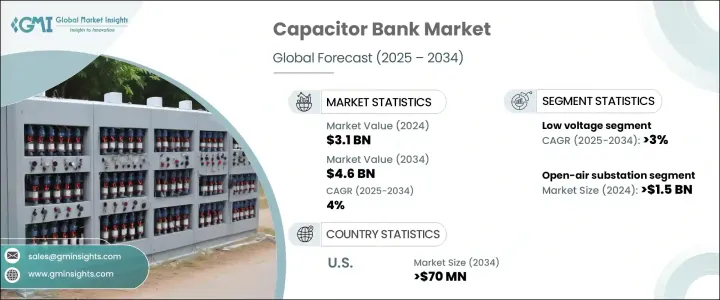
以电压计算,到 2034 年,低压部分将以 3% 的复合年增长率稳定成长。这一增长是由基础设施有限的欠发达地区不断增长的能源需求和发达经济体不断的网络改进所推动的。随着住宅、商业和轻工业用户寻求更好的电力品质和系统稳定性,低压电容器组越来越受到关注。它们设计紧凑、易于整合且成本高效,非常适合基础设施快速扩张的地区。这些装置提供了适应不断变化的负载需求所需的灵活性,同时确保了节能和设备寿命。
| 市场范围 | |
|---|---|
| 起始年份 | 2024 |
| 预测年份 | 2025-2034 |
| 起始值 | 31亿美元 |
| 预测值 | 46亿美元 |
| 复合年增长率 | 4% |
从配置方面来看,露天变电站部分在2024年创造了15亿美元的收入。该部分的成长得益于对大型输电项目和智慧电网技术的持续投资。公用事业公司更喜欢这些系统,因为它们能够稳定整个扩展配电网路的电压,特别是在高负载情况下。製造业、再生能源和电信等产业越来越依赖这些配置来确保不间断的电力传输和可扩展的基础设施解决方案。
2024 年美国电容器组市场规模为 5.578 亿美元,预计到 2034 年将达到 7 亿美元。电动车的日益普及和资料中心的大规模扩张正在推动对增强无功补偿的需求。凭藉先进的电网结构和对低排放系统的强力监管推动,美国在高性能电容器组的部署方面继续保持领先地位。
全球电容器组市场的主要参与者包括 ZEZ SILKO、CIRCUTOR、SHARDA Electronics、LAXMI ELECTRONICS、ABB、施耐德电机、通用电气、西门子、LIFASA、日立能源、ARTECHE、Powerside、Aener Energia、Eaton 和 Enerlux Power。公司正大力投资研发,以推出智慧、高效、具有远端监控功能的电容器组。与公用事业和政府实体的策略合作伙伴关係正在帮助这些公司提供针对特定区域的解决方案,并透过有针对性的收购挖掘新的市场机会。
目录
第一章:方法论与范围
第二章:执行摘要
第三章:行业洞察
- 产业生态系统分析
- 监管格局
- 产业衝击力
- 成长动力
- 产业陷阱与挑战
- 成长潜力分析
- 波特的分析
- 供应商的议价能力
- 买家的议价能力
- 新进入者的威胁
- 替代品的威胁
- PESTEL分析
第四章:竞争格局
- 介绍
- 战略展望
- 创新与永续发展格局
第五章:市场规模及预测:按电压,2021 - 2034
- 主要趋势
- 低 [<10 kV]
- 中[10千伏-69千伏]
- 高[>69千伏]
第六章:市场规模及预测:依类型,2021 - 2034
- 主要趋势
- 露天变电站
- 金属封闭变电站
- 桿式安装
- 其他的
第七章:市场规模及预测:依应用,2021 - 2034
- 主要趋势
- 功率因数校正
- 谐波滤波器
- 电压调节
- 再生能源整合
- 工业应用
- 资料中心
- 其他的
第八章:市场规模及预测:按地区,2021 - 2034
- 主要趋势
- 北美洲
- 我们
- 加拿大
- 墨西哥
- 欧洲
- 德国
- 法国
- 西班牙
- 义大利
- 英国
- 荷兰
- 俄罗斯
- 瑞典
- 亚太地区
- 中国
- 印度
- 日本
- 韩国
- 印尼
- 纽西兰
- 马来西亚
- 泰国
- 新加坡
- 澳洲
- 中东和非洲
- 沙乌地阿拉伯
- 阿联酋
- 卡达
- 阿曼
- 南非
- 拉丁美洲
- 巴西
- 智利
- 阿根廷
第九章:公司简介
- ABB
- Aener Energia
- ARTECHE
- LAXMI ELECTRONICS
- CIRCUTOR
- Eaton
- Enerlux Power
- General Electric
- Hitachi Energy
- SHARDA Electronics
- Powerside
- Schneider Electric
- LIFASA
- Siemens
- ZEZ SILKO
The Global Capacitor Bank Market was valued at USD 3.1 billion in 2024 and is estimated to grow at a CAGR of 4% to reach USD 4.6 billion by 2034. This growth comes as energy-intensive economies, both developed and developing, continue to prioritize energy efficiency and grid reliability. With the global demand for electricity rising at an unprecedented rate, industries and governments are turning to capacitor banks as essential components to stabilize voltage levels, improve power factor, and reduce energy losses. The modernization of power infrastructure, especially in fast-urbanizing regions, has created a thriving landscape for the deployment of these systems. Market players are responding to this demand by introducing compact, smart, and digitally enabled capacitor banks that align with next-gen grid requirements. The rising integration of renewable energy sources like wind and solar into the grid is also increasing the need for reactive power support, making capacitor banks a key enabler for energy transition goals. In line with sustainability objectives, policymakers are pushing for low-loss power systems that operate with maximum efficiency. These trends are further backed by public-private partnerships focused on long-term grid upgrades and resilience enhancement projects worldwide.
By voltage, the low voltage segment is set to grow steadily at a CAGR of 3% through 2034. This growth is being driven by mounting energy demands in underdeveloped regions with limited infrastructure and continuous network improvements across developed economies. As residential, commercial, and light industrial users seek better power quality and system stability, low-voltage capacitor banks are gaining traction. Their compact design, ease of integration, and cost efficiency make them ideal for areas undergoing rapid infrastructure expansion. These units offer the flexibility needed to accommodate shifting load demands while ensuring energy savings and equipment longevity.
| Market Scope | |
|---|---|
| Start Year | 2024 |
| Forecast Year | 2025-2034 |
| Start Value | $3.1 Billion |
| Forecast Value | $4.6 Billion |
| CAGR | 4% |
In terms of configuration, the open-air substation segment generated USD 1.5 billion in 2024. The segment's growth is supported by sustained investments in large-scale power transmission projects and smart grid technologies. Utilities prefer these systems due to their ability to stabilize voltage across extended distribution networks, particularly in high-load scenarios. Industries such as manufacturing, renewables, and telecommunications are increasingly relying on these configurations to ensure uninterrupted power delivery and scalable infrastructure solutions.
The United States Capacitor Bank Market generated USD 557.8 million in 2024 and is projected to reach USD 700 million by 2034. The growing adoption of electric vehicles and large-scale expansion of data centers are fueling the need for enhanced reactive power compensation. With an advanced grid structure and strong regulatory push for low-emission systems, the U.S. continues to lead in deploying high-performance capacitor banks.
Key players in the Global Capacitor Bank Market include ZEZ SILKO, CIRCUTOR, SHARDA Electronics, LAXMI ELECTRONICS, ABB, Schneider Electric, General Electric, Siemens, LIFASA, Hitachi Energy, ARTECHE, Powerside, Aener Energia, Eaton, and Enerlux Power. Companies are investing heavily in R&D to launch smart, efficient, and remote-monitoring enabled capacitor banks. Strategic partnerships with utilities and government entities are helping these firms offer region-specific solutions and tap into new market opportunities through targeted acquisitions.
Table of Contents
Chapter 1 Methodology & Scope
- 1.1 Research design
- 1.2 Market estimates & forecast parameters
- 1.3 Forecast calculation
- 1.4 Data sources
- 1.4.1 Primary
- 1.4.2 Secondary
- 1.4.2.1 Paid
- 1.4.2.2 Public
- 1.5 Market definitions
Chapter 2 Executive Summary
- 2.1 Industry synopsis, 2021 - 2034
Chapter 3 Industry Insights
- 3.1 Industry ecosystem analysis
- 3.2 Regulatory landscape
- 3.3 Industry impact forces
- 3.3.1 Growth drivers
- 3.3.2 Industry pitfalls & challenges
- 3.4 Growth potential analysis
- 3.5 Porter's analysis
- 3.5.1 Bargaining power of suppliers
- 3.5.2 Bargaining power of buyers
- 3.5.3 Threat of new entrants
- 3.5.4 Threat of substitutes
- 3.6 PESTEL analysis
Chapter 4 Competitive Landscape, 2025
- 4.1 Introduction
- 4.2 Strategic outlook
- 4.3 Innovation & sustainability landscape
Chapter 5 Market Size and Forecast, By Voltage, 2021 - 2034 (USD Million & '000 Units)
- 5.1 Key trends
- 5.2 Low [<10 kV]
- 5.3 Medium [10 kV - 69 kV]
- 5.4 High [>69 kV]
Chapter 6 Market Size and Forecast, By Type, 2021 - 2034 (USD Million & '000 Units)
- 6.1 Key trends
- 6.2 Open air substation
- 6.3 Metal enclosed substation
- 6.4 Pole mounted
- 6.5 Others
Chapter 7 Market Size and Forecast, By Application, 2021 - 2034 (USD Million & '000 Units)
- 7.1 Key trends
- 7.2 Power factor correction
- 7.3 Harmonic filter
- 7.4 Voltage regulation
- 7.5 Renewable integration
- 7.6 Industrial application
- 7.7 Data centers
- 7.8 Others
Chapter 8 Market Size and Forecast, By Region, 2021 - 2034 (USD Million & '000 Units)
- 8.1 Key trends
- 8.2 North America
- 8.2.1 U.S.
- 8.2.2 Canada
- 8.2.3 Mexico
- 8.3 Europe
- 8.3.1 Germany
- 8.3.2 France
- 8.3.3 Spain
- 8.3.4 Italy
- 8.3.5 UK
- 8.3.6 Netherlands
- 8.3.7 Russia
- 8.3.8 Sweden
- 8.4 Asia Pacific
- 8.4.1 China
- 8.4.2 India
- 8.4.3 Japan
- 8.4.4 South Korea
- 8.4.5 Indonesia
- 8.4.6 New Zealand
- 8.4.7 Malaysia
- 8.4.8 Thailand
- 8.4.9 Singapore
- 8.4.10 Australia
- 8.5 Middle East & Africa
- 8.5.1 Saudi Arabia
- 8.5.2 UAE
- 8.5.3 Qatar
- 8.5.4 Oman
- 8.5.5 South Africa
- 8.6 Latin America
- 8.6.1 Brazil
- 8.6.2 Chile
- 8.6.3 Argentina
Chapter 9 Company Profiles
- 9.1 ABB
- 9.2 Aener Energia
- 9.3 ARTECHE
- 9.4 LAXMI ELECTRONICS
- 9.5 CIRCUTOR
- 9.6 Eaton
- 9.7 Enerlux Power
- 9.8 General Electric
- 9.9 Hitachi Energy
- 9.10 SHARDA Electronics
- 9.11 Powerside
- 9.12 Schneider Electric
- 9.13 LIFASA
- 9.14 Siemens
- 9.15 ZEZ SILKO
 全球电容器组市场规模、份额、趋势和成长分析报告(2026-2034年)
 全球电容器组市场报告(2026 年)
 电容器组市场 - 全球产业规模、份额、趋势、机会及预测(按电压、类型、安装方式、应用、地区和竞争格局划分,2021-2031年)
 全球电容器组市场:市场规模、份额、趋势分析(按电压、应用和地区)、展望和预测(2025-2032 年)
 全球中压电容器组市场中压电容器组市场 - 全球产业规模、份额、趋势、机会和预测,按阶段、按类型、按应用、按冷却方法、按地区、按竞争进行细分,2020-2030 年全球低压电容器组市场全球电容器组市场
 低压电容器组市场机会、成长动力、产业趋势分析及 2025 - 2034 年预测
 2032 年电容器组市场预测:按类型、电压、安装、连接类型、应用、最终用户和地区进行的全球分析