


 |
市场调查报告书
商品编码
1740752
碳负包装市场机会、成长动力、产业趋势分析及 2025 - 2034 年预测Carbon-negative Packaging Market Opportunity, Growth Drivers, Industry Trend Analysis, and Forecast 2025 - 2034 |
||||||
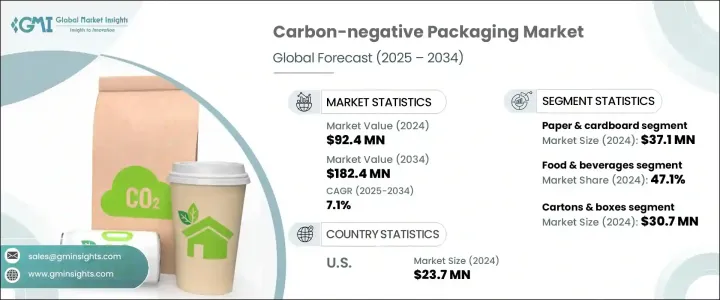
2024年,全球碳负包装市场规模达9,240万美元,预计到2034年将以7.1%的复合年增长率成长,达到1.824亿美元。这得益于塑胶废弃物和碳排放监管压力的不断加大,以及生物基聚合物、可生物降解复合材料和碳捕获利用(CCU)领域的创新。随着全球对永续发展的关注度不断提升,各行各业的企业都在重新规划其包装策略,以最大程度地减少对环境的影响。包装仍是企业碳足迹的主要贡献者,随着对更环保替代品的需求不断增长,各企业正迅速采用碳负解决方案。
这种转变的动力源自于监管要求、投资者预期以及消费者日益青睐环保品牌的偏好。企业不仅将永续包装视为合规要求,更将其视为提升品牌忠诚度和开拓新市场机会的竞争优势。随着越来越多的企业致力于ESG(环境、社会和治理)目标,碳负包装产业正迎来大量投资,用于材料、设计和供应链优化的创新。各大品牌意识到,积极主动迈向碳中和及更高目标,能够在环境管理日益成为成功关键的市场中占据有利地位。
| 市场范围 | |
|---|---|
| 起始年份 | 2024 |
| 预测年份 | 2025-2034 |
| 起始值 | 9240万美元 |
| 预测值 | 1.824亿美元 |
| 复合年增长率 | 7.1% |
随着永续发展成为企业关注的焦点,包装产业正经历一场变革。包装作为企业碳足迹的关键贡献者,如今正受到严格审查,许多企业正在重新评估其减少环境影响的策略。消费者、投资者和监管机构日益增长的压力,促使企业采取更负责任的做法,这促使企业越来越多地转向环保包装替代品。这样做不仅提升了品牌声誉,也体现了对环境责任的承诺。对永续发展的日益关注,导致旨在开发和实施绿色包装解决方案的投资激增。企业正在转向可生物降解聚合物、可回收塑胶和纸板等更符合循环经济原则的材料。
市场根据材料类型进行分类,主要细分领域包括可生物降解聚合物、纸张和纸板、生物基塑胶、有机纤维等。纸张和纸板是主要材料,由于其可回收性、易得性以及对无塑胶包装日益增长的需求,2024 年其价值将达到 3,710 万美元。许多企业,尤其是电商、外带和个人护理行业,选择经 FSC 认证的再生纸包装,以实现永续发展目标,并满足消费者对环保包装的需求。
包装类型包括瓶罐、托盘和容器、纸盒、袋子和小袋、包装纸和薄膜等。 2024年,纸盒和纸箱细分市场产值达3,070万美元。这些包装材料因其强度高、品牌潜力大、可回收性强以及碳封存能力而广受欢迎。纸盒和纸箱在电子商务、零售和餐饮服务业尤其受欢迎,因为永续性是这些产业品牌差异化的关键因素。纸盒和纸箱的碳负性特性使其成为希望提升永续发展资质,同时提供高品质环保包装选择的企业的理想选择。
2024年,美国负碳包装市场规模达2,370万美元,这得益于消费者对环保包装的需求以及企业对ESG目标的坚定承诺。随着环保政策的推进,包括州级塑胶禁令和对供应链排放的严格审查,越来越多的品牌开始采用永续包装。这刺激了老牌包装公司和新兴科技新创公司在碳封存材料和生物塑胶方面的创新。
全球碳负包装产业的主要参与者包括利乐国际公司 (Tetra Pak International SA)、Huhtamaki、Elopak 和 Footprint。这些公司专注于开发尖端解决方案,以满足监管压力和消费者偏好推动的对永续包装日益增长的需求。为了巩固市场地位,公司强调创新与合作。许多公司在研发方面投入大量资金,以创造新的生物基材料,并探索减少碳排放的创新包装设计。
与科技新创公司建立策略伙伴关係,并持续致力于提升包装效率和永续性,使这些公司在竞争中保持领先地位。此外,一些公司正在扩展其产品组合,提供客製化解决方案,以满足食品饮料、电商或化妆品等特定行业的需求。透过将业务策略与全球永续发展目标相结合,这些公司正在提升市场知名度和声誉,吸引更广泛的客户群,并增加其在快速成长的负碳包装领域的份额。
目录
第一章:方法论与范围
第二章:执行摘要
第三章:行业洞察
- 产业生态系统分析
- 影响价值链的因素
- 利润率分析
- 中断
- 未来展望
- 製造商
- 经销商
- 川普政府关税
- 对贸易的影响
- 贸易量中断
- 报復措施
- 对产业的影响
- 供应方影响(原料)
- 主要材料价格波动
- 供应链重组
- 生产成本影响
- 需求面影响(售价)
- 价格传导至终端市场
- 市占率动态
- 消费者反应模式
- 供应方影响(原料)
- 受影响的主要公司
- 策略产业反应
- 供应链重组
- 定价和产品策略
- 政策参与
- 展望与未来考虑
- 对贸易的影响
- 供应商格局
- 利润率分析
- 重要新闻和倡议
- 监管格局
- 衝击力
- 成长动力
- 碳排放和塑胶废物的监管压力
- 企业 ESG 承诺与净零目标
- 生物基聚合物、碳捕获利用 (CCU) 和可生物降解复合材料的创新
- 循环经济和零浪费计划
- 环保包装需求不断成长
- 产业陷阱与挑战
- 生产成本高,规模经济有限
- 性能和功能限制
- 成长动力
- 成长潜力分析
- 波特的分析
- PESTEL分析
第四章:竞争格局
- 介绍
- 公司市占率分析
- 竞争定位矩阵
- 战略展望矩阵
第五章:市场估计与预测:依资料,2021 - 2034 年
- 主要趋势
- 可生物降解聚合物
- 纸和纸板
- 生物基塑料
- 有机纤维
- 其他的
第六章:市场估计与预测:依包装类型,2021 - 2034 年
- 主要趋势
- 瓶子和罐子
- 托盘和容器
- 纸箱和盒子
- 包包和小袋
- 包装纸和薄膜
- 其他的
第七章:市场估计与预测:按最终用途产业,2021 - 2034 年
- 主要趋势
- 食品和饮料
- 个人护理和化妆品
- 医疗保健和製药
- 电子产品
- 其他的
第八章:市场估计与预测:按地区,2021 - 2034 年
- 主要趋势
- 北美洲
- 我们
- 加拿大
- 欧洲
- 英国
- 德国
- 法国
- 义大利
- 西班牙
- 俄罗斯
- 亚太地区
- 中国
- 印度
- 日本
- 韩国
- 澳洲
- 拉丁美洲
- 巴西
- 墨西哥
- MEA
- 南非
- 沙乌地阿拉伯
- 阿联酋
第九章:公司简介
- 360 Containers
- Bunzl UK Ltd
- Elopak
- Emmerson Packaging
- Footprint
- Genpak
- Georg Utz Holding AG
- Get Bamboo
- Green Side of Pink
- Huhtamaki
- Pregis
- Tetra Pak International SA
The Global Carbon-Negative Packaging Market was valued at USD 92.4 million in 2024 and is estimated to grow at a CAGR of 7.1% to reach USD 182.4 million by 2034, driven by increasing regulatory pressure on plastic waste and carbon emissions, along with innovations in bio-based polymers, biodegradable composites, and carbon capture utilization (CCU). As the global focus on sustainability intensifies, businesses across industries are reimagining their packaging strategies to minimize environmental impact. Packaging remains a major contributor to a company's carbon footprint, and with rising demand for greener alternatives, organizations are rapidly adopting carbon-negative solutions.
This shift is fueled by regulatory mandates, investor expectations, and evolving consumer preferences that favor eco-conscious brands. Companies are seeing sustainable packaging not just as a compliance requirement but as a competitive advantage that can boost brand loyalty and unlock new market opportunities. As more companies commit to ESG (Environmental, Social, and Governance) goals, the carbon-negative packaging industry is witnessing significant investment inflows for innovation in materials, design, and supply chain optimization. Brands are realizing that taking proactive steps towards carbon neutrality and beyond can strongly position them in a marketplace where environmental stewardship increasingly defines success.
| Market Scope | |
|---|---|
| Start Year | 2024 |
| Forecast Year | 2025-2034 |
| Start Value | $92.4 Million |
| Forecast Value | $182.4 Million |
| CAGR | 7.1% |
As sustainability becomes a central focus for businesses, the packaging industry is undergoing a transformation. Packaging, being a key contributor to a company's carbon footprint, is now under scrutiny, with many businesses reevaluating their strategies to reduce environmental impact. The growing pressure from consumers, investors, and regulatory bodies to adopt more responsible practices has driven companies to increasingly switch to eco-friendly packaging alternatives. By doing so, they not only enhance their brand reputation but also show a commitment to environmental responsibility. This growing focus on sustainability has led to a surge in investments aimed at developing and implementing green packaging solutions. Businesses are turning to materials such as biodegradable polymers, recyclable plastics, and paperboard, which are more aligned with circular economy principles.
The market is categorized based on material types, with key segments including biodegradable polymers, paper and cardboard, bio-based plastics, organic fibers, and others. Paper and cardboard are the leading materials, valued at USD 37.1 million in 2024, due to their recyclability, availability, and the growing demand for plastic-free packaging. Many businesses, especially e-commerce, food delivery, and personal care industries, opt for FSC-certified and recycled paper-based packaging to meet sustainability targets and satisfy consumer demand for eco-friendly packaging options.
Packaging types include bottles and jars, trays and containers, cartons and boxes, bags and pouches, wrappers and films, and others. In 2024, the cartons and boxes segment generated USD 30.7 million. These packaging materials are popular for their strength, branding potential, and recyclability, as well as their ability to sequester carbon. Cartons and boxes are particularly favored in e-commerce, retail, and food service sectors, where sustainability is a key brand differentiator. Their carbon-negative characteristics make them ideal for companies looking to improve their sustainability credentials while offering a high-quality, eco-friendly packaging option.
The U.S. Carbon-Negative Packaging Market was valued at USD 23.7 million in 2024, driven by consumer demand for environmentally conscious packaging and strong corporate commitments to ESG goals. With eco-friendly policies gaining traction, including state-level plastic bans and heightened scrutiny of supply chain emissions, brands are increasingly adopting sustainable packaging. This has spurred innovation in carbon-sequestering materials and bioplastics from established packaging companies and emerging tech startups.
Key players in the Global Carbon-Negative Packaging Industry include Tetra Pak International S.A., Huhtamaki, Elopak, and Footprint. These companies are focused on developing cutting-edge solutions that meet the growing demand for sustainable packaging driven by regulatory pressures and consumer preferences. To solidify their position in the market, companies emphasize innovation and collaboration. Many invest heavily in research and development to create new bio-based materials and explore innovative packaging designs that reduce carbon emissions.
Strategic partnerships with technology startups, as well as ongoing efforts to improve packaging efficiency and sustainability, allow these companies to stay ahead of the competition. Additionally, some are expanding their product portfolios to include customizable solutions tailored to meet specific industry requirements, such as food and beverage, e-commerce, or cosmetics. By aligning their business strategies with global sustainability goals, these companies are enhancing their market visibility and reputation, attracting a broader customer base, and increasing their share of the rapidly growing carbon-negative packaging sector.
Table of Contents
Chapter 1 Methodology & Scope
- 1.1 Market scope & definitions
- 1.2 Base estimates & calculations
- 1.3 Forecast calculations
- 1.4 Data sources
- 1.4.1 Primary
- 1.4.2 Secondary
- 1.4.2.1 Paid sources
- 1.4.2.2 Public sources
Chapter 2 Executive Summary
- 2.1 Industry synopsis, 2021 - 2034
Chapter 3 Industry Insights
- 3.1 Industry ecosystem analysis
- 3.1.1 Factor affecting the value chain
- 3.1.2 Profit margin analysis
- 3.1.3 Disruptions
- 3.1.4 Future outlook
- 3.1.5 Manufacturers
- 3.1.6 Distributors
- 3.2 Trump administration tariffs
- 3.2.1 Impact on trade
- 3.2.1.1 Trade volume disruptions
- 3.2.1.2 Retaliatory measures
- 3.2.2 Impact on the industry
- 3.2.2.1 Supply-side impact (raw materials)
- 3.2.2.1.1 Price volatility in key materials
- 3.2.2.1.2 Supply chain restructuring
- 3.2.2.1.3 Production cost implications
- 3.2.2.2 Demand-side impact (selling price)
- 3.2.2.2.1 Price transmission to end markets
- 3.2.2.2.2 Market share dynamics
- 3.2.2.2.3 Consumer response patterns
- 3.2.2.1 Supply-side impact (raw materials)
- 3.2.3 Key companies impacted
- 3.2.4 Strategic industry responses
- 3.2.4.1 Supply chain reconfiguration
- 3.2.4.2 Pricing and product strategies
- 3.2.4.3 Policy engagement
- 3.2.5 Outlook and future considerations
- 3.2.1 Impact on trade
- 3.3 Supplier landscape
- 3.4 Profit margin analysis
- 3.5 Key news & initiatives
- 3.6 Regulatory landscape
- 3.7 Impact forces
- 3.7.1 Growth drivers
- 3.7.1.1 Regulatory pressure on carbon emissions and plastic waste
- 3.7.1.2 Corporate ESG commitments and net-zero goals
- 3.7.1.3 Innovations in bio-based polymers, carbon capture utilization (CCU), and biodegradable composites
- 3.7.1.4 Circular economy and zero-waste initiatives
- 3.7.1.5 Growing demand for eco-friendly packaging
- 3.7.2 Industry pitfalls & challenges
- 3.7.2.1 High production costs and limited economies of scale
- 3.7.2.2 Performance and functional limitations
- 3.7.1 Growth drivers
- 3.8 Growth potential analysis
- 3.9 Porter's analysis
- 3.10 PESTEL analysis
Chapter 4 Competitive Landscape, 2024
- 4.1 Introduction
- 4.2 Company market share analysis
- 4.3 Competitive positioning matrix
- 4.4 Strategic outlook matrix
Chapter 5 Market Estimates & Forecast, By Material, 2021 - 2034 (USD Million & Kilo Tons)
- 5.1 Key trends
- 5.2 Biodegradable polymers
- 5.3 Paper & cardboard
- 5.4 Bio-based plastics
- 5.5 Organic fibers
- 5.6 Others
Chapter 6 Market Estimates & Forecast, By Packaging Type, 2021 - 2034 (USD Million & Kilo Tons)
- 6.1 Key trends
- 6.2 Bottles & jars
- 6.3 Trays & containers
- 6.4 Cartons & boxes
- 6.5 Bags & pouches
- 6.6 Wrappers & films
- 6.7 Others
Chapter 7 Market Estimates & Forecast, By End Use Industry, 2021 - 2034 (USD Million & Kilo Tons)
- 7.1 Key trends
- 7.2 Food & beverage
- 7.3 Personal care & cosmetics
- 7.4 Healthcare & pharmaceuticals
- 7.5 Electronics
- 7.6 Others
Chapter 8 Market Estimates & Forecast, By Region, 2021 - 2034 (USD Million & Kilo Tons)
- 8.1 Key trends
- 8.2 North America
- 8.2.1 U.S.
- 8.2.2 Canada
- 8.3 Europe
- 8.3.1 UK
- 8.3.2 Germany
- 8.3.3 France
- 8.3.4 Italy
- 8.3.5 Spain
- 8.3.6 Russia
- 8.4 Asia Pacific
- 8.4.1 China
- 8.4.2 India
- 8.4.3 Japan
- 8.4.4 South Korea
- 8.4.5 Australia
- 8.5 Latin America
- 8.5.1 Brazil
- 8.5.2 Mexico
- 8.6 MEA
- 8.6.1 South Africa
- 8.6.2 Saudi Arabia
- 8.6.3 UAE
Chapter 9 Company Profiles
- 9.1 360 Containers
- 9.2 Bunzl UK Ltd
- 9.3 Elopak
- 9.4 Emmerson Packaging
- 9.5 Footprint
- 9.6 Genpak
- 9.7 Georg Utz Holding AG
- 9.8 Get Bamboo
- 9.9 Green Side of Pink
- 9.10 Huhtamaki
- 9.11 Pregis
- 9.12 Tetra Pak International S.A.
 全球可种植包装市场可堆肥食品服务包装的全球市场全球可回收包装市场
 2032 年再生包装市场预测:按材料、包装类型、应用和地区进行的全球分析可堆肥包装市场按材料、产品、应用和地区划分
 2025年全球环保化妆品包装市场报告可堆肥包装薄膜市场机会、成长动力、产业趋势分析及 2025 - 2034 年预测碳负塑胶市场规模、份额、趋势分析报告:按产品类型、最终用途、细分市场预测,2025-2030 年2025年全球单一材料包装市场报告2032 年植物栽培包装市场预测:按类型、材料、包装类型、包装尺寸、消费者人口统计、最终用户和地区进行的全球分析