


 |
市场调查报告书
商品编码
1740814
寿司级海鲜市场机会、成长动力、产业趋势分析及 2025 - 2034 年预测Sushi Grade Seafood Market Opportunity, Growth Drivers, Industry Trend Analysis, and Forecast 2025 - 2034 |
||||||
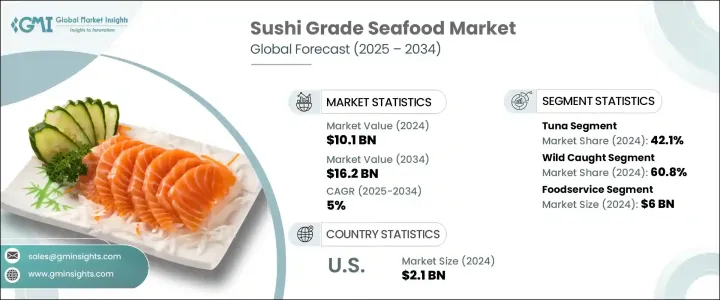
2024年,全球寿司级海鲜市场规模达101亿美元,预计2034年将以5%的复合年增长率成长至162亿美元。这一强劲的成长势头反映出全球对优质海鲜的需求日益增长,尤其是在寿司日益受到不同人群和地区的青睐的背景下。人们对日本料理的兴趣日益浓厚,加之人们的健康意识不断增强以及对高端餐饮体验的追求,推动了寿司级海鲜需求的大幅增长。这些产品不仅是一种烹饪潮流,更是注重健康的消费者寻求营养丰富、清洁标籤蛋白质的生活方式选择。寿司级海鲜符合严格的品质、安全和新鲜度标准,使其既适合生食,又不会损害健康。严格的冷链物流和温度控制消除了寄生虫和病原体的风险,确保海鲜从捕捞到餐桌的整个过程中始终保持安全新鲜。
全球市场正在经历消费习惯和购买管道的转变。随着消费者对寿司和生鲜海鲜烹饪知识的日益丰富,许多人开始自信地在家中烹饪。零售商和线上海鲜平台正抓住这一趋势,提供符合专业标准的精选寿司级鱼类。从高级餐厅到家庭厨房,寿司级海鲜如今已成为现代消费者饮食中不可或缺的一部分,尤其是在追求高蛋白、低脂肪和营养丰富的消费者群体中。社群媒体和数位饮食文化进一步刺激了这一需求,寿司在美食部落格、网红内容和健康生活方式趋势中占据显着位置。家庭餐盒和订阅式海鲜配送服务的普及也扩大了市场,让消费者足不出户即可享用餐厅品质的寿司。
| 市场范围 | |
|---|---|
| 起始年份 | 2024 |
| 预测年份 | 2025-2034 |
| 起始值 | 101亿美元 |
| 预测值 | 162亿美元 |
| 复合年增长率 | 5% |
在美国,寿司级海鲜仍然是一个突出的类别,2024 年市场规模达 21 亿美元,预计到 2034 年复合年增长率将稳定在 5%。美国市场受益于强大的外食文化,但随着消费者越来越习惯在家製作寿司,寿司零售额也正在增加。沿海城市继续引领消费,但由于更完善的物流和覆盖全国的分销网络,寿司的受欢迎程度正在向内陆地区扩展。线上海鲜零售商和特色食品杂货商是这项变革的关键参与者,他们提供新鲜、高品质、完全可追溯且经过认证的海鲜,吸引了注重环保和健康的消费者。
亚洲作为寿司生产大国和主要消费市场,依然占据主导地位,其主导力量是拥有丰富烹饪传统的国家。然而,欧洲正在迅速赶上,越来越多的寿司餐厅和高级超市向更广泛的消费者群体推出寿司级产品。在收入成长和饮食偏好变化的推动下,英国、德国和法国等国家在这一领域实现了两位数的成长。
依产品类型划分,市场可分为鲔鱼、虾、鲑鱼等。鲔鱼占最大的市场份额,2024 年为 42.1%。鲔鱼以其丝滑的口感、浓郁的风味和高端的定位而闻名,仍然是寿司爱好者的首选,尤其是在高级餐厅。蓝鳍鲔鱼等高脂肪品种占据了顶级寿司菜单的主导地位,而对可持续和符合道德标准的采购产品日益增长的需求,正推动生产商转向经过认证的、具有环保意识的采购方式。
在采购方式方面,野生捕捞海鲜占据市场主导地位,占60.8%,这得益于消费者对优质口味和更高营养价值的认知。然而,随着全球监管趋严和自然资源面临压力,人工养殖逐渐兴起,以满足持续的品质和供应需求。水产养殖系统日益先进,能够提供符合安全标准、可追溯性和永续性目标的高品质鲔鱼、鲑鱼和虾子。
Tassal Group、Grupo Nueva Pescanova、Cermaq、Proximar Seafood 和 Bakkafrost 等产业领导者正在采取策略性倡议,巩固自身地位。这些公司正大力投资永续水产养殖技术,拓展数位销售平台,并开发环保、可追溯的供应链。许多公司也正在寻求产品认证,并与高端零售和酒店品牌建立策略合作伙伴关係,以扩大市场份额并触及新的消费群体。
目录
第一章:方法论与范围
第二章:执行摘要
第三章:行业洞察
- 产业生态系统分析
- 影响价值链的因素
- 利润率分析
- 中断
- 未来展望
- 製造商
- 经销商
- 川普政府关税
- 对贸易的影响
- 贸易量中断
- 报復措施
- 对产业的影响
- 供应方影响(原料)
- 主要材料价格波动
- 供应链重组
- 生产成本影响
- 需求面影响(售价)
- 价格传导至终端市场
- 市占率动态
- 消费者反应模式
- 供应方影响(原料)
- 受影响的主要公司
- 策略产业反应
- 供应链重组
- 定价和产品策略
- 政策参与
- 展望与未来考虑
- 对贸易的影响
- 贸易统计(HS编码)
- 2021-2024年主要出口国
- 2021-2024年主要进口国
註:以上贸易统计仅针对重点国家。
- 供应商格局
- 利润率分析
- 重要新闻和倡议
- 监管格局
- 衝击力
- 成长动力
- 全球对寿司的热爱刺激了对优质海鲜的需求。
- 寿司级海鲜符合健康和低脂饮食。
- 电子商务和 DIY 套件让每个人都能享用寿司。
- 产业陷阱与挑战
- 严格的品质控制增加了操作的复杂性。
- 环境限制和采购问题对供应链带来压力。
- 成长动力
- 成长潜力分析
- 波特的分析
- PESTEL分析
第四章:竞争格局
- 介绍
- 公司市占率分析
- 竞争定位矩阵
- 战略展望矩阵
第五章:市场规模及预测:依类型,2021 年至 2034 年
- 主要趋势
- 鲔鱼
- 鲑鱼
- 虾
- 其他(章鱼、鱿鱼等)
第六章:市场规模及预测:依采购,2021 年至 2034 年
- 主要趋势
- 野生捕获
- 养殖
- 其他的
第七章:市场规模及预测:依配销通路,2021 年至 2034 年
- 主要趋势
- 餐饮服务
- 零售
- 直销
第八章:市场估计与预测:按地区,2021 年至 2034 年
- 主要趋势
- 北美洲
- 我们
- 加拿大
- 欧洲
- 德国
- 英国
- 法国
- 西班牙
- 义大利
- 荷兰
- 亚太地区
- 中国
- 印度
- 日本
- 澳洲
- 韩国
- 拉丁美洲
- 巴西
- 墨西哥
- 阿根廷
- 中东和非洲
- 沙乌地阿拉伯
- 南非
- 阿联酋
第九章:公司简介
- Bakkafrost
- Blue Ocean Mariculture
- Cermaq
- Faroe Islands Salmon Producers
- Grupo Nueva Pescanova
- Ming Hong International
- Mt. Cook Alpine Salmon
- Proximar Seafood
- Seatopia
- Tassal Group
The Global Sushi Grade Seafood Market was valued at USD 10.1 billion in 2024 and is projected to grow at a CAGR of 5% to reach USD 16.2 billion by 2034. This impressive growth trajectory reflects the rising global appetite for premium, high-quality seafood, particularly as sushi continues to gain popularity across diverse demographics and regions. The growing interest in Japanese cuisine, combined with increasing health consciousness and a desire for upscale dining experiences, is driving a significant surge in demand for sushi-grade seafood. These products are not just a culinary trend-they are a lifestyle choice for health-focused consumers seeking nutritious, clean-label proteins. Sushi-grade seafood is held to strict quality, safety, and freshness standards, making it suitable for raw consumption without compromising health. Strict cold chain logistics and temperature controls eliminate risks from parasites and pathogens, ensuring the seafood remains safe and fresh from sea to table.
The global market is experiencing a shift in both consumption habits and purchasing channels. As consumers become more knowledgeable about sushi and raw seafood preparation, many are turning to home preparation with confidence. Retailers and online seafood platforms are capitalizing on this trend, offering curated selections of sushi-grade fish that meet professional standards. From fine dining to home kitchens, sushi-grade seafood is now a staple in the modern consumer's diet, especially among those seeking high-protein, low-fat, and nutrient-rich food options. Social media and digital food culture have further fueled the demand, with sushi appearing prominently in food blogs, influencer content, and healthy lifestyle trends. The accessibility of home meal kits and subscription-based seafood delivery services has also expanded the market, allowing consumers to enjoy restaurant-quality sushi from the comfort of home.
| Market Scope | |
|---|---|
| Start Year | 2024 |
| Forecast Year | 2025-2034 |
| Start Value | $10.1 Billion |
| Forecast Value | $16.2 Billion |
| CAGR | 5% |
In the United States, sushi-grade seafood remains a standout category, generating USD 2.1 billion in 2024 with a steady 5% CAGR projected through 2034. The US market benefits from a strong dining-out culture, but retail sales are gaining momentum as consumers become more comfortable preparing sushi at home. Coastal cities continue to lead in consumption, but sushi's popularity is expanding into inland regions thanks to better logistics and nationwide distribution networks. Online seafood retailers and specialty grocers are key players in this evolution, offering fresh, high-quality seafood with full traceability and certification, appealing to environmentally and health-conscious buyers.
Asia maintains its dominance as a production powerhouse and major consumer market, led by countries with rich culinary traditions. However, Europe is quickly catching up, with an increasing number of sushi restaurants and high-end supermarkets introducing sushi-grade offerings to a broader consumer base. Countries like the UK, Germany, and France are seeing double-digit growth in this segment, driven by rising incomes and changing food preferences.
By product type, the market is segmented into tuna, shrimp, salmon, and others. Tuna holds the largest market share at 42.1% in 2024. Known for its velvety texture, rich flavor, and premium positioning, tuna remains the preferred choice for sushi lovers, especially in fine dining establishments. High-fat varieties like bluefin tuna dominate top-tier sushi menus, while the growing demand for sustainable and ethically sourced options is pushing producers toward certified, eco-conscious sourcing practices.
When it comes to sourcing methods, wild-caught seafood leads the market with a 60.8% share, driven by consumer perceptions of superior taste and higher nutritional value. However, as global regulations tighten and natural resources face strain, farm-raised options are stepping in to meet consistent quality and supply demands. Aquaculture systems are becoming more advanced, offering high-quality tuna, salmon, and shrimp that align with safety standards, traceability, and sustainability goals.
Industry leaders such as Tassal Group, Grupo Nueva Pescanova, Cermaq, Proximar Seafood, and Bakkafrost are taking strategic steps to solidify their positions. These companies are heavily investing in sustainable aquaculture technologies, expanding digital sales platforms, and developing eco-friendly, traceable supply chains. Many are also pursuing product certifications and forming strategic partnerships with premium retail and hospitality brands to broaden their market presence and reach new consumer segments.
Table of Contents
Chapter 1 Methodology & Scope
- 1.1 Market scope & definition
- 1.2 Base estimates & calculations
- 1.3 Forecast calculation
- 1.4 Data sources
- 1.4.1 Primary
- 1.4.2 Secondary
- 1.4.2.1 Paid sources
- 1.4.2.2 Public sources
- 1.5 Primary research and validation
- 1.5.1 Primary sources
- 1.5.2 Data mining sources
Chapter 2 Executive Summary
- 2.1 Industry synopsis, 2021-2034
Chapter 3 Industry Insights
- 3.1 Industry ecosystem analysis
- 3.1.1 Factor affecting the value chain
- 3.1.2 Profit margin analysis
- 3.1.3 Disruptions
- 3.1.4 Future outlook
- 3.1.5 Manufacturers
- 3.1.6 Distributors
- 3.2 Trump administration tariffs
- 3.2.1 Impact on trade
- 3.2.1.1 Trade volume disruptions
- 3.2.1.2 Retaliatory measures
- 3.2.2 Impact on the industry
- 3.2.2.1 Supply-side impact (raw materials)
- 3.2.2.1.1 Price volatility in key materials
- 3.2.2.1.2 Supply chain restructuring
- 3.2.2.1.3 Production cost implications
- 3.2.2.2 Demand-side impact (selling price)
- 3.2.2.2.1 Price transmission to end markets
- 3.2.2.2.2 Market share dynamics
- 3.2.2.2.3 Consumer response patterns
- 3.2.2.1 Supply-side impact (raw materials)
- 3.2.3 Key companies impacted
- 3.2.4 Strategic industry responses
- 3.2.4.1 Supply chain reconfiguration
- 3.2.4.2 Pricing and product strategies
- 3.2.4.3 Policy engagement
- 3.2.5 Outlook and future considerations
- 3.2.1 Impact on trade
- 3.3 Trade statistics (HS Code)
- 3.3.1 Major exporting countries, 2021-2024 (Kilo Tons)
- 3.3.2 Major importing countries, 2021-2024 (Kilo Tons)
Note: the above trade statistics will be provided for key countries only.
- 3.4 Supplier landscape
- 3.5 Profit margin analysis
- 3.6 Key news & initiatives
- 3.7 Regulatory landscape
- 3.8 Impact forces
- 3.8.1 Growth drivers
- 3.8.1.1 Global appetite for sushi fuels demand for premium seafood.
- 3.8.1.2 Sushi grade seafood aligns with wellness and low-fat diets.
- 3.8.1.3 E-commerce and DIY kits make sushi accessible to all.
- 3.8.2 Industry pitfalls & challenges
- 3.8.2.1 Stringent quality controls drive up operational complexity.
- 3.8.2.2 Environmental limits and sourcing issues strain supply chains.
- 3.8.1 Growth drivers
- 3.9 Growth potential analysis
- 3.10 Porter's analysis
- 3.11 PESTEL analysis
Chapter 4 Competitive Landscape, 2024
- 4.1 Introduction
- 4.2 Company market share analysis
- 4.3 Competitive positioning matrix
- 4.4 Strategic outlook matrix
Chapter 5 Market Size and Forecast, By Type, 2021 – 2034 (USD Billion, Kilo Tons)
- 5.1 Key trends
- 5.2 Tuna
- 5.3 Salmon
- 5.4 Shrimp
- 5.5 Others (octopus, squid, etc.)
Chapter 6 Market Size and Forecast, By Sourcing, 2021 – 2034 (USD Billion, Kilo Tons)
- 6.1 Key trends
- 6.2 Wild caught
- 6.3 Farmed
- 6.4 Others
Chapter 7 Market Size and Forecast, By Distribution Channel, 2021 – 2034 (USD Billion, Kilo Tons)
- 7.1 Key trends
- 7.2 Foodservice
- 7.3 Retail
- 7.4 Direct sales
Chapter 8 Market Estimates and Forecast, By Region, 2021 – 2034 (USD Billion) (Kilo Tons)
- 8.1 Key trends
- 8.2 North America
- 8.2.1 U.S.
- 8.2.2 Canada
- 8.3 Europe
- 8.3.1 Germany
- 8.3.2 UK
- 8.3.3 France
- 8.3.4 Spain
- 8.3.5 Italy
- 8.3.6 Netherlands
- 8.4 Asia Pacific
- 8.4.1 China
- 8.4.2 India
- 8.4.3 Japan
- 8.4.4 Australia
- 8.4.5 South Korea
- 8.5 Latin America
- 8.5.1 Brazil
- 8.5.2 Mexico
- 8.5.3 Argentina
- 8.6 Middle East and Africa
- 8.6.1 Saudi Arabia
- 8.6.2 South Africa
- 8.6.3 UAE
Chapter 9 Company Profiles
- 9.1 Bakkafrost
- 9.2 Blue Ocean Mariculture
- 9.3 Cermaq
- 9.4 Faroe Islands Salmon Producers
- 9.5 Grupo Nueva Pescanova
- 9.6 Ming Hong International
- 9.7 Mt. Cook Alpine Salmon
- 9.8 Proximar Seafood
- 9.9 Seatopia
- 9.10 Tassal Group