


 |
市场调查报告书
商品编码
1740849
启动肥料市场机会、成长动力、产业趋势分析及 2025 - 2034 年预测Starter Fertilizers Market Opportunity, Growth Drivers, Industry Trend Analysis, and Forecast 2025 - 2034 |
||||||
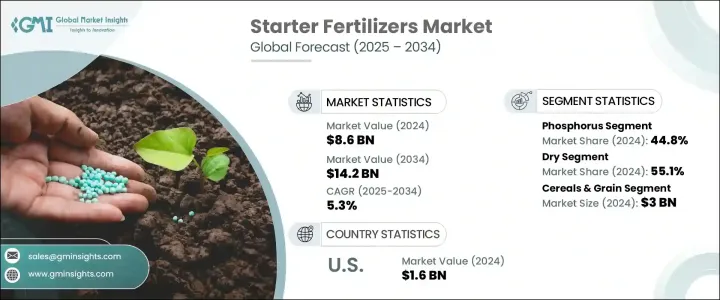
2024年,全球幼苗肥料市场规模达86亿美元,预计到2034年将以5.3%的复合年增长率成长,达到142亿美元。这得益于人们对现代农业实践的日益依赖以及对最大化植物早期发育的日益重视。随着农民寻求高效且可持续的方法来促进植物早期健康并最大限度地提高总产量,幼苗肥料正成为全球作物生产系统中至关重要的组成部分。随着粮食需求的不断增长、可耕地面积的不断减少以及优化作物生命週期各个阶段的压力日益增大,幼苗肥料在精准农业中占据核心地位。这些产品不仅能帮助种植者解决土壤养分缺乏问题,还能在恶劣的气候条件下支持作物的持续生长。人口增长、饮食偏好向植物性食物的转变以及全球减少农业环境影响的行动也加剧了幼苗肥料的需求。随着越来越多的国家采用永续集约化策略,幼苗肥料市场有望实现长期成长。对数位农业技术、GPS 种植系统和土壤分析工具的投资不断增加,进一步增强了起始肥料的吸引力,尤其是对于寻求有针对性营养解决方案的技术型种植者。
启动肥料旨在种植时直接提供氮、磷、钾和微量元素等必需营养素,促进根系强健生长,并增强幼苗早期活力。随着永续农业和作物产量优化的持续发展,种植者正转向这些配方,以确保从第一天起就能获得最佳的养分供应。它们能够改善幼苗出苗率、植株均匀度和养分吸收,使其成为多种作物的首选。
| 市场范围 | |
|---|---|
| 起始年份 | 2024 |
| 预测年份 | 2025-2034 |
| 起始值 | 86亿美元 |
| 预测值 | 142亿美元 |
| 复合年增长率 | 5.3% |
幼苗肥料通常在播种期间施于靠近种子的地方,最常用于谷物、大豆和蔬菜等作物。近年来,液体幼苗肥料因其易于施用和养分快速释放而得到越来越多的采用。然而,干配方肥料由于其更长的保质期、更高的成本效益以及与标准农具的兼容性,仍然在全球市场占据主导地位。该领域的创新也在加速发展,製造商不断提高养分的溶解度并添加微量元素,以创造出更符合特定土壤状况和作物需求的客製化解决方案。
在关键营养成分中,磷占据主导地位,2024 年的市占率为 44.8%,预计到 2034 年将以 5.1% 的复合年增长率成长。磷在植物早期生长阶段至关重要,在根系形成和植物代谢所必需的能量转移过程中发挥核心作用。在种植过程中有效施用磷,有助于幼苗更快、更均匀地生长,从而长出更强壮、更健康的作物。旨在提高磷溶解度和植物吸收率的持续进展,将继续巩固其市场主导地位。
就形态而言,干性肥料在2024年占据了55.1%的市场份额,预计复合年增长率为5.3%。农民青睐干性肥料,因为它们易于储存、经久耐用,并且适用于各种作物。颗粒状和丸状肥料因其高养分浓度和混合灵活性,在大规模农业经营中尤其受欢迎。这些干性肥料使种植者能够根据土壤测试资料调整施肥,从而更准确、更经济地满足作物特定的养分需求。
美国幼苗肥料市场在2024年产值达16亿美元,预计到2034年将以5%的复合年增长率成长。这一增长得益于美国大规模种植玉米、大豆和小麦等高产作物,而幼苗肥料在促进作物发芽和早期根系发育方面发挥关键作用。精准农业和智慧农业技术的兴起——包括GPS导航播种机和变数施肥——正在进一步加速这些投入品在美国农田的应用。
包括先正达、UPL、CF Industries、雅苒和Nufarm Agri Solution在内的肥料行业领导者正在积极投资先进的营养技术,并扩大其生产能力。这些公司正在建立策略性分销合作伙伴关係,推出针对特定作物和地区的产品线,并将数位农业工具融入其产品中。此外,他们还支持种植者教育和产品培训项目,以提高产品采用率,并确保产品在不同的土壤和气候条件下保持最佳性能。
目录
第一章:方法论与范围
第二章:执行摘要
第三章:行业洞察
- 产业生态系统分析
- 影响价值链的因素
- 利润率分析
- 中断
- 未来展望
- 製造商
- 经销商
- 川普政府关税
- 对贸易的影响
- 贸易量中断
- 报復措施
- 对产业的影响
- 供应方影响(原料)
- 主要材料价格波动
- 供应链重组
- 生产成本影响
- 需求面影响(销售价格)
- 价格传导至终端市场
- 市占率动态
- 消费者反应模式
- 供应方影响(原料)
- 受影响的主要公司
- 策略产业反应
- 供应链重组
- 定价和产品策略
- 政策参与
- 展望与未来考虑
- 对贸易的影响
- 贸易统计(HS编码)
- 2021-2024年主要出口国
- 2021-2024年主要进口国
註:以上贸易统计仅针对重点国家。
- 供应商格局
- 利润率分析
- 重要新闻和倡议
- 监管格局
- 衝击力
- 成长动力
- 对作物高产量和早期植物活力的需求不断增长
- 采用精准农业及高效营养管理
- 耕地面积减少推动产量最佳化
- 产业陷阱与挑战
- 精密应用设备初始投资高
- 监管挑战和合规问题
- 成长动力
- 成长潜力分析
- 波特的分析
- PESTEL分析
第四章:竞争格局
- 介绍
- 公司市占率分析
- 竞争定位矩阵
- 战略展望矩阵
第五章:市场规模及预测:依类型,2021 - 2034
- 主要趋势
- 磷
- 磷酸一铵
- 磷酸二铵
- 磷酸铵
- 氮
- 硝酸铵
- 硫酸铵
- 钾
- 氯化钾
- 硫酸钾镁
- 硫酸钾
- 微量营养素
- 硫
- 锌
- 硼
- 其他的
第六章:市场规模及预测:依形式,2021 - 2034
- 主要趋势
- 干燥
- 液体
第七章:市场规模及预测:依作物类型,2021 - 2034
- 主要趋势
- 谷物和谷类
- 玉米
- 小麦
- 米
- 大麦
- 水果和蔬菜
- 油籽和豆类
- 大豆
- 向日葵
- 油菜籽
- 饲料作物
- 其他的
第八章:市场估计与预测:按地区,2021 - 2034 年
- 主要趋势
- 北美洲
- 我们
- 加拿大
- 欧洲
- 德国
- 英国
- 法国
- 西班牙
- 义大利
- 荷兰
- 亚太地区
- 中国
- 印度
- 日本
- 澳洲
- 韩国
- 拉丁美洲
- 巴西
- 墨西哥
- 阿根廷
- 中东和非洲
- 沙乌地阿拉伯
- 南非
- 阿联酋
第九章:公司简介
- CF Industries
- CHS
- ICL
- K+S Aktiengesellschaft
- Mosaic
- NUFARM AGRI SOLUTIONS
- Syngenta
- UPL
- Uralchem
- YARA
The Global Starter Fertilizers Market was valued at USD 8.6 billion in 2024 and is estimated to grow at a CAGR of 5.3% to reach USD 14.2 billion by 2034, driven by the increasing reliance on modern agricultural practices and the growing emphasis on maximizing early-stage plant development. Starter fertilizers are becoming a vital component in crop production systems across the globe as farmers seek efficient and sustainable ways to boost early plant health and maximize overall yield. With rising food demand, shrinking arable land, and growing pressure to optimize every stage of the crop lifecycle, starter fertilizers are taking center stage in precision agriculture. These products are not only helping growers address nutrient deficiencies in the soil but also supporting consistent crop establishment, even under challenging climatic conditions. The demand is also reinforced by the rise in population, shifting dietary preferences toward plant-based foods, and the global movement toward reducing agricultural environmental impact. As more countries adopt sustainable intensification strategies, the starter fertilizers market is poised for long-term growth. Increasing investments in digital farming technologies, GPS-enabled planting systems, and soil analytics tools further enhance the appeal of starter fertilizers, particularly among tech-savvy growers looking for targeted nutrient solutions.
Starter fertilizers are engineered to deliver essential nutrients like nitrogen, phosphorus, potassium, and micronutrients directly at planting, where they encourage robust root growth and early seedling vigor. As sustainable farming and crop yield optimization continues to gain momentum, growers are turning to these formulations to ensure optimal nutrient availability from day one. Their ability to improve seedling emergence, plant uniformity, and nutrient uptake makes them a top choice across a broad range of crops.
| Market Scope | |
|---|---|
| Start Year | 2024 |
| Forecast Year | 2025-2034 |
| Start Value | $8.6 Billion |
| Forecast Value | $14.2 Billion |
| CAGR | 5.3% |
Starter fertilizers are typically applied in close proximity to the seed during planting and are most commonly used in crops such as cereals, soybeans, and vegetables. In recent years, liquid starter fertilizers have seen increased adoption due to their ease of application and faster nutrient availability. However, dry formulations still lead the global market due to their longer shelf life, cost-efficiency, and compatibility with standard farming equipment. Innovation is also accelerating in this space, with manufacturers enhancing nutrient solubility and incorporating trace elements to create more tailored solutions that align with specific soil profiles and crop needs.
Among the key nutrient segments, phosphorus holds the lead with a 44.8% market share in 2024 and is expected to grow at a CAGR of 5.1% through 2034. Phosphorus is crucial during early growth stages, playing a central role in root formation and energy transfer processes essential for plant metabolism. When applied efficiently at planting, phosphorus helps seedlings establish more quickly and uniformly, which results in stronger, healthier crops. Ongoing advancements aimed at improving phosphorus solubility and plant uptake continue to support its market dominance.
In terms of form, dry starter fertilizers accounted for a 55.1% share of the market in 2024 and are forecasted to grow at a CAGR of 5.3%. Farmers favor dry formulations for their ease of storage, durability, and adaptability to various crop types. Granular and pelletized versions are especially popular in large-scale farming operations because of their high nutrient concentration and flexibility for blending. These dry fertilizers enable growers to fine-tune applications based on soil test data, helping them meet crop-specific nutrient demands more accurately and cost-effectively.
The United States Starter Fertilizers Market generated USD 1.6 billion in 2024 and is expected to grow at a CAGR of 5% through 2034. This growth is supported by the country's large-scale production of high-yield crops such as corn, soybeans, and wheat, where starter fertilizers play a key role in enhancing germination and early root development. The rise of precision agriculture and smart farming technologies-including GPS-guided planters and variable-rate fertilizer applications-is further accelerating the adoption of these inputs across American farmlands.
Leading players in the starter fertilizers industry, including Syngenta, UPL, CF Industries, Yara, and Nufarm Agri Solution, are actively investing in advanced nutrient technologies and expanding their production capabilities. These companies are forming strategic distribution partnerships, launching crop- and region-specific product lines, and integrating digital agriculture tools into their offerings. Additionally, they are supporting grower education and product training programs to boost adoption rates and ensure optimal product performance across varying soil and climate conditions.
Table of Contents
Chapter 1 Methodology & Scope
- 1.1 Market scope & definition
- 1.2 Base estimates & calculations
- 1.3 Forecast calculation
- 1.4 Data sources
- 1.4.1 Primary
- 1.4.2 Secondary
- 1.4.2.1 Paid sources
- 1.4.2.2 Public sources
- 1.5 Primary research and validation
- 1.5.1 Primary sources
- 1.5.2 Data mining sources
Chapter 2 Executive Summary
- 2.1 Industry synopsis, 2021 - 2034
Chapter 3 Industry Insights
- 3.1 Industry ecosystem analysis
- 3.1.1 Factor affecting the value chain
- 3.1.2 Profit margin analysis
- 3.1.3 Disruptions
- 3.1.4 Future outlook
- 3.1.5 Manufacturers
- 3.1.6 Distributors
- 3.2 Trump administration tariffs
- 3.2.1 Impact on trade
- 3.2.1.1 Trade volume disruptions
- 3.2.1.2 Retaliatory measures
- 3.2.2 Impact on the industry
- 3.2.2.1 Supply-Side impact (Raw Materials)
- 3.2.2.1.1 Price volatility in key materials
- 3.2.2.1.2 Supply chain restructuring
- 3.2.2.1.3 Production cost implications
- 3.2.2.2 Demand-Side impact (Selling Price)
- 3.2.2.2.1 Price transmission to end markets
- 3.2.2.2.2 Market share dynamics
- 3.2.2.2.3 Consumer response patterns
- 3.2.2.1 Supply-Side impact (Raw Materials)
- 3.2.3 Key companies impacted
- 3.2.4 Strategic industry responses
- 3.2.4.1 Supply chain reconfiguration
- 3.2.4.2 Pricing and product strategies
- 3.2.4.3 Policy engagement
- 3.2.5 Outlook and future considerations
- 3.2.1 Impact on trade
- 3.3 Trade statistics (HS Code)
- 3.3.1 Major exporting countries, 2021-2024 (Kilo Tons)
- 3.3.2 Major importing countries, 2021-2024 (Kilo Tons)
Note: the above trade statistics will be provided for key countries only.
- 3.4 Supplier landscape
- 3.5 Profit margin analysis
- 3.6 Key news & initiatives
- 3.7 Regulatory landscape
- 3.8 Impact forces
- 3.8.1 Growth drivers
- 3.8.1.1 Rising demand for high crop yields and early plant vigor
- 3.8.1.2 Adoption of precision agriculture and efficient nutrient management
- 3.8.1.3 Shrinking arable land driving yield optimization
- 3.8.2 Industry pitfalls & challenges
- 3.8.2.1 High initial investment in precision application equipment
- 3.8.2.2 Regulatory challenges and compliance issues
- 3.8.1 Growth drivers
- 3.9 Growth potential analysis
- 3.10 Porter's analysis
- 3.11 PESTEL analysis
Chapter 4 Competitive Landscape, 2024
- 4.1 Introduction
- 4.2 Company market share analysis
- 4.3 Competitive positioning matrix
- 4.4 Strategic outlook matrix
Chapter 5 Market Size and Forecast, By Type, 2021 - 2034 (USD Billion, Units)
- 5.1 Key trends
- 5.2 Phosphorus
- 5.2.1 Monoammonium phosphate
- 5.2.2 Diammonium phosphate
- 5.2.3 Ammonium phosphate
- 5.3 Nitrogen
- 5.3.1 Ammonium nitrate
- 5.3.2 Ammonium sulfate
- 5.4 Potassium
- 5.4.1 Potassium chloride
- 5.4.2 Potassium magnesium sulfate
- 5.4.3 Potassium sulfate
- 5.5 Micronutrient
- 5.5.1 Sulfur
- 5.5.2 Zinc
- 5.5.3 Boron
- 5.5.4 Others
Chapter 6 Market Size and Forecast, By Form, 2021 - 2034 (USD Billion, Units)
- 6.1 Key trends
- 6.2 Dry
- 6.3 Liquid
Chapter 7 Market Size and Forecast, By Crop Type, 2021 - 2034 (USD Billion, Units)
- 7.1 Key trends
- 7.2 Cereal & grains
- 7.2.1 Corn
- 7.2.2 Wheat
- 7.2.3 Rice
- 7.2.4 Barley
- 7.3 Fruit & vegetables
- 7.4 Oilseeds & pulses
- 7.4.1 Soybean
- 7.4.2 Sunflower
- 7.4.3 Canola
- 7.5 Forage crops
- 7.6 Others
Chapter 8 Market Estimates and Forecast, By Region, 2021 - 2034 (USD Billion) (Units)
- 8.1 Key trends
- 8.2 North America
- 8.2.1 U.S.
- 8.2.2 Canada
- 8.3 Europe
- 8.3.1 Germany
- 8.3.2 UK
- 8.3.3 France
- 8.3.4 Spain
- 8.3.5 Italy
- 8.3.6 Netherlands
- 8.4 Asia Pacific
- 8.4.1 China
- 8.4.2 India
- 8.4.3 Japan
- 8.4.4 Australia
- 8.4.5 South Korea
- 8.5 Latin America
- 8.5.1 Brazil
- 8.5.2 Mexico
- 8.5.3 Argentina
- 8.6 Middle East and Africa
- 8.6.1 Saudi Arabia
- 8.6.2 South Africa
- 8.6.3 UAE
Chapter 9 Company Profiles
- 9.1 CF Industries
- 9.2 CHS
- 9.3 ICL
- 9.4 K+S Aktiengesellschaft
- 9.5 Mosaic
- 9.6 NUFARM AGRI SOLUTIONS
- 9.7 Syngenta
- 9.8 UPL
- 9.9 Uralchem
- 9.10 YARA
 起始肥料市场:依营养类型、产品形态、作物类型、应用和分销管道划分-2026-2032年全球市场预测
 起始肥料市场规模、份额、成长及全球产业分析:按类型和应用划分,区域洞察及2026-2034年预测
 2026年全球启动肥料市场报告
 按养分类型、形态、施用方法、作物类型、品种和地区分類的启动肥市场规模、份额和增长分析 - 2026-2033 年行业预测
 全球起始肥市场预测至2032年:依类型、配方、作物类型、通路、施用方法及地区划分
 发酵肥市场 - 全球产业规模、份额、趋势、机会和预测,按养分、形式、作物类型、施用方法、类型、地区和竞争细分,2019-2029F