


 |
市场调查报告书
商品编码
1740867
再生能源证书 (REC) 市场机会、成长动力、产业趋势分析及 2025 - 2034 年预测Renewable Energy Certificate (REC) Market Opportunity, Growth Drivers, Industry Trend Analysis, and Forecast 2025 - 2034 |
||||||
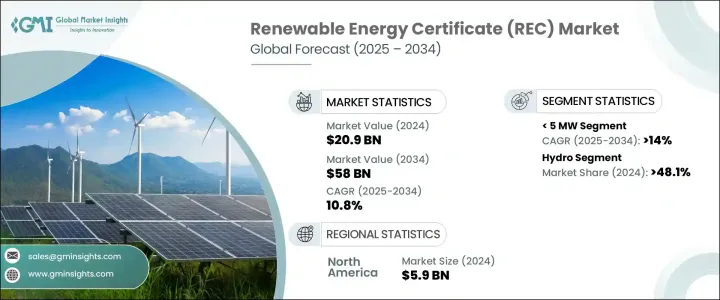
2024年,全球再生能源证书市场规模达209亿美元,预计到2034年将以10.8%的复合年增长率成长,达到580亿美元。这得益于全球对永续能源的需求不断增长,以及企业和消费者环境责任意识的不断增强。这一显着的成长轨迹得益于技术创新、扶持性政策以及全球能源策略向清洁能源转型等因素的共同推动。
先进技术的整合显着改善了市场运作,尤其是在提高透明度和减少诈欺活动的可能性方面。区块链在实现安全、可追溯的再生能源证书交易方面发挥关键作用,这对于维护证书的真实性和可信度至关重要。此外,国际认证协定等标准化架构有助于简化不同地理市场之间再生能源证书的签发和交易,使跨境贸易更加顺畅、有效率。
| 市场范围 | |
|---|---|
| 起始年份 | 2024 |
| 预测年份 | 2025-2034 |
| 起始值 | 209亿美元 |
| 预测值 | 580亿美元 |
| 复合年增长率 | 10.8% |
再生能源证书 (REC) 在许多国家持续受到欢迎,越来越多的企业和个人将其视为更广泛的永续发展目标的一部分。这些证书是利用风能、太阳能、水力发电或生质能等再生能源生产一定量电力的官方证明。对于致力于实现碳中和目标的公司而言,REC 提供了一种实用且可验证的途径,无需直接生产再生能源即可支援再生能源。
就容量细分而言,市场分为5兆瓦以下、5兆瓦以上至15兆瓦、15兆瓦以上至30兆瓦以及30兆瓦以上。其中,5兆瓦市场预计将实现最快成长,预计到2034年的复合年增长率将超过14%。这一成长主要归因于小型太阳能发电场的不断增加,随着全球技术成本下降和安装效率提高,小型太阳能发电场正变得越来越普遍。
从能源来源角度来看,市场可分为生物能源、太阳能、风能、水力、废弃物及其他能源类别。 2024年,水力发电占据市场主导地位,占再生能源证书(REC)交易总额的48.1%以上。其领先地位得益于政府的积极支持,这些支持透过激励措施和政策框架鼓励水力发电发展。水力发电的高效性和可靠性使其成为那些希望在不牺牲能源供应稳定性的情况下扩大再生能源产能的国家的理想选择。
北美继续在全球再生能源证书 (REC) 产业中扮演重要角色,其市场规模预计在 2022 年达到 50 亿美元,2023 年达到 54 亿美元,2024 年达到 59 亿美元。该地区致力于向清洁能源转型并实现雄心勃勃的碳减排目标,这使得再生能源证书 (REC) 成为其永续发展基础设施不可或缺的一部分。合规要求、企业自愿承诺以及先进的能源采购实践正在推动北美对再生能源证书 (REC) 的需求不断增长。
再生能源证书 (REC) 是企业和公用事业公司遵守环境法规和内部永续发展目标的关键机制。透过取得 REC,企业可以展示其对再生能源发电的支持,并在不改变其实际能源消耗结构的情况下为减少温室气体排放做出贡献。这种灵活性使得 REC 对于寻求提升环境、社会和治理 (ESG) 形象的企业尤其具有吸引力。
市场领导地位集中在少数几家公司手中,这些公司合计占超过30%的市场。这些公司包括一些在数位平台、国际合作伙伴关係和综合能源交易网络方面投入大量资金的主要参与者。策略合作关係、长期合约和持续的技术进步巩固了他们的主导地位。其中许多公司还推出了创新工具和资料平台,旨在提高市场透明度并支援客户的REC投资组合管理。
目录
第一章:方法论与范围
第二章:执行摘要
第三章:行业洞察
- 产业生态系统分析
- 川普政府关税分析
- 对贸易的影响
- 贸易量中断
- 报復措施
- 对产业的影响
- 供给侧影响(原料)
- 主要材料价格波动
- 供应链重组
- 生产成本影响
- 需求面影响(售价)
- 价格传导至终端市场
- 市占率动态
- 消费者反应模式
- 供给侧影响(原料)
- 受影响的主要公司
- 策略产业反应
- 供应链重组
- 定价和产品策略
- 政策参与
- 展望与未来考虑
- 对贸易的影响
- 监管格局
- 产业衝击力
- 成长动力
- 产业陷阱与挑战
- 成长潜力分析
- 波特的分析
- PESTEL分析
第四章:竞争格局
- 介绍
- 战略仪表板
- 策略倡议
- 公司市占率
- 竞争基准测试
- 创新与永续发展格局
第五章:市场规模及预测:依产能,2021 - 2034 年
- 主要趋势
- < 5 兆瓦
- > 5 兆瓦 - 15 兆瓦
- > 15 兆瓦 - 30 兆瓦
- > 30 兆瓦
第六章:市场规模及预测:依类型,2021 - 2034
- 主要趋势
- 自愿
- 遵守
第七章:市场规模及预测:依来源,2021 - 2034
- 主要趋势
- 生物能源
- 水力发电
- 太阳的
- 风
- 浪费
- 其他的
第八章:市场规模及预测:按地区,2021 - 2034
- 主要趋势
- 北美洲
- 欧洲
- 亚太地区
- 世界其他地区
第九章:公司简介
- 3Degrees
- Ecohz
- Shell
- Statkraft
- Xpansiv
- ENGIE
- Enel Green Power
- STX Group
- TerraPass
- BEF
- Targray
- Ameresco
- Sterling Planet
- Constellation
The Global Renewable Energy Certificate Market was valued at USD 20.9 billion in 2024 and is estimated to grow at a CAGR of 10.8% to reach USD 58 billion by 2034, driven by growing global demand for sustainable energy and increasing awareness of environmental responsibility among corporations and consumers. This significant growth trajectory is fueled by a combination of technological innovations, supportive policies, and a shift in global energy strategies toward cleaner sources.
The integration of advanced technologies has notably improved market operations, particularly in enhancing transparency and reducing the chances of fraudulent activities. Blockchain is playing a key role by enabling secure, traceable REC transactions, which is critical for maintaining the authenticity and trustworthiness of certificates. Additionally, standardized frameworks such as international certification protocols have helped streamline the issuance and trading of RECs across different geographic markets, making cross-border trade smoother and more efficient.
| Market Scope | |
|---|---|
| Start Year | 2024 |
| Forecast Year | 2025-2034 |
| Start Value | $20.9 Billion |
| Forecast Value | $58 Billion |
| CAGR | 10.8% |
RECs continue to gain traction in numerous countries, with a growing number of businesses and individuals embracing them as part of broader sustainability goals. These certificates serve as official proof of the generation of a specific amount of electricity from renewable sources such as wind, solar, hydro, or biomass. For companies aiming to meet carbon neutrality goals, RECs provide a practical and verifiable path to support renewable energy without the need to generate it directly.
In terms of capacity segmentation, the market is categorized into installations of 5 MW, greater than 5 MW up to 15 MW, over 15 MW up to 30 MW, and those exceeding 30 MW. Among these, the 5 MW segment is expected to witness the fastest growth, with a projected CAGR of more than 14% through 2034. This growth is largely attributed to the increasing deployment of small-scale solar farms, which are becoming more common as technological costs decline and installation efficiency improves globally.
From a source perspective, the market is classified into categories such as bioenergy, solar, wind, hydro, waste, and others. Hydropower led the market in 2024, accounting for over 48.1% of total REC transactions. Its leading position is driven by favorable governmental support, which encourages hydro adoption through incentives and policy frameworks. Hydro energy's high efficiency and reliability make it an appealing option for nations looking to expand renewable capacity without sacrificing consistency in energy supply.
North America continues to be a significant player in the global REC industry, with the market valued at USD 5 billion in 2022, USD 5.4 billion in 2023, and USD 5.9 billion in 2024. The region's focus on transitioning toward clean energy and meeting ambitious carbon reduction targets has made RECs an integral part of its sustainability infrastructure. Increasing demand for RECs in North America is being shaped by compliance mandates, voluntary corporate commitments, and progressive energy procurement practices.
RECs serve as a critical mechanism for businesses and utilities to align with environmental mandates and internal sustainability goals. By acquiring RECs, organizations demonstrate their support for renewable power generation and contribute to reducing greenhouse gas emissions without altering their physical energy consumption setup. This flexibility has made RECs particularly attractive to enterprises seeking to enhance their environmental, social, and governance (ESG) profiles.
Market leadership is concentrated among a handful of firms that collectively hold over 30% of the market share. These include major players who have made substantial investments in digital platforms, international partnerships, and integrated energy trading networks. Their dominance is reinforced by strategic relationships, long-term contracts, and ongoing technological advancements. Many of these companies have also introduced innovative tools and data platforms aimed at increasing market transparency and supporting REC portfolio management for their clients.
Table of Contents
Chapter 1 Methodology & Scope
- 1.1 Market scope & definitions
- 1.2 Market estimates & forecast parameters
- 1.3 Forecast calculation
- 1.4 Data sources
- 1.4.1 Primary
- 1.4.2 Secondary
- 1.4.2.1 Paid
- 1.4.2.2 Public
Chapter 2 Executive Summary
- 2.1 Industry synopsis, 2021 - 2034
Chapter 3 Industry Insights
- 3.1 Industry ecosystem analysis
- 3.2 Trump administration tariffs analysis
- 3.2.1 Impact on trade
- 3.2.1.1 Trade volume disruptions
- 3.2.1.2 Retaliatory measures
- 3.2.2 Impact on the industry
- 3.2.2.1 Supply-side impact (raw materials)
- 3.2.2.1.1 Price volatility in key materials
- 3.2.2.1.2 Supply chain restructuring
- 3.2.2.1.3 Production cost implications
- 3.2.2.2 Demand-side impact (selling price)
- 3.2.2.2.1 Price transmission to end markets
- 3.2.2.2.2 Market share dynamics
- 3.2.2.2.3 Consumer response patterns
- 3.2.2.1 Supply-side impact (raw materials)
- 3.2.3 Key companies impacted
- 3.2.4 Strategic industry responses
- 3.2.4.1.1 Supply chain reconfiguration
- 3.2.4.1.2 Pricing and product strategies
- 3.2.4.1.3 Policy engagement
- 3.2.5 Outlook and future considerations
- 3.2.1 Impact on trade
- 3.3 Regulatory landscape
- 3.4 Industry impact forces
- 3.4.1 Growth drivers
- 3.4.2 Industry pitfalls & challenges
- 3.5 Growth potential analysis
- 3.6 Porter's analysis
- 3.6.1 Bargaining power of suppliers
- 3.6.2 Bargaining power of buyers
- 3.6.3 Threat of new entrants
- 3.6.4 Threat of substitutes
- 3.7 PESTEL analysis
Chapter 4 Competitive Landscape, 2024
- 4.1 Introduction
- 4.2 Strategic dashboard
- 4.3 Strategic initiative
- 4.4 Company market share
- 4.5 Competitive benchmarking
- 4.6 Innovation & sustainability landscape
Chapter 5 Market Size and Forecast, By Capacity, 2021 - 2034 (USD Billion)
- 5.1 Key trends
- 5.2 < 5 MW
- 5.3 > 5 MW - 15 MW
- 5.4 > 15 MW - 30 MW
- 5.5 > 30 MW
Chapter 6 Market Size and Forecast, By Type, 2021 - 2034 (USD Billion)
- 6.1 Key trends
- 6.2 Voluntary
- 6.3 Compliance
Chapter 7 Market Size and Forecast, By Source, 2021 - 2034 (USD Billion)
- 7.1 Key trends
- 7.2 Bioenergy
- 7.3 Hydro
- 7.4 Solar
- 7.5 Wind
- 7.6 Waste
- 7.7 Others
Chapter 8 Market Size and Forecast, By Region, 2021 - 2034 (USD Billion)
- 8.1 Key trends
- 8.2 North America
- 8.3 Europe
- 8.4 Asia Pacific
- 8.5 Rest of world
Chapter 9 Company Profiles
- 9.1 3Degrees
- 9.2 Ecohz
- 9.3 Shell
- 9.4 Statkraft
- 9.5 Xpansiv
- 9.6 ENGIE
- 9.7 Enel Green Power
- 9.8 STX Group
- 9.9 TerraPass
- 9.10 BEF
- 9.11 Targray
- 9.12 Ameresco
- 9.13 Sterling Planet
- 9.14 Constellation
 2026-2030年全球能源属性证书(EAC)交易平台市场
 2026年全球可再生能源认证(REC)市场报告
 可再生能源证书市场预测至2032年:按类型、能源来源、发电工程容量、最终用户和地区分類的全球分析
 全球可再生能源证书市场
 全球可再生能源证书 (REC) 市场(按容量、能源类型、最终用途和地区划分)- 2030 年预测
 美国的再生能源证书市场评估:各类能源,各容量,各最终用途,各地区,机会,预测,2018年~2032年全球再生能源证书(REC)市场评估:依能源类型、容量、最终用途、地区、机会和预测(2018-2032年)REC(可再生能源证书)的全球市场、到 2033 年的机会和策略