


 |
市场调查报告书
商品编码
1740968
挥发性有机化合物(VOC)气体感测器市场机会、成长动力、产业趋势分析及2025-2034年预测Volatile Organic Compound (VOC) Gas Sensor Market Opportunity, Growth Drivers, Industry Trend Analysis, and Forecast 2025 - 2034 |
||||||
2024 年全球挥发性有机化合物气体感测器市场价值为 1.74 亿美元,预计到 2034 年将以 7.2% 的复合年增长率增长至 3.446 亿美元。预计到预测期末,市场容量将达到 1.425 亿台。这一增长主要得益于石油和天然气等行业需求的不断增长、全球空气品质标准的日益严格以及气体感测器日益融入物联网 (IoT) 网路和智慧设备。随着人们对空气污染的担忧日益加剧以及对准确即时监测的需求,VOC 气体感测器的应用正在工业安全、建筑自动化、环境监测和汽车系统等领域迅速扩展。这些感测器对于检测有害气体和采取主动安全措施至关重要,尤其是在高风险环境中。技术进步使气体感测器更加紧凑、经济高效、反应迅速,从而鼓励其在消费和工业应用中被采用。此外,更严格的环境法规和对室内空气品质的认识不断提高,进一步加速了已开发经济体和发展中经济体的市场渗透。
近年来,市场经历了显着的动盪,尤其是贸易政策变化影响了全球供应链。对进口电子产品征收的高额关税导致依赖国际采购感测器组件的企业的生产成本上升。这些措施迫使许多製造商重新评估其采购策略,寻求替代供应途径,或考虑扩大国内生产以减轻对进口的依赖。虽然这些转变带来了短期营运挑战,但也引发了向更在地化的製造模式的逐步转型。预计这种转变将在长期内创造更稳定的供应链,并降低地缘政治风险的影响。
| 市场范围 | |
|---|---|
| 起始年份 | 2024 |
| 预测年份 | 2025-2034 |
| 起始值 | 1.74亿美元 |
| 预测值 | 3.446亿美元 |
| 复合年增长率 | 7.2% |
从技术角度来看,市场分为光电离探测器 (PID)、金属氧化物半导体 (MOS)、电化学感测器、红外线探测和其他新兴技术。金属氧化物半导体领域在 2024 年引领市场,创造了 6,970 万美元的收入。这种增长得益于 MOS 感测器能够提供快速的响应时间,并且与其他技术相比价格更实惠。这些感测器透过检测金属氧化膜中的电阻变化来运作,使其成为持续空气品质监测的理想选择。它们适用于智慧家庭、工业环境和汽车安全应用,使其成为商业和消费者用例的热门选择。 MOS 感测器也因其能够有效检测各种挥发性有机化合物 (VOC)(例如甲醛、苯和甲苯)而被广泛采用,这些挥发性有机化合物在室内和室外空气中都很常见。
根据感测器类型,市场分为单气体侦测感测器和多气体侦测感测器。 2024年,多气体侦测感测器占据了全球63.7%的市场。这些感测器因其能够检测挥发性有机化合物(VOC)以外的多种气体而备受青睐,包括二氧化碳 (CO2)、一氧化碳 (CO)、二氧化氮 (NO2) 和甲烷。它们的多功能性对于工业安全、全面的环境监测和智慧基础设施系统至关重要。随着各行各业持续重视多层侦测能力,对这些多功能感测器的需求持续成长,尤其是在各种危险气体普遍存在的环境中。
依终端产业划分,市场细分为石油天然气、农业、汽车、化学、製造业、食品饮料、金属和采矿业等。 2024年,石油天然气产业占据市场主导地位,价值达3,930万美元。该产业对VOC气体感测器的需求旺盛,主要源自于对气体检测、排放监测和工作场所安全的迫切需求。此外,数位技术和基于物联网的监测系统的日益普及,也促使这些感测器在预测性维护和法规遵循方面的应用得到更广泛的应用。随着石油天然气营运向自动化和环保方向发展,VOC感测器的角色也变得越来越重要。
2024年,美国VOC气体感测器市场规模达4,000万美元。美国环保署(EPA)和职业安全与健康管理局(OSHA)等监管机构持续执行严格的工业和商业空间空气品质监测准则,这推动了国内需求的成长。此外,人们对现代建筑、医疗机构和车辆室内空气品质的认识不断提高,也推动了VOC感测器在暖通空调系统和其他室内环境中的整合。电动车和连网基础设施的兴起进一步推动了这一趋势,空气净化和车内空气监测正日益成为标准配备。
全球VOC气体感测器市场仍然高度分散,众多参与者在不同的细分领域提供多样化的解决方案。包括多家跨国公司在内的主要产业参与者共占约28.5%的市场。这些公司不断推出新产品和改进产品,专注于提高检测灵敏度、实现微型化以及与数位平台的无缝集成,所有这些都促进了市场的活跃度和竞争性。
目录
第一章:方法论与范围
第二章:执行摘要
第三章:行业洞察
- 产业生态系统分析
- 影响价值链的因素
- 利润率分析
- 中断
- 未来展望
- 製造商
- 经销商
- 川普政府关税
- 对贸易的影响
- 贸易量中断
- 报復措施
- 对产业的影响
- 供给侧影响(原料)
- 主要材料价格波动
- 供应链重组
- 生产成本影响
- 需求面影响(售价)
- 价格传导至终端市场
- 市占率动态
- 消费者反应模式
- 供给侧影响(原料)
- 受影响的主要公司
- 策略产业反应
- 供应链重组
- 定价和产品策略
- 政策参与
- 展望与未来考虑
- 对贸易的影响
- 供应商格局
- 利润率分析
- 重要新闻和倡议
- 监管格局
- 衝击力
- 成长动力
- 石油和天然气产业需求激增
- 政府和私人对智慧城市的投资不断增加
- 实施严格的空气品质法规
- 加强与物联网和智慧设备的集成
- 人们对空气中挥发性有机化合物 (VOC) 相关健康风险的认识不断提高
- 产业陷阱与挑战
- 现有基础设施的整合挑战
- 先进的VOC感测器成本高
- 成长动力
- 成长潜力分析
- 波特的分析
- PESTEL分析
第四章:竞争格局
- 介绍
- 公司市占率分析
- 竞争定位矩阵
- 战略展望矩阵
第五章:市场估计与预测:依技术,2021-2034 年
- 主要趋势
- 光电离检测器 (PID)
- 金属氧化物半导体(MOS)
- 电化学感测器
- 红外线检测
- 其他的
第六章:市场估计与预测:按类型,2021-2034
- 主要趋势
- 单一气体检测感测器
- 多种气体侦测感测器
第七章:市场估计与预测:按最终用途产业,2021-2034 年
- 主要趋势
- 石油和天然气
- 农业
- 汽车
- 化工
- 製造业
- 食品和饮料
- 金属与矿业
- 其他的
第八章:市场估计与预测:按地区,2021-2034
- 主要趋势
- 北美洲
- 我们
- 加拿大
- 欧洲
- 英国
- 德国
- 法国
- 义大利
- 西班牙
- 俄罗斯
- 亚太地区
- 中国
- 印度
- 日本
- 韩国
- 澳洲
- 拉丁美洲
- 巴西
- 墨西哥
- MEA
- 南非
- 沙乌地阿拉伯
- 阿联酋
第九章:公司简介
- ABB Ltd.
- Acal BFi Holdings Limited.
- Aeroqual Limited
- Alphasense Ltd.
- Amphenol Corporation
- ams AG
- Bosch Sensortec GmbH
- Danfoss
- EcoSensors
- Figaro Engineering Inc.
- GfG Europe Ltd.
- Honeywell International Inc.
- Ion Science Ltd.
- MEMBRAPOR AG
- MicroJet Technology Co., Ltd.
- Renesas Electronics Corporation
- Sensirion AG
- SGX Sensortech Ltd
- Siemens AG
- Winsen
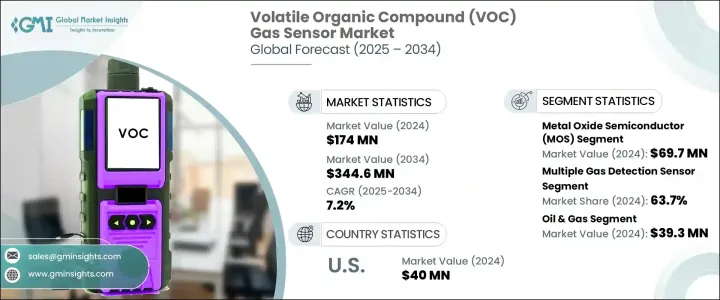
The Global Volatile Organic Compound Gas Sensor Market was valued at USD 174 million in 2024 and is estimated to grow at a CAGR of 7.2% to reach USD 344.6 million by 2034. The market volume is anticipated to hit 142.5 million units by the end of the forecast period. This growth is primarily driven by the increasing demand from industries such as oil and gas, the tightening of air quality standards worldwide, and the growing integration of gas sensors into Internet of Things (IoT) networks and smart devices. With rising concerns over air pollution and the need for accurate real-time monitoring, the application of VOC gas sensors is expanding rapidly across sectors including industrial safety, building automation, environmental monitoring, and automotive systems. These sensors are vital for detecting harmful gases and enabling proactive safety measures, particularly in high-risk environments. Technological advancements have made gas sensors more compact, cost-effective, and responsive, encouraging their adoption in both consumer and industrial applications. Furthermore, stricter environmental regulations and heightened awareness about indoor air quality are further accelerating market penetration across developed and developing economies.
The market has experienced notable disruptions in recent years, particularly due to trade policy changes that affected global supply chains. High tariffs imposed on imported electronic goods led to increased production costs for companies reliant on international sourcing for sensor components. These measures forced many manufacturers to reassess their procurement strategies and seek alternative supply routes or consider domestic production expansion to mitigate import dependency. Although these shifts posed short-term operational challenges, they also triggered a gradual transformation toward more localized manufacturing practices. This transition is expected to create more stable supply chains in the long term and reduce vulnerability to geopolitical risks.
| Market Scope | |
|---|---|
| Start Year | 2024 |
| Forecast Year | 2025-2034 |
| Start Value | $174 Million |
| Forecast Value | $344.6 Million |
| CAGR | 7.2% |
In terms of technology, the market is categorized into photoionization detectors (PID), metal oxide semiconductors (MOS), electrochemical sensors, infrared-based detection, and other emerging technologies. The metal oxide semiconductor segment led the market in 2024, generating USD 69.7 million in revenue. This growth is driven by MOS sensors' ability to deliver rapid response times and their affordability compared to other technologies. These sensors operate by detecting resistance changes in a metal oxide film, making them ideal for continuous air quality monitoring. Their suitability for smart homes, industrial environments, and automotive safety applications positions them as a popular choice across both commercial and consumer use cases. MOS sensors are also widely adopted for their efficiency in detecting various VOCs such as formaldehyde, benzene, and toluene, which are commonly found in both indoor and outdoor air.
Based on sensor type, the market is split into single gas detection sensors and multiple gas detection sensors. In 2024, multiple gas detection sensors accounted for 63.7% of the global market share. These sensors are favored for their ability to detect a variety of gases beyond VOCs, including carbon dioxide (CO2), carbon monoxide (CO), nitrogen dioxide (NO2), and methane. Their versatility is essential for industrial safety, comprehensive environmental monitoring, and smart infrastructure systems. As industries continue to prioritize multi-layered detection capabilities, the demand for these multifunctional sensors continues to grow, especially in environments where the presence of different hazardous gases is common.
By end-use industry, the market is segmented into oil and gas, agriculture, automotive, chemical, manufacturing, food and beverages, metals and mining, and others. The oil and gas sector dominated the market in 2024 with a value of USD 39.3 million. The high demand for VOC gas sensors in this industry is largely due to the critical need for gas detection, emissions monitoring, and workplace safety. Additionally, the increasing implementation of digital technologies and IoT-based monitoring systems has led to the broader deployment of these sensors for predictive maintenance and regulatory compliance. As oil and gas operations evolve to become more automated and environmentally responsible, the role of VOC sensors is becoming even more integral.
In 2024, the VOC gas sensor market in the United States reached USD 40 million. Regulatory bodies such as the Environmental Protection Agency (EPA) and the Occupational Safety and Health Administration (OSHA) continue to enforce stringent guidelines for air quality monitoring in industrial and commercial spaces, which is boosting domestic demand. Furthermore, rising awareness around indoor air quality in modern buildings, healthcare facilities, and vehicles is encouraging the integration of VOC sensors in HVAC systems and other indoor environments. This trend is further supported by the rise in electric vehicles and connected infrastructure, where air purification and in-cabin air monitoring are increasingly becoming standard.
The global VOC gas sensor market remains highly fragmented, with numerous players offering diverse solutions across different segments. Major industry participants, including several multinational corporations, collectively hold around 28.5% of the market share. These companies are continuously introducing new and improved products, focusing on enhanced detection sensitivity, miniaturization, and seamless integration with digital platforms, all of which are contributing to the dynamic and competitive nature of the market.
Table of Contents
Chapter 1 Methodology & Scope
- 1.1 Market scope & definitions
- 1.2 Base estimates & calculations
- 1.3 Forecast calculations
- 1.4 Data sources
- 1.4.1 Primary
- 1.4.2 Secondary
- 1.4.2.1 Paid sources
- 1.4.2.2 Public sources
Chapter 2 Executive Summary
- 2.1 Industry synopsis, 2021-2034
Chapter 3 Industry Insights
- 3.1 Industry ecosystem analysis
- 3.1.1 Factor affecting the value chain
- 3.1.2 Profit margin analysis
- 3.1.3 Disruptions
- 3.1.4 Future outlook
- 3.1.5 Manufacturers
- 3.1.6 Distributors
- 3.2 Trump administration tariffs
- 3.2.1 Impact on trade
- 3.2.1.1 Trade volume disruptions
- 3.2.1.2 Retaliatory measures
- 3.2.1.3 Impact on the industry
- 3.2.1.3.1 Supply-side impact (raw materials)
- 3.2.1.3.1.1 Price volatility in key materials
- 3.2.1.3.1.2 Supply chain restructuring
- 3.2.1.3.1.3 Production cost implications
- 3.2.1.3.2 Demand-side impact (selling price)
- 3.2.1.3.2.1 Price transmission to end markets
- 3.2.1.3.2.2 Market share dynamics
- 3.2.1.3.2.3 Consumer response patterns
- 3.2.1.3.1 Supply-side impact (raw materials)
- 3.2.1.4 Key companies impacted
- 3.2.1.5 Strategic industry responses
- 3.2.1.5.1 Supply chain reconfiguration
- 3.2.1.5.2 Pricing and product strategies
- 3.2.1.5.3 Policy engagement
- 3.2.1.6 Outlook and future considerations
- 3.2.1 Impact on trade
- 3.3 Supplier landscape
- 3.4 Profit margin analysis
- 3.5 Key news & initiatives
- 3.6 Regulatory landscape
- 3.7 Impact forces
- 3.7.1 Growth drivers
- 3.7.1.1 Surge in demand across oil & gas sector
- 3.7.1.2 Rising government & private investments in smart cities
- 3.7.1.3 Imposition of stringent air quality regulations
- 3.7.1.4 Increasing integration with IoT & smart devices
- 3.7.1.5 Growing awareness about airborne VOC-related health risks
- 3.7.2 Industry pitfalls & challenges
- 3.7.2.1 Integration challenges in existing infrastructure
- 3.7.2.2 High cost of advanced VOC sensors
- 3.7.1 Growth drivers
- 3.8 Growth potential analysis
- 3.9 Porter's analysis
- 3.10 PESTEL analysis
Chapter 4 Competitive Landscape, 2024
- 4.1 Introduction
- 4.2 Company market share analysis
- 4.3 Competitive positioning matrix
- 4.4 Strategic outlook matrix
Chapter 5 Market Estimates & Forecast, By Technology, 2021-2034 (USD Million & Units)
- 5.1 Key trends
- 5.2 Photoionization Detectors (PID)
- 5.3 Metal Oxide Semiconductor (MOS)
- 5.4 Electrochemical sensors
- 5.5 Infrared-based detection
- 5.6 Others
Chapter 6 Market Estimates & Forecast, By Type, 2021-2034 (USD Million & Units)
- 6.1 Key trends
- 6.2 Single gas detection sensor
- 6.3 Multiple gas detection sensor
Chapter 7 Market Estimates & Forecast, By End Use Industry, 2021-2034 (USD Million & Units)
- 7.1 Key trends
- 7.2 Oil & gas
- 7.3 Agriculture
- 7.4 Automotive
- 7.5 Chemical industry
- 7.6 Manufacturing
- 7.7 Food & beverages
- 7.8 Metals & mining
- 7.9 Others
Chapter 8 Market Estimates & Forecast, By Region, 2021-2034 (USD Million & Units)
- 8.1 Key trends
- 8.2 North America
- 8.2.1 U.S.
- 8.2.2 Canada
- 8.3 Europe
- 8.3.1 UK
- 8.3.2 Germany
- 8.3.3 France
- 8.3.4 Italy
- 8.3.5 Spain
- 8.3.6 Russia
- 8.4 Asia Pacific
- 8.4.1 China
- 8.4.2 India
- 8.4.3 Japan
- 8.4.4 South Korea
- 8.4.5 Australia
- 8.5 Latin America
- 8.5.1 Brazil
- 8.5.2 Mexico
- 8.6 MEA
- 8.6.1 South Africa
- 8.6.2 Saudi Arabia
- 8.6.3 UAE
Chapter 9 Company Profiles
- 9.1 ABB Ltd.
- 9.2 Acal BFi Holdings Limited.
- 9.3 Aeroqual Limited
- 9.4 Alphasense Ltd.
- 9.5 Amphenol Corporation
- 9.6 ams AG
- 9.7 Bosch Sensortec GmbH
- 9.8 Danfoss
- 9.9 EcoSensors
- 9.10 Figaro Engineering Inc.
- 9.11 GfG Europe Ltd.
- 9.12 Honeywell International Inc.
- 9.13 Ion Science Ltd.
- 9.14 MEMBRAPOR AG
- 9.15 MicroJet Technology Co., Ltd.
- 9.16 Renesas Electronics Corporation
- 9.17 Sensirion AG
- 9.18 SGX Sensortech Ltd
- 9.19 Siemens AG
- 9.20 Winsen


