


 |
市场调查报告书
商品编码
1740987
智慧家用饮料机市场机会、成长动力、产业趋势分析及 2025 - 2034 年预测Smart Home-Based Beverage Machine Market Opportunity, Growth Drivers, Industry Trend Analysis, and Forecast 2025 - 2034 |
||||||
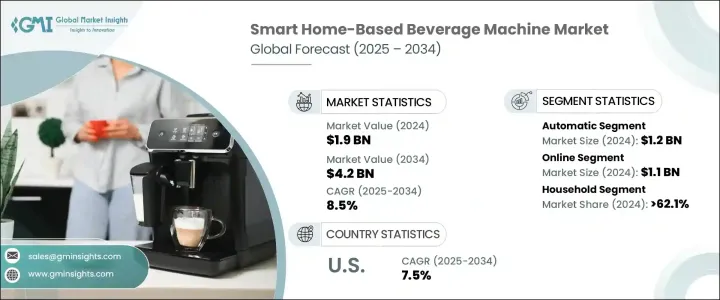
2024年,全球智慧家用饮料机市场规模达19亿美元,预计到2034年将以8.5%的复合年增长率成长,达到42亿美元。推动这一成长的主要因素是人们对日常生活便利性日益增长的需求。消费者越来越倾向于简化日常任务的解决方案,而智慧饮料机正满足这项需求。这些设备提供轻鬆便捷的饮料製作体验,只需极少的用户输入。其直觉的操作确保即使技术知识有限的使用者也能轻鬆上手。使用者不再需要依赖手动准备步骤,只需几个简单的命令即可享受流畅的饮料製作体验。
物联网 (IoT) 技术的日益融合,在智慧饮料机领域的变革中发挥着至关重要的作用。物联网功能使这些设备能够与智慧型手机和其他智慧型装置连接,让使用者能够在家中的任何地方远端冲泡饮料。定制功能也日益普及。使用者可依照自己的喜好调整冲泡浓度、温度设定和食材比例,打造专属饮品,提供传统机器先前无法实现的个人化体验。随着生活方式日益数位化,此类功能正成为现代家庭的必备之选。
| 市场范围 | |
|---|---|
| 起始年份 | 2024 |
| 预测年份 | 2025-2034 |
| 起始值 | 19亿美元 |
| 预测值 | 42亿美元 |
| 复合年增长率 | 8.5% |
就功能性而言,自动化细分市场处于领先地位。截至2024年,该细分市场的收入为12亿美元,预计到2034年将以约9%的复合年增长率成长。自动化智慧饮料机的设计旨在最大限度地提高便利性,几乎无需手动操作。使用者只需输入配料偏好,机器就会处理其他所有事情。这些设备通常配备可编程功能,例如触控萤幕、Wi-Fi连接和语音控制,完美契合当今快节奏消费者的需求。它们能够提供一致的饮品效果,同时减少手动操作的需求,这是其日益普及的主要原因。
在分销方面,线上销售占主导地位。 2024年,线上销售规模约11亿美元,预计到2034年将以近9%的复合年增长率成长。这项成长主要得益于电商平台的日益普及,消费者足不出户即可轻鬆购物。买家被吸引到能够在购买前比较产品、阅读经过验证的评论、获取详细的产品资讯以及观看演示影片等功能。更优惠的价格、更广泛的产品供应以及快速的配送选择等额外优势,使得线上通路对精通科技的购物者尤其具有吸引力。随着数位购物的不断发展,这种转变预计将持续升温。
从使用情况来看,家庭是智慧家庭饮料机的主要消费者。 2024年,家庭市场占据了62.1%的市场份额,预计到2034年将以9%的复合年增长率成长。随着可透过Wi-Fi或蓝牙控制的智慧家电的普及和认知度的提升,推动了该领域的成长。这些机器允许用户使用智慧型手机或语音助理轻鬆製作各种饮品,从咖啡、茶到冰沙。凭藉节能冲泡、可自订的饮品设置以及与其他智慧家庭设备的无缝整合等功能,这些机器满足了追求厨房创新和效率的房主的需求。
北美市场蓬勃发展,尤其是在美国。美国以2024年4.8亿美元的估值引领该地区市场,预计到2034年,复合年增长率将达到7.5%。该地区率先采用智慧技术,加之对便利性的强烈追求,正鼓励消费者拥抱这些设备。许多消费者正在投资具有远端控制、语音整合和其他智慧功能的饮料机。消费者对高端科技型厨房电器的兴趣正在推动需求,并为持续成长奠定基础。
智慧家庭饮料机产业的主要参与者包括 Behmor、Breville、Bevi、BSH、Coway、De'Longhi、Cafe Appliances、Hamilton Beach、Illy、Jura、Hurom、Kuvings、Nespresso、Lavazza 和 Smart Soda。许多公司正在对创新进行策略性投资,专注于整合永续材料和节能技术,以应对日益增长的环境问题。这种关注不仅增强了他们的竞争优势,也符合现代消费者不断变化的期望。
目录
第一章:方法论与范围
第二章:执行摘要
第三章:行业洞察
- 产业生态系统分析
- 川普政府关税分析
- 对贸易的影响
- 贸易量中断
- 报復措施
- 对产业的影响
- 供给侧影响(原料)
- 主要材料价格波动
- 供应链重组
- 生产成本影响
- 需求面影响(售价)
- 价格传导至终端市场
- 市占率动态
- 消费者反应模式
- 受影响的主要公司
- 策略产业反应
- 供应链重组
- 定价和产品策略
- 政策参与
- 展望与未来考虑
- 对贸易的影响
- 供应商格局
- 定价分析
- 技术与创新格局
- 重要新闻和倡议
- 监管格局
- 製造商
- 经销商
- 零售商
- 衝击力
- 成长动力
- 消费者越来越注重便利性和效率
- 智慧家庭科技的扩展
- 专用电器日益普及
- 创新产品
- 产业陷阱与挑战
- 消费者偏好的改变
- 市场饱和度高
- 成长动力
- 技术与创新格局
- 消费者购买行为分析
- 成长潜力分析
- 监管格局
- 定价分析
- 波特的分析
- PESTEL分析
第四章:竞争格局
- 介绍
- 公司市占率分析
- 竞争定位矩阵
- 战略展望矩阵
第五章:市场估计与预测:依产品类型,2021 - 2034 年
- 主要趋势
- 咖啡机
- 榨汁机
- 净水器/饮水机
- 苏打水和碳酸饮料机
- 其他(茶机、鸡尾酒机)
第六章:市场估计与预测:依连结性,2021 - 2034 年
- 主要趋势
- 支援 Wi-Fi
- 支援蓝牙
- 语音启用
- 应用程式控制
第七章:市场估计与预测:依营运模式,2021 - 2034 年
- 主要趋势
- 自动的
- 半自动
第八章:市场估计与预测:依价格区间,2021 年至 2034 年
- 主要趋势
- 低的
- 中等的
- 高的
第九章:市场估计与预测:依最终用途,2021 - 2034 年
- 主要趋势
- 家庭
- 商业的
- 小型办公室
- 饭店
- 其他的
第 10 章:市场估计与预测:按配销通路,2021 年至 2034 年
- 主要趋势
- 在线的
- 电子商务网站
- 公司拥有的网站
- 离线
- 超市和大卖场
- 便利商店
- 专卖店
- 其他的
第 11 章:市场估计与预测:按地区,2021 年至 2034 年
- 主要趋势
- 北美洲
- 我们
- 加拿大
- 欧洲
- 德国
- 英国
- 法国
- 义大利
- 西班牙
- 亚太地区
- 中国
- 印度
- 日本
- 韩国
- 拉丁美洲
- 巴西
- 墨西哥
- MEA
- 沙乌地阿拉伯
- 阿联酋
- 南非
第十二章:公司简介
- Behmor
- Bevi
- Breville
- BSH
- Cafe Appliances
- Coway
- De'Longhi
- Hamilton Beach
- Hurom
- Illy
- Jura
- Kuvings
- Lavazza
- Nespresso
- Smart Soda
The Global Smart Home-Based Beverage Machine Market was valued at USD 1.9 billion in 2024 and is estimated to grow at a CAGR of 8.5% to reach USD 4.2 billion by 2034. A major factor fueling this expansion is the increasing demand for convenience in everyday life. Consumers are gravitating toward solutions that simplify routine tasks, and smart beverage machines are meeting that need. These appliances offer a hassle-free beverage-making experience, requiring minimal user input. Their intuitive operation ensures ease of use, even for those with limited technical knowledge. Users no longer need to rely on manual preparation steps; instead, they enjoy seamless drink-making experiences with just a few simple commands.
The growing integration of Internet of Things (IoT) technology is playing a critical role in transforming the smart beverage machine space. IoT features are allowing these appliances to connect with smartphones and other smart devices, giving users the ability to start brewing remotely from anywhere in the house. Customization features have also become increasingly common. Users can tailor their beverages by adjusting brew strength, temperature settings, and ingredient ratios to their preferences, offering a personalized experience that wasn't previously possible with traditional machines. As lifestyles become more digitally integrated, such features are becoming must-haves in modern homes.
| Market Scope | |
|---|---|
| Start Year | 2024 |
| Forecast Year | 2025-2034 |
| Start Value | $1.9 Billion |
| Forecast Value | $4.2 Billion |
| CAGR | 8.5% |
In terms of functionality, the automatic segment leads the way. As of 2024, it accounted for USD 1.2 billion in revenue and is forecasted to expand at a CAGR of approximately 9% through 2034. Automatic smart beverage machines are designed for maximum convenience, operating with little to no manual effort. Users input their ingredient preferences, and the machine takes care of everything else. These devices typically come equipped with programmable features such as touchscreens, Wi-Fi connectivity, and voice-enabled controls, aligning perfectly with the needs of today's fast-paced consumers. Their ability to deliver consistent results while reducing the need for hands-on operation is a major contributor to their growing popularity.
On the distribution front, online sales are dominating. The online segment generated around USD 1.1 billion in 2024 and is expected to grow at a CAGR of nearly 9% until 2034. This rise is being driven by the increasing prevalence of eCommerce platforms, where consumers can shop with ease from the comfort of their homes. Buyers are drawn to the ability to compare products, read verified reviews, access detailed product information, and watch demonstration videos before making a purchase. The added benefits of better pricing, wider product availability, and quick delivery options make online channels particularly attractive to tech-savvy shoppers. This shift is expected to keep gaining momentum as digital shopping continues to evolve.
Based on usage, households are the primary consumers of smart home-based beverage machines. In 2024, the household segment held a significant 62.1% market share and is anticipated to grow at a CAGR of 9% through 2034. Increasing awareness and adoption of smart appliances that can be controlled through Wi-Fi or Bluetooth is driving growth in this segment. These machines allow users to prepare a variety of beverages-from coffee and tea to smoothies-with minimal effort using a smartphone or voice assistant. With features like energy-efficient brewing, customizable drink settings, and seamless integration with other smart home devices, these machines cater to homeowners seeking both innovation and efficiency in their kitchens.
In North America, the market is thriving, particularly in the United States. The US led the regional market with an estimated value of USD 480 million in 2024, and it is set to grow at a CAGR of 7.5% through 2034. The region's early adoption of smart technologies, combined with a strong preference for convenience, is encouraging consumers to embrace these devices. Many are investing in beverage machines that offer remote control capabilities, voice integration, and other smart features. Consumer interest in premium, tech-enabled kitchen appliances is fueling demand and setting the stage for continued growth.
Key players operating in the smart home beverage machine industry include Behmor, Breville, Bevi, BSH, Coway, De'Longhi, Cafe Appliances, Hamilton Beach, Illy, Jura, Hurom, Kuvings, Nespresso, Lavazza, and Smart Soda. Many of these companies are making strategic investments in innovation, focusing on integrating sustainable materials and energy-saving technologies in response to growing environmental concerns. This focus not only strengthens their competitive edge but also aligns with the shifting expectations of modern consumers.
Table of Contents
Chapter 1 Methodology & Scope
- 1.1 Research design
- 1.1.1 Research approach
- 1.1.2 Data collection methods
- 1.2 Base estimates and calculations
- 1.2.1 Base year calculation
- 1.2.2 Key trends for market estimates
- 1.3 Forecast model
- 1.4 Primary research & validation
- 1.4.1 Primary sources
- 1.4.2 Data mining sources
- 1.5 Market definitions
Chapter 2 Executive Summary
- 2.1 Industry 3600 synopsis, 2021 - 2034
Chapter 3 Industry Insights
- 3.1 Industry ecosystem analysis
- 3.2 Trump administration tariffs analysis
- 3.2.1 Impact on trade
- 3.2.1.1 Trade volume disruptions
- 3.2.1.2 Retaliatory measures
- 3.2.2 Impact on the industry
- 3.2.2.1 Supply-side impact (Raw materials)
- 3.2.2.2 Price volatility in key materials
- 3.2.2.3 Supply chain restructuring
- 3.2.2.4 Production cost implications
- 3.2.2.5 Demand-side impact (Selling price)
- 3.2.2.6 Price transmission to end markets
- 3.2.2.7 Market share dynamics
- 3.2.2.8 Consumer response patterns
- 3.2.3 Key companies impacted
- 3.2.4 Strategic industry responses
- 3.2.4.1 Supply chain reconfiguration
- 3.2.4.2 Pricing and product strategies
- 3.2.4.3 Policy engagement
- 3.2.5 Outlook and future considerations
- 3.2.1 Impact on trade
- 3.3 Supplier landscape
- 3.4 Pricing analysis
- 3.5 Technology & innovation landscape
- 3.6 Key news & initiatives
- 3.7 Regulatory landscape
- 3.8 Manufacturers
- 3.9 Distributors
- 3.10 Retailers
- 3.11 Impact forces
- 3.11.1 Growth drivers
- 3.11.1.1 Rising consumer focus on convenience and efficiency
- 3.11.1.2 Expansion of smart home technology
- 3.11.1.3 Growing popularity of specialty appliances
- 3.11.1.4 Innovative product offerings
- 3.11.2 Industry pitfalls & challenges
- 3.11.2.1 Changing consumer preferences
- 3.11.2.2 High market saturation
- 3.11.1 Growth drivers
- 3.12 Technology & innovation landscape
- 3.13 Consumer buying behavior analysis
- 3.14 Growth potential analysis
- 3.15 Regulatory landscape
- 3.16 Pricing analysis
- 3.17 Porter's analysis
- 3.18 PESTEL analysis
Chapter 4 Competitive Landscape, 2024
- 4.1 Introduction
- 4.2 Company market share analysis
- 4.3 Competitive positioning matrix
- 4.4 Strategic outlook matrix
Chapter 5 Market Estimates & Forecast, By Product Type, 2021 - 2034, (USD Billion) (thousand units)
- 5.1 Key trends
- 5.2 Coffee machines
- 5.3 Juice machines
- 5.4 Water purifiers/dispensers
- 5.5 Soda and carbonated beverage machines
- 5.6 Others (tea machines, cocktail machines)
Chapter 6 Market Estimates & Forecast, By Connectivity, 2021 - 2034, (USD Billion) (thousand units)
- 6.1 Key trends
- 6.2 Wi-fi-enabled
- 6.3 Bluetooth-enabled
- 6.4 Voice-activated
- 6.5 App-controlled
Chapter 7 Market Estimates & Forecast, By Operational Mode, 2021 - 2034, (USD Billion) (Thousand Units)
- 7.1 Key trends
- 7.2 Automatic
- 7.3 Semi-automatic
Chapter 8 Market Estimates & Forecast, By Price Range, 2021 - 2034, (USD Billion) (Thousand Units)
- 8.1 Key trends
- 8.2 Low
- 8.3 Medium
- 8.4 High
Chapter 9 Market Estimates & Forecast, By End Use, 2021 - 2034, (USD Billion) (Thousand Units)
- 9.1 Key trends
- 9.2 Households
- 9.3 Commercial
- 9.3.1 Small offices
- 9.3.2 Hotels
- 9.3.3 Others
Chapter 10 Market Estimates & Forecast, By Distribution Channel, 2021 - 2034, (USD Billion) (Thousand Units)
- 10.1 Key trends
- 10.2 Online
- 10.2.1 E-commerce website
- 10.2.2 Company owned website
- 10.3 Offline
- 10.3.1 Supermarkets & hypermarkets
- 10.3.2 Convenience stores
- 10.3.3 Specialty stores
- 10.3.4 Others
Chapter 11 Market Estimates & Forecast, By Region, 2021 - 2034, (USD Billion) (Thousand Units)
- 11.1 Key trends
- 11.2 North America
- 11.2.1 U.S.
- 11.2.2 Canada
- 11.3 Europe
- 11.3.1 Germany
- 11.3.2 UK
- 11.3.3 France
- 11.3.4 Italy
- 11.3.5 Spain
- 11.4 Asia Pacific
- 11.4.1 China
- 11.4.2 India
- 11.4.3 Japan
- 11.4.4 South Korea
- 11.5 Latin America
- 11.5.1 Brazil
- 11.5.2 Mexico
- 11.6 MEA
- 11.6.1 Saudi Arabia
- 11.6.2 UAE
- 11.6.3 South Africa
Chapter 12 Company Profiles
- 12.1 Behmor
- 12.2 Bevi
- 12.3 Breville
- 12.4 BSH
- 12.5 Cafe Appliances
- 12.6 Coway
- 12.7 De’Longhi
- 12.8 Hamilton Beach
- 12.9 Hurom
- 12.10 Illy
- 12.11 Jura
- 12.12 Kuvings
- 12.13 Lavazza
- 12.14 Nespresso
- 12.15 Smart Soda
