


 |
市场调查报告书
商品编码
1750333
视网膜电图市场机会、成长动力、产业趋势分析及 2025 - 2034 年预测Electroretinogram Market Opportunity, Growth Drivers, Industry Trend Analysis, and Forecast 2025 - 2034 |
||||||
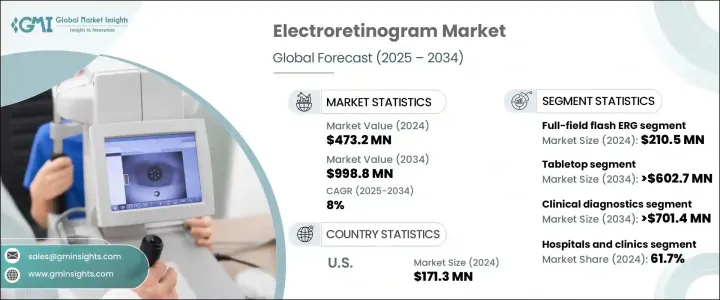
2024年,全球视网膜电图市场规模达4.732亿美元,预估年复合成长率为8%,2034年将达9.988亿美元。这主要得益于老年黄斑部病变、青光眼和糖尿病视网膜病变等视网膜疾病日益加重的负担,这些疾病也催生了对更精准、更早期诊断工具的需求。随着全球人口老化,这些疾病的发生率也在上升,这反过来又加速了视网膜电图系统在临床环境中的应用。公众健康意识的不断提高以及对预防性眼部保健的日益重视,推动了市场渗透。视网膜电图(ERG)测试使眼科医生能够检测视网膜功能障碍,从而有助于确保及时进行医疗干预并改善患者预后。
视网膜电图 (ERG) 系统的技术进步在重塑市场趋势和用户采用方面发挥了关键作用。向便携式电池供电设备的转变使得在偏远地区或农村地区进行眼科诊断成为可能,提高了可及性,并促进了先前缺乏此类资源的人群的早期发现。这些紧凑型系统适用于现场筛检、行动诊所和即时检测,进一步推动了全球医疗保健网路对其的需求。除了行动性之外,自动化和整合软体的持续改进也显着提高了 ERG 程式的效率。自动化方案、即时资料处理和直觉的介面正在简化临床医生的工作流程,减少人为错误,并提供更一致、更可靠的诊断结果。这项技术进步不仅提高了患者吞吐量,还提高了长期资料管理,这对于追踪病情进展和治疗效果至关重要。
| 市场范围 | |
|---|---|
| 起始年份 | 2024 |
| 预测年份 | 2025-2034 |
| 起始值 | 4.732亿美元 |
| 预测值 | 9.988亿美元 |
| 复合年增长率 | 8% |
预计到2034年,桌上型视网膜视网膜成像市场将创造6.027亿美元的市场价值。这一成长轨迹主要得益于该系统可自订的配置、卓越的解析度以及与诊断软体套件的整合。其对各种临床环境的适应性,以及进行详细且准确的视网膜评估的能力,确保其仍然是治疗复杂视网膜疾病的专家的首选。
全视野闪光视网膜电图 (Flash ERG) 市场在 2024 年的营收为 2.105 亿美元。这些系统仍然是评估光感受器活动和诊断各种视网膜疾病的首选方法。它们能够在一次诊断过程中评估视桿细胞和视锥细胞的功能,使其成为眼科评估不可或缺的工具。全视野闪光视网膜电图的效率、速度和准确性预计将在整个预测期内保持强劲的需求。
美国视网膜电图市场在2024年创收1.713亿美元,预计2034年将以7.4%的复合年增长率成长。强大的医疗基础设施、慢性视网膜疾病盛行率的上升以及优惠的医疗政策是推动该地区成长的主要因素。全球各地的医疗机构都在投资先进的诊断技术,医疗器材製造商和医疗服务提供者之间的合作也为持续创新和应用奠定了坚实的基础。
Diagnosys、LKC Technologies、Konan Medical USA、M&S Technologies、Metrovision、Diopsys 和 Roland Consult 等领先企业强调持续创新和产品差异化,以提升其市场地位。许多公司正在透过先进的便携式和自动化 ERG 系统扩展其产品线。 CSO 和 Vision 与研究机构和诊所合作,以改善临床验证。策略分销合作伙伴关係和向新兴市场的扩张也是公司优先考虑的事项,旨在扩大客户覆盖范围并提升全球市场份额。
目录
第一章:方法论与范围
第二章:执行摘要
第三章:行业洞察
- 产业生态系统分析
- 产业衝击力
- 成长动力
- 视网膜疾病盛行率上升
- ERG 设备的技术进步
- 老年人口不断增加
- 早期疾病检测需求不断成长
- 产业陷阱与挑战
- 缺乏熟练的专业人员
- 有限的报销政策
- 成长动力
- 成长潜力分析
- 监管格局
- 川普政府关税
- 对贸易的影响
- 贸易量中断
- 各国应对措施
- 对产业的影响
- 供应方影响(製造成本)
- 主要材料价格波动
- 供应链重组
- 生产成本影响
- 需求面影响(消费者成本)
- 价格传导至终端市场
- 市占率动态
- 消费者反应模式
- 供应方影响(製造成本)
- 受影响的主要公司
- 策略产业反应
- 供应链重组
- 定价和产品策略
- 政策参与
- 展望与未来考虑
- 对贸易的影响
- 定价分析
- 技术格局
- 差距分析
- 波特的分析
- PESTEL分析
第四章:竞争格局
- 介绍
- 公司市占率分析
- 公司矩阵分析
- 竞争定位矩阵
- 策略仪表板
第五章:市场估计与预测:按类型,2021 - 2034 年
- 主要趋势
- 全场闪光视网膜电图(ffERG)
- 模式视网膜电图 (PERG)
- 多焦点视网膜电图 (mfERG)
第六章:市场估计与预测:按产品,2021 - 2034 年
- 主要趋势
- 桌面
- 手持式
第七章:市场估计与预测:按应用,2021 - 2034 年
- 主要趋势
- 临床诊断
- 研究
第八章:市场估计与预测:依最终用途,2021 - 2034 年
- 主要趋势
- 医院和诊所
- 眼科中心
- 研究机构
第九章:市场估计与预测:按地区,2021 - 2034 年
- 主要趋势
- 北美洲
- 我们
- 加拿大
- 欧洲
- 德国
- 英国
- 法国
- 西班牙
- 义大利
- 荷兰
- 亚太地区
- 中国
- 日本
- 印度
- 澳洲
- 韩国
- 拉丁美洲
- 巴西
- 墨西哥
- 阿根廷
- 中东和非洲
- 南非
- 沙乌地阿拉伯
- 阿联酋
第十章:公司简介
- an-vision
- ChongQing SunKingdom Medical
- CSO
- Diagnosys
- Diopsys
- Electro-Diagnostic Imaging
- Konan Medical USA
- LKC Technologies
- M&S Technologies
- Metrovision
- Roland Consult Stasche & Finger
The Global Electroretinogram Market was valued at USD 473.2 million in 2024 and is estimated to grow at a CAGR of 8% to reach USD 998.8 million by 2034, driven by the increasing burden of retinal conditions, including age-related macular degeneration, glaucoma, and diabetic retinopathy, that fuel demand for more accurate and early diagnostic tools. As the global population ages, the incidence of these diseases is rising, which in turn is accelerating the adoption of electroretinogram systems across clinical settings. Rising public health awareness and the growing emphasis on preventive eye care boost market penetration. ERG testing allows ophthalmologists to detect retinal dysfunction, helping ensure timely medical intervention and better patient outcomes.
Technological advancements in electroretinogram (ERG) systems have played a pivotal role in reshaping market trends and user adoption. The shift toward portable, battery-operated devices has made it feasible to deliver ophthalmic diagnostics in hard-to-reach or rural areas, increasing accessibility and facilitating early detection in populations that previously lacked such resources. These compact systems are useful for on-site screenings, mobile clinics, and point-of-care testing, further fueling their demand across global healthcare networks. In addition to mobility, ongoing improvements in automation and integrated software are significantly enhancing the efficiency of ERG procedures. Automated protocols, real-time data processing, and intuitive interfaces are streamlining workflows for clinicians, reducing human error, and delivering more consistent and reliable diagnostic outcomes. This technological evolution is improving not only patient throughput but also long-term data management, which is crucial for tracking disease progression and treatment efficacy.
| Market Scope | |
|---|---|
| Start Year | 2024 |
| Forecast Year | 2025-2034 |
| Start Value | $473.2 Million |
| Forecast Value | $998.8 Million |
| CAGR | 8% |
The tabletop segment is expected to generate USD 602.7 million by 2034. This growth trajectory is primarily supported by the systems' customizable configurations, superior resolution, and integration with diagnostic software suites. Their adaptability to various clinical environments, along with the ability to produce detailed and accurate retinal assessments, ensures they remain the preferred choice for specialists managing complex retinal disorders.
The full-field flash ERG segment generated USD 210.5 million in 2024. These systems remain the preferred modality for evaluating photoreceptor activity and diagnosing a wide array of retinal disorders. Their ability to assess rod and cone cell function in a single diagnostic session makes them indispensable for ophthalmic evaluations. The efficiency, speed, and accuracy of full-field flash ERGs are expected to keep demand robust throughout the forecast timeline.
U.S. Electroretinogram Market generated USD 171.3 million in 2024 and is forecasted to grow at a CAGR of 7.4% through 2034. A strong healthcare infrastructure, increased prevalence of chronic retinal diseases, and favorable health policies are major factors propelling growth in the region. Healthcare facilities worldwide are investing in advanced diagnostic technologies, and partnerships between medical device manufacturers and care providers are fostering a strong foundation for continued innovation and adoption.
Leading players such as Diagnosys, LKC Technologies, Konan Medical USA, M&S Technologies, Metrovision, Diopsys, and Roland Consult emphasize continuous innovation and product differentiation to boost their presence. Many companies are expanding their product lines with advanced portable and automated ERG systems. CSO and Vision collaborate with research institutes and clinics to improve clinical validation. Strategic distribution partnerships and expansion into emerging markets are also prioritized to broaden customer reach and increase global market share.
Table of Contents
Chapter 1 Methodology and Scope
- 1.1 Market scope and definitions
- 1.2 Research design
- 1.2.1 Research approach
- 1.2.2 Data collection methods
- 1.3 Base estimates and calculations
- 1.3.1 Base year calculation
- 1.3.2 Key trends for market estimation
- 1.4 Forecast model
- 1.5 Primary research and validation
- 1.5.1 Primary sources
- 1.5.2 Data mining sources
Chapter 2 Executive Summary
- 2.1 Industry 3600 synopsis
Chapter 3 Industry Insights
- 3.1 Industry ecosystem analysis
- 3.2 Industry impact forces
- 3.2.1 Growth drivers
- 3.2.1.1 Rising prevalence of retinal disorders
- 3.2.1.2 Technological advancements in ERG devices
- 3.2.1.3 Growing geriatric population
- 3.2.1.4 Rising demand for early disease detection
- 3.2.2 Industry pitfalls and challenges
- 3.2.2.1 Lack of skilled professionals
- 3.2.2.2 Limited reimbursement policies
- 3.2.1 Growth drivers
- 3.3 Growth potential analysis
- 3.4 Regulatory landscape
- 3.5 Trump administration tariffs
- 3.5.1 Impact on trade
- 3.5.1.1 Trade volume disruptions
- 3.5.1.2 Country-wise response
- 3.5.2 Impact on the industry
- 3.5.2.1 Supply-side impact (Cost of manufacturing)
- 3.5.2.1.1 Price volatility in key materials
- 3.5.2.1.2 Supply chain restructuring
- 3.5.2.1.3 Production cost implications
- 3.5.2.2 Demand-side impact (Cost to consumers)
- 3.5.2.2.1 Price transmission to end markets
- 3.5.2.2.2 Market share dynamics
- 3.5.2.2.3 Consumer response patterns
- 3.5.2.1 Supply-side impact (Cost of manufacturing)
- 3.5.3 Key companies impacted
- 3.5.4 Strategic industry responses
- 3.5.4.1 Supply chain reconfiguration
- 3.5.4.2 Pricing and product strategies
- 3.5.4.3 Policy engagement
- 3.5.5 Outlook and future considerations
- 3.5.1 Impact on trade
- 3.6 Pricing analysis
- 3.7 Technology landscape
- 3.8 Gap analysis
- 3.9 Porter's analysis
- 3.10 PESTEL analysis
Chapter 4 Competitive Landscape, 2024
- 4.1 Introduction
- 4.2 Company market share analysis
- 4.3 Company matrix analysis
- 4.4 Competitive positioning matrix
- 4.5 Strategy dashboard
Chapter 5 Market Estimates and Forecast, By Type, 2021 - 2034 ($ Mn and Units)
- 5.1 Key trends
- 5.2 Full-field flash ERG (ffERG)
- 5.3 Pattern ERG (PERG)
- 5.4 Multifocal ERG (mfERG)
Chapter 6 Market Estimates and Forecast, By Product, 2021 - 2034 ($ Mn and Units)
- 6.1 Key trends
- 6.2 Tabletop
- 6.3 Handheld
Chapter 7 Market Estimates and Forecast, By Application, 2021 - 2034 ($ Mn)
- 7.1 Key trends
- 7.2 Clinical diagnostics
- 7.3 Research
Chapter 8 Market Estimates and Forecast, By End Use, 2021 - 2034 ($ Mn)
- 8.1 Key trends
- 8.2 Hospitals and clinics
- 8.3 Ophthalmic centers
- 8.4 Research institutes
Chapter 9 Market Estimates and Forecast, By Region, 2021 - 2034 ($ Mn and Units)
- 9.1 Key trends
- 9.2 North America
- 9.2.1 U.S.
- 9.2.2 Canada
- 9.3 Europe
- 9.3.1 Germany
- 9.3.2 UK
- 9.3.3 France
- 9.3.4 Spain
- 9.3.5 Italy
- 9.3.6 Netherlands
- 9.4 Asia Pacific
- 9.4.1 China
- 9.4.2 Japan
- 9.4.3 India
- 9.4.4 Australia
- 9.4.5 South Korea
- 9.5 Latin America
- 9.5.1 Brazil
- 9.5.2 Mexico
- 9.5.3 Argentina
- 9.6 Middle East and Africa
- 9.6.1 South Africa
- 9.6.2 Saudi Arabia
- 9.6.3 UAE
Chapter 10 Company Profiles
- 10.1 an-vision
- 10.2 ChongQing SunKingdom Medical
- 10.3 CSO
- 10.4 Diagnosys
- 10.5 Diopsys
- 10.6 Electro-Diagnostic Imaging
- 10.7 Konan Medical USA
- 10.8 LKC Technologies
- 10.9 M&S Technologies
- 10.10 Metrovision
- 10.11 Roland Consult Stasche & Finger
 视网膜成像设备市场:2026-2032年全球市场预测(按设备类型、连接方式、便携性、应用、最终用户、适应症和分销管道划分)智慧型影像设备市场按产品类型、应用、最终用户和分销管道划分 - 全球预测 2026-2032
 视网膜成像设备:全球市场份额和排名、总收入和需求预测(2025-2031年)
 全球视网膜电图市场全球视网膜成像设备市场
 智慧型成像设备市场,按设备类型、按技术、按组件、按连接性、按应用、按国家和地区 - 2025 年至 2032 年全球行业分析、市场规模、市场份额和预测
 视网膜影像设备市场:依产品类型、依技术、依最终用户、按地区全球视网膜电图市场按类型、产品、应用、适应症、最终用户和地区划分
 视网膜电图 (ERG) 的全球市场:产业分析·规模·占有率·成长·趋势·预测 (2024-2031年)
 视网膜电图市场规模、份额、趋势分析报告:按类型、产品、应用、地区和细分市场预测,2025-2030