


 |
市场调查报告书
商品编码
1750342
抗氧化饮料市场机会、成长动力、产业趋势分析及 2025 - 2034 年预测Antioxidant Drinks Market Opportunity, Growth Drivers, Industry Trend Analysis, and Forecast 2025 - 2034 |
||||||
2024年,全球抗氧化饮料市场规模达203亿美元,预计到2034年将以6%的复合年增长率成长,达到361亿美元。这一成长趋势主要源自于消费者对健康保健日益增长的关注,他们越来越青睐具有功能性益处的饮料。随着越来越多的人致力于增强免疫系统、延缓老化和减少体内毒素的积累,富含抗氧化成分的饮料正日益受到青睐。现代消费者资讯丰富,积极寻求有助于预防性保健的产品,这种行为正在重塑饮料市场格局。
随着人们越来越意识到氧化压力的有害影响及其与慢性疾病和老化之间的联繫,对抗氧化压力的饮料需求激增。如今,注重健康的消费者不仅寻求口感佳,还寻求符合清洁标籤趋势的饮料,青睐透明度和天然成分。市场已明显转向低卡路里、无糖和植物性产品,推动功能性饮料成为主流。此外,超市、专卖店、便利商店和线上平台等零售通路中抗氧化饮料的供应日益丰富,消费者更容易获得自己喜欢的产品,从而推动了市场扩张。
| 市场范围 | |
|---|---|
| 起始年份 | 2024 |
| 预测年份 | 2025-2034 |
| 起始值 | 203亿美元 |
| 预测值 | 361亿美元 |
| 复合年增长率 | 6% |
市场表现因地区而异,北美和欧洲的产品渗透率较高。同时,随着传统健康饮品重新受到欢迎,亚太地区也正经历快速成长。在所有人群中,线上零售越来越受到青睐,尤其是注重便利性和直销的年轻消费者群体。这种不断变化的零售格局为品牌创造了新的机会,使其能够透过个人化和创新的产品吸引消费者。
创新是这个市场的显着特征,各公司不断开发新配方,以满足日益增长的功能性、健康型饮料需求。随着健康成为消费者生活方式中不可或缺的一部分,製造商预计将尝试新的成分和技术,以保持竞争力。随着消费者继续优先考虑健康益处而非合成添加剂,天然功能性成分(尤其是与整体健康相关的成分)的使用可能会越来越受到青睐。
依产品类型划分,抗氧化饮料市场分为天然类和强化类。天然抗氧化饮料占据了相当大的市场份额,2024年市场价值达到136亿美元。这些饮料加工流程简单,原料来源完整,深受追求清洁标籤和营养丰富的消费者的青睐。天然产品被认为更安全、更健康,能够提供维持免疫功能和整体健康的必需抗氧化剂。
就来源而言,市场区隔包括水果、蔬菜、草药和植物药等。水果饮料在2024年占据59%的市场份额,占据主导地位,预计在预测期内将以5.8%的复合年增长率增长。水果来源仍然是抗氧化饮料的核心,因为它们营养丰富,消费者认可度高,使其成为市场主导力量。
依产品类别划分,市场包括即饮茶、蔬果混合茶、强化水、能量饮料和运动饮料、康普茶和发酵饮料、功能性咖啡和可可饮料等。其中,即饮茶预计到2025年将达到62亿美元,复合年增长率预计为6.2%。这类饮料因其代谢益处和缓解压力的特性而备受青睐,消费者更青睐其便利性和可感知的健康益处。
就分销通路而言,市场包括超市和大卖场、便利商店、专卖店、线上零售、餐饮服务等。超市和大卖场预计在2025年的价值为79亿美元,预测期间的复合年增长率为5.5%。这些门市凭藉其便利的地理位置、庞大的客流量以及多样化的产品选择,吸引了注重性价比和高端消费的消费者,因此仍然是领先的分销方式。
美国是抗氧化饮料市场的主导者,2024年贡献了34亿美元的收入。人们对功能性饮料的兴趣日益浓厚,以及人们对健康益处的认识不断提高,是推动需求激增的关键因素。美国消费者越来越青睐标籤透明且健康益处已证实的产品。这种转变促使製造商不断创新,拓展产品组合,以满足更注重健康的消费者群体的需求。
塑造竞争格局的主要公司包括可口可乐公司、达能公司、雀巢公司、三得利控股公司和塔塔消费品公司。这些公司拥有强大的全球影响力,拥有全面的产品组合以及强大的生产和分销基础设施,使其能够高效、持续地满足不同市场不断增长的需求。
目录
第一章:方法论与范围
第二章:执行摘要
第三章:行业洞察
- 市场介绍
- 产业价值链分析
- 原物料采购
- 加工製造
- 包装和分销
- 零售和消费者访问
- 技术格局
- 加工技术
- 保存方法
- 包装创新
- 新兴技术
- 市场动态
- 市场驱动因素
- 健康意识不断增强
- 慢性病盛行率不断上升
- 功能性饮料的需求不断成长
- 从含糖饮料转向更健康的替代品
- 市场限制
- 生产成本高
- 严格的监管框架
- 发展中地区消费者意识有限
- 口味和风味挑战
- 市场机会
- 产品创新与开发
- 新兴市场的扩张
- 电子商务成长
- 清洁标籤和天然成分趋势
- 市场挑战
- 维持抗氧化剂的生物可利用性
- 供应链中断
- 竞争定价压力
- 证实健康声明
- 市场驱动因素
- 杵分析
- 波特五力分析
- 监管框架和标准
- 全球法规
- 区域监管机构
- 健康声明法规
- 标籤要求
- 法规对市场成长的影响
- Covid-19影响分析
- 消费者行为分析
- 消费者人口统计
- 购买模式
- 偏好因素
- 健康认知与意识
- 永续性和环境方面
- 永续采购实践
- 环保包装倡议
- 减少废弃物的策略
- 碳足迹考量
- 川普政府关税分析
- 对贸易的影响
- 贸易量中断
- 报復措施
- 对产业的影响
- 供应方影响(原料)
- 主要材料价格波动
- 供应链重组
- 生产成本影响
- 需求面影响(售价)
- 价格传导至终端市场
- 市占率动态
- 消费者反应模式
- 受影响的主要公司
- 策略产业反应
- 供应链重组
- 定价和产品策略
- 政策参与
- 贸易统计(HS编码)
- 主要出口国(2021-2024年)
- 我们
- 日本
- 韩国
- 主要进口国(2021-2024年)
- 印度
- 俄罗斯
- 我们
- 主要出口国(2021-2024年)
- 供应方影响(原料)
- 对贸易的影响
註:以上贸易统计仅针对重点国家。
第四章:竞争格局
- 介绍
- 市占率分析
- 主要参与者所采用的关键策略
- 併购
- 伙伴关係和合作
- 产品发布和创新
- 扩张计划
- 竞争基准测试
- 战略定位矩阵
- 竞争仪錶板
- 新兴参与者分析
- 投资分析与融资方案
第五章:市场估计与预测:依产品类型,2021 - 2034 年
- 主要趋势
- 自然的
- 强化
第六章:市场估计与预测:依来源 2021 - 2034
- 主要趋势
- 水果
- 莓果(蓝莓、蔓越莓、草莓)
- 柑橘类水果
- 石榴
- 其他水果
- 蔬菜
- 甜菜根
- 红萝卜
- 其他蔬菜
- 草药和植物药
- 绿茶
- 马黛茶
- 姜黄
- 其他草药和植物药
- 其他的
第七章:市场估计与预测:依产品类别,2021 - 2034 年
- 主要趋势
- 即饮茶
- 水果和蔬菜
- 增强型水
- 能量和运动饮料
- 功能性咖啡和可可饮料
- 康普茶和发酵饮料
- 其他的
第八章:市场估计与预测:按配销通路,2021 - 2034 年
- 主要趋势
- 超市和大卖场
- 便利商店
- 专卖店
- 网路零售
- 餐饮服务
- 其他的
第九章:市场估计与预测:按地区,2021 - 2034 年
- 主要趋势
- 北美洲
- 我们
- 加拿大
- 欧洲
- 德国
- 英国
- 法国
- 西班牙
- 义大利
- 俄罗斯
- 亚太地区
- 中国
- 印度
- 日本
- 澳洲
- 韩国
- 拉丁美洲
- 巴西
- 墨西哥
- 阿根廷
- 中东和非洲
- 沙乌地阿拉伯
- 南非
- 阿联酋
第十章:公司简介
- Bai Brands LLC (Dr Pepper Snapple Group)
- Danone SA
- GT's Living Foods
- Hint, Inc.
- ITO EN, Ltd.
- Karma Culture LLC
- Keurig Dr Pepper Inc.
- Lemon Perfect
- Monster Beverage Corporation
- Nestle SA
- Ocean Spray Cranberries, Inc.
- PepsiCo, Inc.
- POM Wonderful LLC
- Red Bull GmbH
- Suntory Holdings Limited
- Tata Consumer Products Limited
- The Coca-Cola Company
- Unilever PLC
- Vita Coco
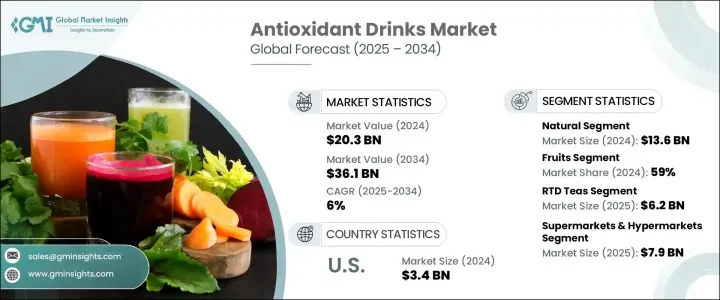
The Global Antioxidant Drinks Market was valued at USD 20.3 billion in 2024 and is estimated to grow at a CAGR of 6% to reach USD 36.1 billion by 2034. This upward trend is driven primarily by the rising focus on health and wellness, with consumers increasingly favoring beverages that offer functional benefits. Antioxidant-rich drinks are gaining momentum as more people aim to improve their immune systems, delay aging, and reduce toxin buildup in the body. The modern consumer is highly informed and actively seeks products that support preventive health, and this behavior is reshaping the beverage landscape.
Greater awareness of the harmful effects of oxidative stress and its links to chronic diseases and aging has led to an upsurge in demand for drinks that counteract these effects. Health-conscious buyers now look for beverages that not only taste good but also align with clean-label trends, favoring transparency and natural ingredients. The market has seen a marked shift toward low-calorie, sugar-free, and plant-based options, helping functional drinks become mainstream. Additionally, improved availability of antioxidant beverages across retail channels such as supermarkets, specialty stores, convenience outlets, and online platforms is making it easier for consumers to access their preferred products, thereby fueling market expansion.
| Market Scope | |
|---|---|
| Start Year | 2024 |
| Forecast Year | 2025-2034 |
| Start Value | $20.3 Billion |
| Forecast Value | $36.1 Billion |
| CAGR | 6% |
Market performance varies by region, with North America and Europe demonstrating strong product penetration. Meanwhile, the Asia-Pacific region is witnessing rapid growth as traditional wellness drinks gain renewed popularity. Across all demographics, online retail is increasingly preferred, especially among younger buyers who value convenience and direct-to-consumer accessibility. This changing retail dynamic is creating new opportunities for brands to engage customers with personalized and innovative offerings.
Innovation is a defining trait of this market, with companies developing new formulations to meet the growing demand for functional, health-enhancing beverages. As wellness becomes an integral part of consumer lifestyles, manufacturers are expected to experiment with new ingredients and technologies to stay competitive. The use of naturally functional ingredients, particularly those associated with holistic wellness, is likely to gain traction as consumers continue to prioritize health benefits over synthetic additives.
By product type, the antioxidant drinks market is divided into natural and fortified categories. Natural antioxidant drinks captured a significant market share, recording a value of USD 13.6 billion in 2024. These beverages, which are made with minimal processing and sourced from whole ingredients, are preferred by consumers seeking clean-label, nutrient-dense options. Natural products are perceived as safer and healthier, offering essential antioxidants that support immune function and overall wellness.
In terms of sources, the market segments include fruits, vegetables, herbs and botanicals, and others. Fruit-based beverages led the segment with a 59% share in 2024 and are expected to grow at a CAGR of 5.8% through the forecast period. Fruit sources remain central to antioxidant beverages due to their high nutrient content and favorable consumer perception, making them a dominant force in the market.
When categorized by product category, the market comprises RTD teas, fruit and vegetable blends, enhanced waters, energy and sports drinks, kombucha and fermented drinks, functional coffee and cocoa-based beverages, and others. Among these, RTD teas are projected to reach USD 6.2 billion in 2025 and are anticipated to grow at a CAGR of 6.2%. These beverages are valued for their metabolic benefits and stress-relief properties, with consumers gravitating toward their convenience and perceived health benefits.
In terms of distribution channels, the market includes supermarkets and hypermarkets, convenience stores, specialty outlets, online retail, food service, and others. Supermarkets and hypermarkets accounted for a projected value of USD 7.9 billion in 2025, with an estimated CAGR of 5.5% over the forecast period. These outlets remain a leading distribution method due to their widespread accessibility, large consumer footfall, and diverse product offerings that appeal to both value-conscious and premium shoppers.
The United States is the dominant player in the antioxidant drinks market, contributing USD 3.4 billion in revenue in 2024. Growing interest in functional beverages and increasing awareness of health benefits are key factors driving the surge in demand. Consumers in the U.S. are gravitating toward products with transparent labeling and proven wellness benefits. This shift has encouraged manufacturers to innovate and expand their portfolios to cater to a more health-focused audience.
Major companies shaping the competitive landscape include The Coca-Cola Company, Danone S.A., Nestle S.A., Suntory Holdings, and Tata Consumer Products. These firms maintain a strong global presence with comprehensive product portfolios and robust production and distribution infrastructure, allowing them to meet rising demand efficiently and consistently across diverse markets.
Table of Contents
Chapter 1 Methodology and Scope
- 1.1 Market scope and definition
- 1.2 Base estimates and calculations
- 1.3 Forecast calculation
- 1.4 Data sources
- 1.4.1 Primary
- 1.4.2 Secondary
- 1.4.2.1 Paid sources
- 1.4.2.2 Public sources
- 1.5 Primary research and validation
- 1.5.1 Primary sources
- 1.5.2 Data mining sources
Chapter 2 Executive Summary
- 2.1 Market snapshot
- 2.2 Global antioxidant drinks market overview
- 2.3 Key industry highlights
- 2.4 Regional insights
- 2.5 Investment scenario
- 2.6 Competitive landscape overview
- 2.7 Future market outlook
Chapter 3 Industry Insights
- 3.1 Market introduction
- 3.2 Industry value chain analysis
- 3.2.1 Raw material sourcing and procurement
- 3.2.2 Processing and manufacturing
- 3.2.3 Packaging and distribution
- 3.2.4 Retail and consumer access
- 3.3 Technology landscape
- 3.3.1 Processing technologies
- 3.3.2 Preservation methods
- 3.3.3 Packaging innovations
- 3.3.4 Emerging technologies
- 3.4 Market dynamics
- 3.4.1 Market drivers
- 3.4.1.1 Rising health consciousness
- 3.4.1.2 Increasing prevalence of chronic diseases
- 3.4.1.3 Growing demand for functional beverages
- 3.4.1.4 Shift from sugary drinks to healthier alternatives
- 3.4.2 Market restraints
- 3.4.2.1 High production costs
- 3.4.2.2 Stringent regulatory framework
- 3.4.2.3 Limited consumer awareness in developing regions
- 3.4.2.4 Taste and flavor challenges
- 3.4.3 Market opportunities
- 3.4.3.1 Product innovation and development
- 3.4.3.2 Expansion in emerging markets
- 3.4.3.3 E-commerce growth
- 3.4.3.4 Clean label and natural ingredients trend
- 3.4.4 Market challenges
- 3.4.4.1 Maintaining bioavailability of antioxidants
- 3.4.4.2 Supply chain disruptions
- 3.4.4.3 Competitive pricing pressure
- 3.4.4.4 Substantiating health claims
- 3.4.1 Market drivers
- 3.5 Pestle analysis
- 3.6 Porter's five forces analysis
- 3.7 Regulatory framework and standards
- 3.7.1 Global regulations
- 3.7.2 Regional regulatory landscape
- 3.7.3 Health claim regulations
- 3.7.4 Labeling requirements
- 3.7.5 Impact of regulations on market growth
- 3.8 Covid-19 impact analysis
- 3.9 Consumer behavior analysis
- 3.9.1 Consumer demographics
- 3.9.2 Purchase patterns
- 3.9.3 Preference factors
- 3.9.4 Health perception and awareness
- 3.10 Sustainability and environmental aspects
- 3.10.1 Sustainable sourcing practices
- 3.10.2 Eco-friendly packaging initiatives
- 3.10.3 Waste reduction strategies
- 3.10.4 Carbon footprint considerations
- 3.11 Trump administration tariff analysis
- 3.11.1 Impact on trade
- 3.11.1.1 Trade volume disruptions
- 3.11.1.2 Retaliatory measures
- 3.11.2 Impact on the industry
- 3.11.2.1 Supply-side impact (raw materials)
- 3.11.2.1.1 Price volatility in key materials
- 3.11.2.1.2 Supply chain restructuring
- 3.11.2.1.3 Production cost implications
- 3.11.2.2 Demand-side impact (selling price)
- 3.11.2.2.1 Price transmission to end markets
- 3.11.2.2.2 Market share dynamics
- 3.11.2.2.3 Consumer response patterns
- 3.11.2.3 Key companies impacted
- 3.11.2.4 Strategic industry responses
- 3.11.2.5 Supply chain reconfiguration
- 3.11.2.6 Pricing and product strategies
- 3.11.2.7 Policy engagement
- 3.11.2.8 Trade Statistics (HS Code)
- 3.11.2.8.1 Major Exporting Countries, 2021-2024 (USD Bn)
- 3.11.2.8.1.1 U.S.
- 3.11.2.8.1.2 Japan
- 3.11.2.8.1.3 South Korea
- 3.11.2.8.2 Major Importing Countries, 2021-2024 (USD Bn)
- 3.11.2.8.2.1 India
- 3.11.2.8.2.2 Russia
- 3.11.2.8.2.3 U.S.
- 3.11.2.8.1 Major Exporting Countries, 2021-2024 (USD Bn)
- 3.11.2.1 Supply-side impact (raw materials)
- 3.11.1 Impact on trade
Note: the above trade statistics will be provided for key countries only.
Chapter 4 Competitive Landscape, 2024
- 4.1 Introduction
- 4.2 Market share analysis
- 4.3 Key strategies adopted by major players
- 4.3.1 Mergers and acquisitions
- 4.3.2 Partnerships and collaborations
- 4.3.3 Product launches and innovations
- 4.3.4 Expansion initiatives
- 4.4 Competitive benchmarking
- 4.5 Strategic positioning matrix
- 4.6 Competitive dashboard
- 4.7 Emerging players analysis
- 4.8 Investment analysis and funding scenario
Chapter 5 Market Estimates and Forecast, By Product Type, 2021 - 2034 (USD Billion) (Kilo Tons)
- 5.1 Key trends
- 5.2 Natural
- 5.3 Fortified
Chapter 6 Market Estimates and Forecast, By Source 2021 - 2034 (USD Billion) (Kilo Tons)
- 6.1 Key trends
- 6.2 Fruits
- 6.2.1 Berries (blueberry, cranberry, strawberry)
- 6.2.2 Citrus fruits
- 6.2.3 Pomegranate
- 6.2.4 Other fruits
- 6.3 Vegetable
- 6.3.1 Beetroot
- 6.3.2 Carrot
- 6.3.3 Other vegetables
- 6.4 Herbs & botanicals
- 6.4.1 Green tea
- 6.4.2 Yerba mate
- 6.4.3 Turmeric
- 6.4.4 Other herbs & botanicals
- 6.5 Others
Chapter 7 Market Estimates and Forecast, By Product category, 2021 - 2034 (USD Billion) (Kilo Tons)
- 7.1 Key trends
- 7.2 RTD teas
- 7.3 Fruits & vegetables
- 7.4 Enhanced water
- 7.5 Energy and sports drinks
- 7.6 Functional coffee and cocoa beverages
- 7.7 Kombucha and fermented drinks
- 7.8 Others
Chapter 8 Market Estimates and Forecast, By Distribution Channel, 2021 - 2034 (USD Billion) (Kilo Tons)
- 8.1 Key trends
- 8.2 Supermarkets & hypermarkets
- 8.3 Convenience stores
- 8.4 Speciality stores
- 8.5 Online retail
- 8.6 Food service
- 8.7 Others
Chapter 9 Market Estimates and Forecast, By Region, 2021 - 2034 (USD Billion) (Kilo Tons)
- 9.1 Key trends
- 9.2 North America
- 9.2.1 U.S.
- 9.2.2 Canada
- 9.3 Europe
- 9.3.1 Germany
- 9.3.2 UK
- 9.3.3 France
- 9.3.4 Spain
- 9.3.5 Italy
- 9.3.6 Russia
- 9.4 Asia Pacific
- 9.4.1 China
- 9.4.2 India
- 9.4.3 Japan
- 9.4.4 Australia
- 9.4.5 South Korea
- 9.5 Latin America
- 9.5.1 Brazil
- 9.5.2 Mexico
- 9.5.3 Argentina
- 9.6 Middle East and Africa
- 9.6.1 Saudi Arabia
- 9.6.2 South Africa
- 9.6.3 UAE
Chapter 10 Company Profiles
- 10.1 Bai Brands LLC (Dr Pepper Snapple Group)
- 10.2 Danone S.A.
- 10.3 GT's Living Foods
- 10.4 Hint, Inc.
- 10.5 ITO EN, Ltd.
- 10.6 Karma Culture LLC
- 10.7 Keurig Dr Pepper Inc.
- 10.8 Lemon Perfect
- 10.9 Monster Beverage Corporation
- 10.10 Nestle S.A.
- 10.11 Ocean Spray Cranberries, Inc.
- 10.12 PepsiCo, Inc.
- 10.13 POM Wonderful LLC
- 10.14 Red Bull GmbH
- 10.15 Suntory Holdings Limited
- 10.16 Tata Consumer Products Limited
- 10.17 The Coca-Cola Company
- 10.18 Unilever PLC
- 10.19 Vita Coco
 营养补充饮料市场预测至2034年:按饮料类型、功能成分、健康益处、消费群组、包装类型、剂型、通路和地区分類的全球分析
 红藤叶萃取物市场机会、成长驱动因素、产业趋势分析和 2024 年至 2032 年预测