


 |
市场调查报告书
商品编码
1750434
生物琥珀酸市场机会、成长动力、产业趋势分析及 2025 - 2034 年预测Bio-Succinic Acid Market Opportunity, Growth Drivers, Industry Trend Analysis, and Forecast 2025 - 2034 |
||||||
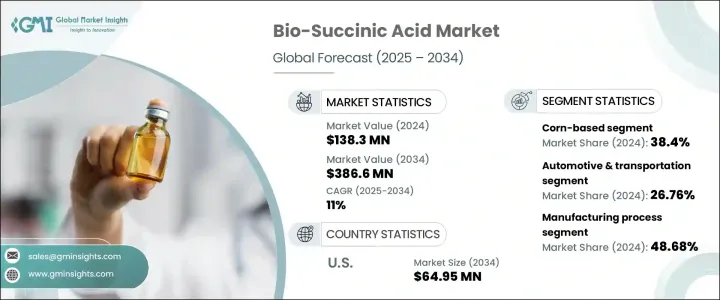
2024年,全球生物琥珀酸市场规模达1.383亿美元,预计到2034年将以11%的复合年增长率成长,达到3.866亿美元,这得益于消费者对可持续生物基化学品(而非传统石油基产品)日益增长的需求。随着各行各业和政府部门对环保解决方案的重视,生物琥珀酸作为绿色产品备受青睐,为各种应用领域提供了可再生和可生物降解的选择。人们对永续性的日益重视,加上对环境影响的监管愈发严格,使得生物琥珀酸在化学产业中扮演着重要角色。
各行各业日益转向永续材料,显着提升了对生物琥珀酸的需求,因为它是生产生物基聚合物的关键原料。在这些聚合物中,聚丁二酸丁二醇酯 (PBS) 因其生物降解性、多功能性以及在众多应用中取代石油基塑胶的潜力而脱颖而出。 PBS 需求的激增推动了对生物琥珀酸的需求,因为它可用于生产 PBS 和其他环保聚合物,从而进一步扩大了生物琥珀酸的市场。
| 市场范围 | |
|---|---|
| 起始年份 | 2024 |
| 预测年份 | 2025-2034 |
| 起始值 | 1.383亿美元 |
| 预测值 | 3.866亿美元 |
| 复合年增长率 | 11% |
2024年,玉米生产的生物琥珀酸市占率为38.4%。玉米富含碳水化合物,特别适合透过发酵过程生产生物琥珀酸。其易得性、成本效益以及稳定可靠的供应能力使其成为大规模生产的首选原料。玉米基生物琥珀酸日益普及,得益于其成熟的供应链和发酵技术的可扩展性。随着生物琥珀酸需求的成长,替代原料也正在被探索。
发酵製程因其成本效益高且依赖再生原料,占了49%的市场。这种方法可以实现规模化生产,并减少对环境的影响,使其成为大规模生产的首选。然而,一些新方法正在兴起,例如从葡萄糖和糖直接合成,这些方法在受控条件下可以获得更高的产量。化学催化也越来越受到关注,儘管其较高的成本和环境问题限制了其广泛应用。结合发酵和催化的混合製程正在被探索,作为一种在平衡成本的同时提高生产效率和永续性的解决方案。
2024年,美国生物琥珀酸市场产值达2,238万美元,预计到2034年将达到6,495万美元,这得益于政府对生物基化学品的激励措施以及工业界对再生资源日益增长的需求。美国是生物琥珀酸的主要生产国,得益于其先进的製造业基础设施和政府对绿色技术的大力支持。
全球生物琥珀酸市场的主要参与者包括Corbion NV、川崎化成化学、巴斯夫、三井物产和Reverdia。这些公司正致力于扩大产品组合、提高生产效率并探索新的原材料以提升市场占有率。例如,Corbion NV和Reverdia一直在利用先进的发酵製程来优化产量并降低成本,而三井物产则正在探索利用农业废弃物等可再生原料进行生产。透过采取这些策略,这些公司正积极利用行业日益增长的生物琥珀酸需求,以应对行业向更永续的解决方案迈进。
目录
第一章:方法论与范围
第二章:执行摘要
第三章:行业洞察
- 产业生态系统分析
- 影响价值链的因素
- 利润率分析
- 中断
- 未来展望
- 製造商
- 经销商
- 川普政府关税
- 对贸易的影响
- 贸易量中断
- 报復措施
- 对产业的影响
- 供给侧影响(原料)
- 主要材料价格波动
- 供应链重组
- 生产成本影响
- 需求面影响(售价)
- 价格传导至终端市场
- 市占率动态
- 消费者反应模式
- 受影响的主要公司
- 策略产业回应
- 供应链重构
- 定价和产品策略
- 政策参与
- 展望与未来考虑
- 对贸易的影响
- 贸易统计(HS编码)
- 主要出口国
- 主要进口国
註:以上贸易统计仅针对重点国家。
- 利润率分析
- 监管格局
- 衝击力
- 成长动力
- 对生物基化学品和永续替代品的需求不断增长
- 消费者对永续和绿色产品的偏好强烈
- 政府法规推广环保和可生物降解产品
- 产业陷阱与挑战
- 与石油基替代品相比生产成本较高
- 原料供应有限,影响可扩展性
- 成长动力
- 成长潜力分析
- 波特的分析
- PESTEL分析
第四章:竞争格局
- 介绍
- 公司市占率分析
- 竞争定位矩阵
- 战略展望矩阵
第五章:市场估计与预测:依原料来源,2021 年至 2034 年
- 主要趋势
- 玉米基
- 甘蔗基
- 木薯为主
- 木质纤维素生物质(木材、农业废弃物等)
- 其他(藻类、微生物发酵等)
第六章:市场估计与预测:依最终用途产业,2021 年至 2034 年
- 主要趋势
- 汽车与运输
- 包装产业
- 纺织业
- 建筑与基础设施
- 消费品
- 医疗保健和製药
- 农业
- 能源领域
第七章:市场估计与预测:依製造工艺,2021 年至 2034 年
- 主要趋势
- 基于发酵的生产
- 葡萄糖和糖直接合成
- 化学催化
- 混合製程(发酵和催化相结合)
第八章:市场估计与预测:按地区,2021 年至 2034 年
- 主要趋势
- 北美洲
- 我们
- 加拿大
- 欧洲
- 德国
- 英国
- 法国
- 西班牙
- 义大利
- 俄罗斯
- 亚太地区
- 中国
- 印度
- 日本
- 澳洲
- 韩国
- 拉丁美洲
- 巴西
- 墨西哥
- 阿根廷
- 中东和非洲
- 沙乌地阿拉伯
- 南非
- 阿联酋
第九章:公司简介
- AHB Global
- BASF SE
- Corbion NV
- Kawasaki Kasei Chemicals
- Mitsubishi Chemical Corporation
- Mitsui & Co., Ltd
- Myriant Corporation
- Nippon Shokubai
- Reverdia
- Roquette Freres
The Global Bio-Succinic Acid Market was valued at USD 138.3 million in 2024 and is estimated to grow at a CAGR of 11% to reach USD 386.6 million by 2034, driven by a rising consumer demand for sustainable, bio-based chemical alternatives to traditional petroleum-based products. As industries and governments alike focus on eco-friendly solutions, bio-succinic acid has gained traction as a green product, offering a renewable and biodegradable option in various applications. The increased emphasis on sustainability, coupled with stricter regulations on environmental impact, has made bio-succinic acid a key player in the chemical industry.
The increasing shift towards sustainable materials in various industries has significantly bolstered the demand for bio-succinic acid, as it is a key building block in the production of bio-based polymers. Among these polymers, polybutylene succinate (PBS) stands out due to its biodegradability, versatility, and potential to replace petroleum-based plastics in numerous applications. This surge in demand for PBS is driving the need for bio-succinic acid, as it is used in the production of PBS and other environmentally friendly polymers, further expanding the market for bio-succinic acid.
| Market Scope | |
|---|---|
| Start Year | 2024 |
| Forecast Year | 2025-2034 |
| Start Value | $138.3 Million |
| Forecast Value | $386.6 Million |
| CAGR | 11% |
The bio-succinic acid market from the corn segment held 38.4% share in 2024. Corn, being a carbohydrate-rich resource, is particularly well-suited for fermentation-based processes that yield bio-succinic acid. Its availability, cost-effectiveness, and ability to provide a consistent and reliable supply make it a preferred feedstock for large-scale production. The growing adoption of corn-based bio-succinic acid is driven by its established supply chain and the scalability of fermentation technologies. As demand for bio-succinic acid grows, alternative feedstocks are also being explored.
The fermentation-based process segment held 49% share due to its cost-effectiveness and reliance on renewable feedstocks. This method allows for scalable production with reduced environmental impact, making it the preferred choice for large-scale manufacturing. However, new approaches, such as direct synthesis from glucose and sugars, are emerging, offering higher yields under controlled conditions. Chemical catalysis is also gaining attention, although its higher costs and environmental concerns limit its widespread application. The hybrid process, combining fermentation and catalysis, is being explored as a solution to improve production efficiency and sustainability while balancing cost.
U.S Bio-Succinic Acid Market generated USD 22.38 million in 2024, with projections to reach USD 64.95 million by 2034, attributed to government incentives supporting bio-based chemicals and the growing industrial demand for renewable resources. The U.S. is a major producer of bio-succinic acid, benefiting from an advanced manufacturing infrastructure and strong governmental support for green technologies.
Key players in the Global Bio-Succinic Acid Market include Corbion N.V., Kawasaki Kasei Chemicals, BASF SE, Mitsui & Co., Ltd., and Reverdia. Companies are focusing on expanding their product portfolios, improving production efficiency, and exploring new raw materials to enhance their market share. For instance, Corbion N.V. and Reverdia have been leveraging advanced fermentation processes to optimize yields and reduce costs, while Mitsui & Co., Ltd. is exploring the use of renewable raw materials like agricultural waste for production. By adopting these strategies, these companies are positioning themselves to capitalize on the growing demand for bio-succinic acid as industries move toward more sustainable solutions.
Table of Contents
Chapter 1 Methodology & Scope
- 1.1 Market scope & definition
- 1.2 Base estimates & calculations
- 1.3 Forecast calculation
- 1.4 Data sources
- 1.4.1 Primary
- 1.4.2 Secondary
- 1.4.2.1 Paid sources
- 1.4.2.2 Public sources
- 1.5 Primary research and validation
- 1.5.1 Primary sources
- 1.5.2 Data mining sources
Chapter 2 Executive Summary
- 2.1 Industry synopsis, 2021-2034
Chapter 3 Industry Insights
- 3.1 Industry ecosystem analysis
- 3.1.1 Factor affecting the value chain
- 3.1.2 Profit margin analysis
- 3.1.3 Disruptions
- 3.1.4 Future outlook
- 3.1.5 Manufacturers
- 3.1.6 Distributors
- 3.2 Trump administration tariffs
- 3.2.1 Impact on trade
- 3.2.1.1 Trade volume disruptions
- 3.2.1.2 Retaliatory measures
- 3.2.2 Impact on the industry
- 3.2.3 Supply-side impact (raw materials)
- 3.2.3.1 Price volatility in key materials
- 3.2.3.2 Supply chain restructuring
- 3.2.3.3 Production cost implications
- 3.2.4 Demand-side impact (selling price)
- 3.2.4.1 Price transmission to end markets
- 3.2.4.2 Market share dynamics
- 3.2.4.3 Consumer response patterns
- 3.2.5 Key companies impacted
- 3.2.6 Strategic Industry Responses
- 3.2.6.1 Supply Chain Reconfiguration
- 3.2.6.2 Pricing and Product Strategies
- 3.2.6.3 Policy Engagement
- 3.2.7 Outlook and Future Considerations
- 3.2.1 Impact on trade
- 3.3 Trade statistics (HS Code)
- 3.3.1 Major Exporting Countries
- 3.3.2 Major Importing Countries
Note: the above trade statistics will be provided for key countries only.
- 3.4 Profit margin analysis
- 3.5 Regulatory landscape
- 3.6 Impact forces
- 3.6.1 Growth drivers
- 3.6.1.1 Rising demand for bio-based chemicals and sustainable alternatives
- 3.6.1.2 Strong consumer preference for sustainable and green products
- 3.6.1.3 Government regulations promoting eco-friendly and biodegradable products
- 3.6.2 Industry pitfalls & challenges
- 3.6.2.1 High production costs compared to petroleum-based alternatives
- 3.6.2.2 Limited availability of raw materials, affecting scalability
- 3.6.1 Growth drivers
- 3.7 Growth potential analysis
- 3.8 Porter's analysis
- 3.9 PESTEL analysis
Chapter 4 Competitive Landscape, 2024
- 4.1 Introduction
- 4.2 Company market share analysis
- 4.3 Competitive positioning matrix
- 4.4 Strategic outlook matrix
Chapter 5 Market Estimates and Forecast, By Raw Material Source, 2021 – 2034 (USD Million) (Kilo Tons)
- 5.1 Key trends
- 5.2 Corn-based
- 5.3 Sugarcane-based
- 5.4 Cassava-based
- 5.5 Lignocellulosic biomass (wood, agricultural waste, etc.)
- 5.6 Others (algae, microbial fermentation, etc.)
Chapter 6 Market Estimates and Forecast, By End Use Industry, 2021 – 2034 (USD Million) (Kilo Tons)
- 6.1 Key trends
- 6.2 Automotive & transportation
- 6.3 Packaging industry
- 6.4 Textile industry
- 6.5 Construction & infrastructure
- 6.6 Consumer goods
- 6.7 Healthcare & pharmaceuticals
- 6.8 Agriculture
- 6.9 Energy sector
Chapter 7 Market Estimates and Forecast, By Manufacturing Process, 2021 – 2034 (USD Million) (Kilo Tons)
- 7.1 Key trends
- 7.2 Fermentation-based production
- 7.3 Direct synthesis from glucose & sugars
- 7.4 Chemical catalysis
- 7.5 Hybrid process (combination of fermentation & catalysis)
Chapter 8 Market Estimates and Forecast, By Region, 2021 – 2034 (USD Million) (Kilo Tons)
- 8.1 Key trends
- 8.2 North America
- 8.2.1 U.S.
- 8.2.2 Canada
- 8.3 Europe
- 8.3.1 Germany
- 8.3.2 UK
- 8.3.3 France
- 8.3.4 Spain
- 8.3.5 Italy
- 8.3.6 Russia
- 8.4 Asia Pacific
- 8.4.1 China
- 8.4.2 India
- 8.4.3 Japan
- 8.4.4 Australia
- 8.4.5 South Korea
- 8.5 Latin America
- 8.5.1 Brazil
- 8.5.2 Mexico
- 8.5.3 Argentina
- 8.6 Middle East and Africa
- 8.6.1 Saudi Arabia
- 8.6.2 South Africa
- 8.6.3 UAE
Chapter 9 Company Profiles
- 9.1 AHB Global
- 9.2 BASF SE
- 9.3 Corbion N.V.
- 9.4 Kawasaki Kasei Chemicals
- 9.5 Mitsubishi Chemical Corporation
- 9.6 Mitsui & Co., Ltd
- 9.7 Myriant Corporation
- 9.8 Nippon Shokubai
- 9.9 Reverdia
- 9.10 Roquette Freres


