


 |
市场调查报告书
商品编码
1750478
无轨电车市场机会、成长动力、产业趋势分析及 2025 - 2034 年预测Trolley Bus Market Opportunity, Growth Drivers, Industry Trend Analysis, and Forecast 2025 - 2034 |
||||||
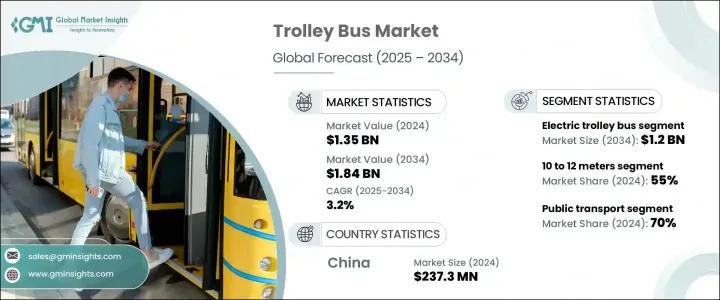
2024年,全球无轨电车市场规模达13.5亿美元,预计到2034年将以3.2%的复合年增长率成长,达到18.4亿美元。这得归功于对环保公共交通方案日益增长的需求、更严格的排放法规以及不断增长的城市人口。随着越来越多的城市寻求永续的交通替代方案,无轨电车成为一种清洁、经济高效的解决方案。这些车辆采用架空线路或混合动力系统供电,可减少对化石燃料的依赖,降低温室气体排放,并改善城市空气品质。各国政府和市政当局在追求长期永续发展和减排目标的过程中,将无轨电车纳入现有交通网络的优先事项。
无轨电车依靠架空线路或混合动力系统供电,在减少对传统燃料来源的依赖方面发挥着至关重要的作用。它们的采用显着减少了温室气体排放,并改善了人口稠密城市地区的空气品质。随着环保意识的增强,政府和城市规划者将这些车辆纳入公共交通策略,以实现气候行动目标并降低碳足迹。无轨电车也与全球城市交通趋势相契合,即优先考虑更清洁、更安静、更经济的交通方式。
| 市场范围 | |
|---|---|
| 起始年份 | 2024 |
| 预测年份 | 2025-2034 |
| 起始值 | 13.5亿美元 |
| 预测值 | 18.4亿美元 |
| 复合年增长率 | 3.2% |
2024年,电动无轨电车市场占据65%的市场份额,预计到2034年将创造12亿美元的市场价值。由于电动无轨电车直接从电网供电,因此消除了废气排放,并保持了稳定的运作性能,且不存在柴油车队常见的燃油波动问题。电动无轨电车能够与行动充电系统整合,进一步提升了线路灵活性,使其成为扩展交通网路的可靠选择。此外,更低的维护成本和更高的能源效率也使其在城市交通机构和营运商中日益受到青睐。
以车辆尺寸计算,10 至 12 公尺的车型在 2024 年占据 55% 的市场份额,其容量和机动性实现了最佳组合,非常适合繁忙的城市线路。这些中型无轨电车可容纳大量乘客,同时保持了灵活应对狭窄车道、急转弯和拥塞交通区域的灵活性。其尺寸和设计使其非常适合短途城市环线和较长的城市走廊,从而提高了车队的多功能性。此外,由于其能够提供高频次服务,且无需面对长距离公车在密集城市景观中面临的挑战,此类车型的需求正在不断增长。城市交通部门青睐这款车型,不仅因为其运作便利,还因为其与现有基础设施的兼容性。
受公共交通现代化和零排放汽车支援措施的推动,中国无轨电车市场在2024年将达到2.373亿辆。电动公共交通系统正在大规模推广,以缓解交通拥堵,减少人口密集城市的污染。采用动态充电系统供电的无轨电车正日益受到青睐,无需完全依赖固定基础设施即永续营运。这项出行创新与各大交通部门日益增长的脱碳和降低营运成本的措施相契合。
全球无轨电车市场的主要参与者包括 Solaris Bus & Coach、宇通客车、依维柯集团、斯柯达、SOR Libchavy、明斯克汽车厂、中通客车、Bogdan、Bozankaya 和 Etalon。为了提升市场地位,无轨电车行业的公司专注于产品创新、本地製造以及与城市交通部门建立战略合作伙伴关係。 Solaris Bus & Coach、中通客车和Skoda等公司优先考虑行动充电系统和模组化设计特性,以提高车辆效率和适应性。此外,各公司还投资研发以减轻车辆重量、延长续航里程并融入即时远端资讯处理技术,以便更好地管理车队。在亚太和拉丁美洲市场,製造商正在利用合资企业和政府合作来扩大其影响力。
目录
第一章:方法论与范围
第二章:执行摘要
第三章:行业洞察
- 产业生态系统分析
- 供应商格局
- 原料供应商和零件製造商
- 无轨电车原始设备製造商和系统整合商
- 基础设施提供者
- 分销管道
- 最终使用和运输当局
- 利润率分析
- 供应商格局
- 川普政府关税的影响
- 对贸易的影响
- 贸易量中断
- 报復措施
- 对产业的影响
- 供给侧影响(原料)
- 主要材料价格波动
- 供应链重组
- 生产成本影响
- 需求面影响(售价)
- 价格传导至终端市场
- 市占率动态
- 消费者反应模式
- 供给侧影响(原料)
- 策略产业反应
- 供应链重组
- 对贸易的影响
- 定价和产品策略
- 技术与创新格局
- 自主功能和智慧连接
- 高级驾驶辅助系统 (ADAS)
- 再生煞车技术
- 先进的控制系统与安全机制
- 专利分析
- 监管格局
- 排放标准和环境法规
- 政府措施和补贴
- 都市交通政策
- 安全标准与合规性
- 用例
- 重要新闻和倡议
- 成本分解分析
- 价格趋势分析
- 产品
- 地区
- 对部队的影响
- 成长动力
- 更重视零排放大众运输
- 城市人口和出行需求不断增长
- 电池系统的技术进步
- 相较于其他电动交通方式具有成本优势
- 产业陷阱与挑战
- 初始基础设施成本高
- 架空线路系统的运作限制
- 成长动力
- 成长潜力分析
- 波特的分析
- PESTEL分析
- 可持续性分析
- 总拥有成本(TCO)分析
- 收购成本
- 基础设施成本
- 营运成本
- 维护成本
- 报废和处置成本
第四章:竞争格局
- 介绍
- 公司市占率分析
- 竞争定位矩阵
- 战略展望矩阵
第五章:市场估计与预测:按产品,2021 - 2034 年
- 主要趋势
- 电动无轨电车
- 混合动力/电池无轨电车
第六章:市场估计与预测:依长度,2021 - 2034
- 主要趋势
- 最远10米
- 10-12米
- 超过12米
第七章:市场估计与预测:依座位容量,2021 - 2034 年
- 主要趋势
- 少于50个席位
- 50-100个座位
- 超过100个座位
第八章:市场估计与预测:按应用,2021 - 2034 年
- 主要趋势
- 大众运输
- 旅游
- 机场接驳车
- 其他的
第九章:市场估计与预测:按地区,2021 - 2034 年
- 北美洲
- 我们
- 加拿大
- 欧洲
- 英国
- 德国
- 法国
- 义大利
- 西班牙
- 乌克兰
- 俄罗斯
- 亚太地区
- 中国
- 印度
- 日本
- 澳洲
- 韩国
- 东南亚
- 拉丁美洲
- 巴西
- 墨西哥
- 阿根廷
- 智利
- MEA
- 南非
- 沙乌地阿拉伯
- 阿联酋
第十章:公司简介
- BKM
- Bogdan
- Bozankaya
- CAIO Induscar
- Carrosserie HESS
- Dongfeng Yangtse
- Electronmash
- Etalon
- Gillig
- Iveco
- Kiepe Electric
- MINSK AUTOMOBILE PLANT
- New Flyer
- PC Transport Systems
- Škoda Group
- Solaris Bus & Coach
- SOR Libchavy
- Sunwin
- Yutong Bus
- Zhongtong Bus
The Global Trolley Bus Market was valued at USD 1.35 billion in 2024 and is estimated to grow at a CAGR of 3.2% to reach USD 1.84 billion by 2034, fueled by the rising demand for eco-friendly public transit options, stricter emission regulations, and expanding urban populations. As more cities seek sustainable transportation alternatives, trolley buses emerge as a clean, cost-effective solution. Operating on electricity supplied through overhead wires or hybrid systems, these vehicles reduce reliance on fossil fuels, lower greenhouse gas emissions, and improve urban air quality. Governments and municipalities prioritize trolley bus integration into existing networks as they pursue long-term sustainability and emission-reduction targets.
Operating on electricity supplied through overhead wires or hybrid systems, trolley buses play a vital role in reducing dependence on traditional fuel sources. Their adoption significantly reduces greenhouse gas emissions and enhances air quality in densely populated urban areas. As environmental awareness increases, governments and city planners incorporate these vehicles into public transportation strategies to meet climate action goals and lower carbon footprints. Trolley buses also align well with global urban mobility trends, where cleaner, quieter, and more cost-effective transit options are prioritized.
| Market Scope | |
|---|---|
| Start Year | 2024 |
| Forecast Year | 2025-2034 |
| Start Value | $1.35 billion |
| Forecast Value | $1.84 billion |
| CAGR | 3.2% |
The electric trolley buses segment held a 65% share in 2024 and is projected to generate USD 1.2 billion by 2034. Since they draw power directly from the grid, these buses eliminate tailpipe emissions and deliver consistent operational performance without the fuel volatility associated with diesel fleets. Their ability to integrate with in-motion charging systems further enhances their route flexibility, making them a dependable choice for expanding transit networks. Moreover, the reduced maintenance costs and improved energy efficiency add to their growing appeal among city transit agencies and operators.
Based on vehicle size, the 10 to 12-meter segment held a 55% share in 2024, offering an optimal combination of capacity and maneuverability, making it highly effective for busy metropolitan routes. These medium-sized trolley buses accommodate many passengers while maintaining the agility to handle narrow lanes, sharp turns, and congested traffic zones. Their size and design make them well-suited for short city loops and longer urban corridors, improving fleet versatility. Additionally, the demand for this category is rising due to its ability to offer high-frequency service without the challenges of longer buses in dense cityscapes. Urban transportation authorities favor this segment not only for its operational convenience but also for its compatibility with existing infrastructure.
China Trolley Bus Market generated 237.3 million in 2024, driven by initiatives aimed at modernizing mass transit and supporting zero-emission vehicles. Electrified public transit systems are being adopted at scale to manage traffic congestion and reduce pollution in densely populated cities. Trolley buses powered through in-motion charging systems are gaining traction, enabling continuous operation without full dependence on fixed infrastructure. This mobility innovation aligns with the growing push for decarbonization and reduced operational costs across major transit authorities.
Key players in the Global Trolley Bus Market include Solaris Bus & Coach, Yutong Bus, Iveco Group, Skoda, SOR Libchavy, MINSK AUTOMOBILE PLANT, Zhongtong Bus, Bogdan, Bozankaya, and Etalon. To enhance their market position, companies in the trolley bus industry focus on product innovation, local manufacturing, and strategic partnerships with urban transit authorities. Players like Solaris Bus & Coach, Zhongtong Bus, and Skoda prioritize in-motion charging systems and modular design features to increase vehicle efficiency and adaptability. Additionally, firms invest in R&D to lower vehicle weight, extend range, and incorporate real-time telematics for better fleet management. In the Asia-Pacific and Latin America markets, manufacturers are leveraging joint ventures and government collaborations to expand their presence.
Table of Contents
Chapter 1 Methodology & Scope
- 1.1 Research design
- 1.1.1 Research approach
- 1.1.2 Data collection methods
- 1.2 Base estimates & calculations
- 1.2.1 Base year calculation
- 1.2.2 Key trends for market estimation
- 1.3 Forecast model
- 1.4 Primary research and validation
- 1.4.1 Primary sources
- 1.4.2 Data mining sources
- 1.5 Market scope & definition
Chapter 2 Executive Summary
- 2.1 Industry synopsis, 2021 - 2034
Chapter 3 Industry Insights
- 3.1 Industry ecosystem analysis
- 3.1.1 Supplier landscape
- 3.1.1.1 Raw material suppliers and component manufacturers
- 3.1.1.2 Trolley Bus OEMs and system integrators
- 3.1.1.3 Infrastructure providers
- 3.1.1.4 Distribution channels
- 3.1.1.5 End use and transit authorities
- 3.1.2 Profit margin analysis
- 3.1.1 Supplier landscape
- 3.2 Impact of Trump administration tariffs
- 3.2.1 Impact on trade
- 3.2.1.1 Trade volume disruptions
- 3.2.1.2 Retaliatory measures
- 3.2.2 Impact on industry
- 3.2.2.1 Supply-side impact (raw materials)
- 3.2.2.1.1 Price volatility in key materials
- 3.2.2.1.2 Supply chain restructuring
- 3.2.2.1.3 Production cost implications
- 3.2.2.2 Demand-side impact (selling price)
- 3.2.2.2.1 Price transmission to end markets
- 3.2.2.2.2 Market share dynamics
- 3.2.2.2.3 Consumer response patterns
- 3.2.2.1 Supply-side impact (raw materials)
- 3.2.3 Strategic industry responses
- 3.2.3.1 Supply chain reconfiguration
- 3.2.1 Impact on trade
- 3.3 Pricing and product strategies
- 3.4 Technology & innovation landscape
- 3.4.1 Autonomous features and smart connectivity
- 3.4.2 Advanced driver assistance systems (ADAS)
- 3.4.3 Regenerative braking technologies
- 3.4.4 Advanced control systems and safety mechanisms
- 3.5 Patent analysis
- 3.6 Regulatory landscape
- 3.6.1 Emission standards and environmental regulations
- 3.6.2 Government initiatives and subsidies
- 3.6.3 Urban transport policies
- 3.6.4 Safety standards and compliance
- 3.7 Use cases
- 3.8 Key news & initiatives
- 3.9 Cost break-down analysis
- 3.10 Price trend analysis
- 3.10.1 Product
- 3.10.2 Region
- 3.11 Impact on forces
- 3.11.1 Growth drivers
- 3.11.1.1 Increasing focus on zero-emission public transport
- 3.11.1.2 Rising urban population and mobility needs
- 3.11.1.3 Technological advancements in battery systems
- 3.11.1.4 Cost advantages over other electric transit options
- 3.11.2 Industry pitfalls & challenges
- 3.11.2.1 High initial infrastructure costs
- 3.11.2.2 Operational constraints of overhead wire systems
- 3.11.1 Growth drivers
- 3.12 Growth potential analysis
- 3.13 Porter's analysis
- 3.14 PESTEL analysis
- 3.15 Sustainability analysis
- 3.16 Total Cost of Ownership (TCO) analysis
- 3.16.1 Acquisition cost
- 3.16.2 Infrastructure costs
- 3.16.3 Operational costs
- 3.16.4 Maintenance costs
- 3.16.5 End-of-Life and disposal costs
Chapter 4 Competitive Landscape, 2024
- 4.1 Introduction
- 4.2 Company market share analysis
- 4.3 Competitive positioning matrix
- 4.4 Strategic outlook matrix
Chapter 5 Market Estimates & Forecast, By Product, 2021 - 2034 ($Mn, Units)
- 5.1 Key trends
- 5.2 Electric trolley bus
- 5.3 Hybrid/Battery trolley bus
Chapter 6 Market Estimates & Forecast, By Length, 2021 - 2034 ($Mn Units)
- 6.1 Key trends
- 6.2 Up to 10 meters
- 6.3 10-12 meters
- 6.4 More than 12 meters
Chapter 7 Market Estimates & Forecast, By Seating Capacity, 2021 - 2034 ($Mn, Units)
- 7.1 Key trends
- 7.2 Less than 50 seats
- 7.3 50-100 seat
- 7.4 Above 100 seats
Chapter 8 Market Estimates & Forecast, By Application, 2021 - 2034 ($Mn, Units)
- 8.1 Key trends
- 8.2 Public transport
- 8.3 Tourism
- 8.4 Airport shuttle
- 8.5 Others
Chapter 9 Market Estimates & Forecast, By Region, 2021 - 2034 ($Mn, Units)
- 9.1 North America
- 9.1.1 U.S.
- 9.1.2 Canada
- 9.2 Europe
- 9.2.1 UK
- 9.2.2 Germany
- 9.2.3 France
- 9.2.4 Italy
- 9.2.5 Spain
- 9.2.6 Ukraine
- 9.2.7 Russia
- 9.3 Asia Pacific
- 9.3.1 China
- 9.3.2 India
- 9.3.3 Japan
- 9.3.4 Australia
- 9.3.5 South Korea
- 9.3.6 Southeast Asia
- 9.4 Latin America
- 9.4.1 Brazil
- 9.4.2 Mexico
- 9.4.3 Argentina
- 9.4.4 Chile
- 9.5 MEA
- 9.5.1 South Africa
- 9.5.2 Saudi Arabia
- 9.5.3 UAE
Chapter 10 Company Profiles
- 10.1 BKM
- 10.2 Bogdan
- 10.3 Bozankaya
- 10.4 CAIO Induscar
- 10.5 Carrosserie HESS
- 10.6 Dongfeng Yangtse
- 10.7 Electronmash
- 10.8 Etalon
- 10.9 Gillig
- 10.10 Iveco
- 10.11 Kiepe Electric
- 10.12 MINSK AUTOMOBILE PLANT
- 10.13 New Flyer
- 10.14 PC Transport Systems
- 10.15 Škoda Group
- 10.16 Solaris Bus & Coach
- 10.17 SOR Libchavy
- 10.18 Sunwin
- 10.19 Yutong Bus
- 10.20 Zhongtong Bus
 电动公车充电受电弓市场(按受电弓类型、充电方式、额定功率和最终用户划分)-全球预测,2026-2032年
 2026-2034年全球长途客车市场规模、份额、趋势和成长分析报告
 受电弓式公车充电器市场 - 全球产业规模、份额、趋势、机会、预测:按充电器类型、组件类型、充电器基础设施、地区和竞争对手划分,2021-2031 年巴士和长途客车市场 - 全球产业规模、份额、趋势、机会和预测(按车辆类型、运输类型、燃料类型、长度、座位容量、地区和竞争格局划分),2021-2031年
 2026-2030年全球铰接式客车市场按电流类型、充电器类型、输出功率、安装类型、电压等级和最终用户分類的受电弓充电器市场,全球预测,2026-2032年
 客车线束市场:按材料、组件、类别、应用、国家和地区划分 - 全球产业分析、市场规模、市场份额及2025-2032年预测
 日本巴士市场报告(按类型(单层巴士、双层巴士)、燃料类型(柴油、电动、混合动力及其他)、座位容量(15-30座、31-50座、50座以上)、用途(短程巴士、城际巴士/长途客车及其他)及地区划分,2026-2034年)
 公车市场规模、份额和趋势分析报告:按动力类型、座位容量、最终用途、地区和细分市场预测(2026-2033 年)全球巴士市场-2025-2030年预测