


 |
市场调查报告书
商品编码
1750536
智慧瓦斯表市场机会、成长动力、产业趋势分析及 2025 - 2034 年预测Smart Gas Meters Market Opportunity, Growth Drivers, Industry Trend Analysis, and Forecast 2025 - 2034 |
||||||
2024年,全球智慧瓦斯表市场规模达66亿美元,预计到2034年将以16.9%的复合年增长率成长,达到315亿美元。这一成长轨迹主要源自于对精准计费、更完善的能耗监控以及即时监测损耗能力日益增长的需求。随着公用事业供应商不断提升营运效率,智慧计量系统正获得显着发展,尤其是在住宅和商业用户中。消费者能源使用意识的不断提升,以及先进技术的融合,进一步加速了这些计量表在各领域的应用。各地区政府也在推动公用事业基础设施的数位化,这为公共和私营部门的利害关係人投资智慧燃气表系统提供了强大的动力。这些计量表使用户能够即时监控燃气使用情况,优化能源消耗,并最终降低每月帐单,从而为消费者和供应商带来显着的价值提升。此外,朝向更永续、更环保的能源消费模式转变,也推动各行各业采用能够增强能源问责制和透明度的系统。
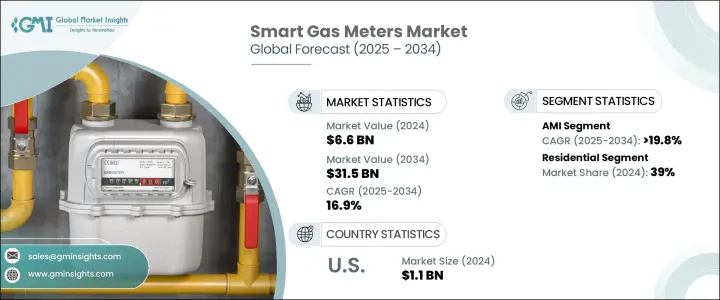
根据技术,市场可分为先进计量基础设施 (AMI) 和自动抄表 (AMR)。其中,AMI 领域有望实现显着成长,预计预测期内复合年增长率将超过 19.8%。这一增长得益于智慧基础设施的广泛部署,这些基础设施是国家和地区现代化计划的一部分。 AMI 解决方案在公用事业公司和最终用户之间提供双向通信,从而实现对天然气使用情况的更动态控制和即时资料收集。这些功能不仅支援更快解决问题,还有助于改善能源管理,并为公用事业提供者节省长期成本。随着公用事业公司持续投资数位转型,AMI 预计将在未来几年占据科技领域的主导地位。
| 市场范围 | |
|---|---|
| 起始年份 | 2024 |
| 预测年份 | 2025-2034 |
| 起始值 | 66亿美元 |
| 预测值 | 315亿美元 |
| 复合年增长率 | 16.9% |
从应用角度来看,智慧瓦斯表市场细分为商业、住宅和公用事业领域。 2024年,住宅领域约占全球市场份额的39%,领先其他所有领域。消费者越来越希望即时了解能源使用情况,而智慧燃气表正是实现这一目标所需的工具。随着家庭致力于减少消耗并提高能源效率,对智慧燃气表解决方案的需求持续增长。支持性监管政策和激励措施,以及向清洁能源转型的趋势,也大大促进了该领域的扩张。智慧瓦斯表的便利性和成本效益使其在住宅领域尤其具有吸引力,并推动了其广泛应用。
美国已成为全球市场的重要一环,其智慧瓦斯表市场规模预计在2022年达到8亿美元,2023年将达到9亿美元,2024年将达到11亿美元。美国正经历计量系统技术的快速进步,以及日益增长的清洁能源实践。这些发展促使公用事业供应商使用更聪明的替代方案升级现有基础设施。美国智慧瓦斯表的普及既受到环保目标的推动,也受到提高电网可靠性和效率的需求的推动。公用事业公司和消费者对这些燃气表的接受度日益提高,预计将在可预见的未来保持美国市场强劲成长势头。
智慧瓦斯表市场的竞争格局较为集中,五大巨头合计占约35%的市场。这些核心公司正致力于提升製造能力、增强技术产品,并建立广泛的全球供应链,以增强其市场影响力。他们正投入大量资金进行研发,以推出符合全球永续发展目标的创新计量技术。与能源供应商和科技公司进行策略合作正成为这些市场领导者获得大规模合约的热门途径。此外,他们也高度重视本地生产和卓越的售后服务,这有助于加快部署速度并提高客户满意度。
目录
第一章:方法论与范围
第二章:执行摘要
第三章:行业洞察
- 产业生态系统
- 川普政府关税分析
- 对贸易的影响
- 贸易量中断
- 报復措施
- 对产业的影响
- 供应方影响(原料)
- 主要材料价格波动
- 供应链重组
- 生产成本影响
- 需求面影响(售价)
- 价格传导至终端市场
- 市占率动态
- 消费者反应模式
- 供应方影响(原料)
- 受影响的主要公司
- 策略产业反应
- 供应链重组
- 定价和产品策略
- 政策参与
- 展望与未来考虑
- 对贸易的影响
- 监管格局
- 产业衝击力
- 成长动力
- 产业陷阱与挑战
- 成长潜力分析
- 波特的分析
- PESTEL分析
第四章:竞争格局
- 介绍
- 公司市占率
- 战略仪表板
- 策略倡议
- 竞争基准测试
- 创新与永续发展格局
第五章:市场规模及预测:依技术分类,2021 - 2034 年
- 主要趋势
- 急性心肌梗塞
- 抗肿瘤药物
第六章:市场规模及预测:依应用,2021 - 2034
- 主要趋势
- 住宅
- 商业的
- 公用事业
第七章:市场规模及预测:依地区,2021 - 2034
- 主要趋势
- 北美洲
- 我们
- 加拿大
- 欧洲
- 德国
- 英国
- 法国
- 瑞典
- 义大利
- 亚太地区
- 中国
- 日本
- 印度
- 韩国
- 澳洲
- 中东和非洲
- 阿联酋
- 沙乌地阿拉伯
- 南非
- 埃及
- 拉丁美洲
- 巴西
- 墨西哥
- 阿根廷
第八章:公司简介
- Aclara Technologies
- Apator
- Azbil Kimmon
- Chint Group
- Honeywell International
- Itron
- Landis+Gyr
- Neptune Technology Group
- Osaki Electric
- Raychem RPG
- Schneider Electric
- Sensus
- Wasion Group
- Zenner International
The Global Smart Gas Meters Market was valued at USD 6.6 billion in 2024 and is estimated to grow at a CAGR of 16.9% to reach USD 31.5 billion by 2034. This growth trajectory is primarily driven by increasing demand for accurate billing, better consumption monitoring, and the ability to detect losses in real time. As utility providers push for operational efficiency, smart metering systems are gaining significant traction, especially among residential and commercial users. Rising consumer awareness about energy usage, along with the integration of advanced technologies, is further accelerating the adoption of these meters across diverse sectors. Governments across various regions are also promoting digitalization in utility infrastructure, providing a strong incentive for both private and public stakeholders to invest in intelligent gas metering systems. These meters enable users to monitor real-time gas usage, optimize energy consumption, and ultimately reduce monthly bills, which adds considerable value to consumers and providers alike. Additionally, the shift toward more sustainable and environmentally conscious energy consumption is pushing industries to adopt systems that enhance energy accountability and transparency.
The market is categorized by technology into Advanced Metering Infrastructure (AMI) and Automatic Meter Reading (AMR). Among these, the AMI segment is poised for remarkable growth, projected to register a CAGR exceeding 19.8% during the forecast period. This growth is attributed to widespread rollouts of smart infrastructure as part of broader national and regional modernization initiatives. AMI solutions offer two-way communication between utilities and end-users, enabling more dynamic control over gas usage and real-time data collection. These capabilities not only support faster issue resolution but also contribute to improved energy management and long-term cost savings for utility providers. As utilities continue investing in digital transformation, AMI is expected to dominate the technology landscape in the coming years.
| Market Scope | |
|---|---|
| Start Year | 2024 |
| Forecast Year | 2025-2034 |
| Start Value | $6.6 Billion |
| Forecast Value | $31.5 Billion |
| CAGR | 16.9% |
In terms of application, the smart gas meters market is segmented into commercial, residential, and utility sectors. The residential segment accounted for approximately 39% of the global market share in 2024, leading all other segments. Consumers are increasingly seeking real-time visibility into their energy usage, and smart meters provide the tools needed to achieve that. As households aim to reduce consumption and become more energy-efficient, the demand for intelligent gas metering solutions continues to climb. Supportive regulatory policies and incentives, along with the trend of switching to cleaner energy sources, are also contributing significantly to the expansion of this segment. The convenience and cost-effectiveness offered by smart meters make them particularly appealing in the residential space, driving widespread adoption.
The United States has emerged as a key market in the global landscape, with its smart gas meters market valued at USD 800 million in 2022, USD 900 million in 2023, and reaching USD 1.1 billion in 2024. The country is witnessing rapid technological advancements in metering systems and a growing push toward cleaner energy practices. These developments are prompting utility providers to upgrade existing infrastructure with smarter alternatives. The adoption of smart meters in the US is being fueled by both environmental goals and the need to enhance grid reliability and efficiency. The growing acceptance of these meters among utility firms and consumers alike is expected to keep the US market on a strong upward path in the foreseeable future.
The competitive landscape of the smart gas meters market is moderately concentrated, with five major players collectively holding about 35% of the total market share. These key companies are focusing on expanding their manufacturing capabilities, enhancing their technological offerings, and building extensive global supply chains to strengthen their market presence. Significant investments are being funneled into research and development to introduce innovative metering technologies that align with global sustainability goals. Strategic collaborations with energy providers and tech firms are becoming a popular route for these market leaders to secure large-scale contracts. Additionally, there is a strong emphasis on local production and superior after-sales services, which help speed up deployment and improve customer satisfaction.
Table of Contents
Chapter 1 Methodology & Scope
- 1.1 Research design
- 1.2 Base estimates & calculations
- 1.3 Forecast calculation
- 1.4 Primary research & validation
- 1.4.1 Primary sources
- 1.4.2 Data mining sources
- 1.5 Market definitions
Chapter 2 Executive Summary
- 2.1 Industry synopsis, 2021 - 2034
Chapter 3 Industry Insights
- 3.1 Industry ecosystem
- 3.2 Trump administration tariff analysis
- 3.2.1 Impact on trade
- 3.2.1.1 Trade volume disruptions
- 3.2.1.2 Retaliatory measures
- 3.2.2 Impact on the industry
- 3.2.2.1 Supply-side impact (raw materials)
- 3.2.2.1.1 Price volatility in key materials
- 3.2.2.1.2 Supply chain restructuring
- 3.2.2.1.3 Production cost implications
- 3.2.2.2 Demand-side impact (selling price)
- 3.2.2.2.1 Price transmission to end markets
- 3.2.2.2.2 Market share dynamics
- 3.2.2.2.3 Consumer response patterns
- 3.2.2.1 Supply-side impact (raw materials)
- 3.2.3 Key companies impacted
- 3.2.4 Strategic industry responses
- 3.2.4.1 Supply chain reconfiguration
- 3.2.4.2 Pricing and product strategies
- 3.2.4.3 Policy engagement
- 3.2.5 Outlook and future considerations
- 3.2.1 Impact on trade
- 3.3 Regulatory landscape
- 3.4 Industry impact forces
- 3.4.1 Growth drivers
- 3.4.2 Industry pitfalls & challenges
- 3.5 Growth potential analysis
- 3.6 Porter's analysis
- 3.6.1 Bargaining power of suppliers
- 3.6.2 Bargaining power of buyers
- 3.6.3 Threat of new entrants
- 3.6.4 Threat of substitutes
- 3.7 PESTEL analysis
Chapter 4 Competitive landscape, 2024
- 4.1 Introduction
- 4.2 Company market share
- 4.3 Strategic dashboard
- 4.4 Strategic initiative
- 4.5 Competitive benchmarking
- 4.6 Innovation & sustainability landscape
Chapter 5 Market Size and Forecast, By Technology, 2021 - 2034 (‘000 Units, USD Million)
- 5.1 Key trends
- 5.2 AMI
- 5.3 AMR
Chapter 6 Market Size and Forecast, By Application, 2021 - 2034 (‘000 Units, USD Million)
- 6.1 Key trends
- 6.2 Residential
- 6.3 Commercial
- 6.4 Utility
Chapter 7 Market Size and Forecast, By Region, 2021 - 2034 (‘000 Units, USD Million)
- 7.1 Key trends
- 7.2 North America
- 7.2.1 U.S.
- 7.2.2 Canada
- 7.3 Europe
- 7.3.1 Germany
- 7.3.2 UK
- 7.3.3 France
- 7.3.4 Sweden
- 7.3.5 Italy
- 7.4 Asia Pacific
- 7.4.1 China
- 7.4.2 Japan
- 7.4.3 India
- 7.4.4 South Korea
- 7.4.5 Australia
- 7.5 Middle East & Africa
- 7.5.1 UAE
- 7.5.2 Saudi Arabia
- 7.5.3 South Africa
- 7.5.4 Egypt
- 7.6 Latin America
- 7.6.1 Brazil
- 7.6.2 Mexico
- 7.6.3 Argentina
Chapter 8 Company Profiles
- 8.1 Aclara Technologies
- 8.2 Apator
- 8.3 Azbil Kimmon
- 8.4 Chint Group
- 8.5 Honeywell International
- 8.6 Itron
- 8.7 Landis+Gyr
- 8.8 Neptune Technology Group
- 8.9 Osaki Electric
- 8.10 Raychem RPG
- 8.11 Schneider Electric
- 8.12 Sensus
- 8.13 Wasion Group
- 8.14 Zenner International
 智慧燃气表市场报告:按组件、类型、应用和地区划分(2026-2034 年)
 智慧燃气表市场:2026-2032年全球市场预测(按表型、瓦斯类型、组件、通讯方式、应用、安装方式、最终用户和通路划分)
 2026年全球智慧燃气表市场报告日本智慧瓦斯表市场报告(按组件(硬体、软体)、类型(自动计量基础设施 (AMI)、自动抄表 (AMR))、最终用途(住宅、商业、工业)和地区划分,2026-2034 年)
 全球智慧瓦斯表市场
 全球智慧燃气表市场(按技术、类型、组件、最终用户和地区划分)- 预测至 2030 年
 智慧燃气表市场规模、份额和成长分析(按组件、类型、技术、最终用户和地区)- 2025-2032 年产业预测
 智慧燃气表:市场占有率分析、产业趋势与统计、成长预测(2025-2030 年)
 智慧燃气表市场规模、份额、趋势分析报告:按组件、按类型、按技术、按最终用途、按地区、细分市场预测,2024-2030 年
 2024-2028年全球智慧燃气表市场