


 |
市场调查报告书
商品编码
1750567
压力表市场机会、成长动力、产业趋势分析及 2025 - 2034 年预测Pressure Gauges Market Opportunity, Growth Drivers, Industry Trend Analysis, and Forecast 2025 - 2034 |
||||||
2024年,全球压力表市场规模达14.8亿美元,预计到2034年将以3.8%的复合年增长率成长,达到21.2亿美元。压力测量设备需求的不断增长,很大程度上得益于石油天然气、化学生产、发电和汽车製造等工业领域的快速发展。这些产业依赖对设备和系统内压力进行持续、准确的监测,以确保运作安全、高效运作和合规性。随着各行各业不断推动自动化,对可靠、整合的压力监测解决方案的需求也变得更加关键。支撑这些产业的技术基础设施正在快速发展,越来越依赖包括压力表在内的自动化工具来维护流程完整性并降低设备故障相关的风险。
製造设施、炼油厂和其他工业环境越来越重视营运效率和机械保护。压力表在维持这些标准方面发挥关键作用,它可以防止过压,避免造成严重的停机或代价高昂的损坏。在新兴经济体,尤其是亚太和拉丁美洲,日益增长的工业活动进一步加剧了对压力表的需求。工业基础不断扩大的国家正成为重型机械和炼油厂运营的主要消费国,这推动了对先进压力监测解决方案的需求相应增长。
| 市场范围 | |
|---|---|
| 起始年份 | 2024 |
| 预测年份 | 2025-2034 |
| 起始值 | 14.8亿美元 |
| 预测值 | 21.2亿美元 |
| 复合年增长率 | 3.8% |
随着工业 4.0 的推进,智慧技术的日益融合,压力表市场也发生了翻天覆地的变化。如今,支援物联网的压力表具备即时资料追踪、预测性维护和基于分析的效能洞察等功能。这些设备正在快速普及,尤其是在註重准确性和流程优化的行业。智慧压力表能够提高生产力、减少停机时间,并提供远端自动化监控,因此在许多需要高效能监控工具的行业中,它已成为不可或缺的必需品。
依技术分类,市场分为波登管压力表、隔膜压力表、膜盒压力表、绝对压力表、压力计以及其他类型,如波纹管压力表、压力计和差压表。 2024年,波登管压力表细分市场以约5.2亿美元的收入引领市场,预计在预测期内的复合年增长率约为4%。波登管压力表因其坚固的设计和承受极端工作条件的能力而持续受到青睐。其机械结构使其在恶劣环境下也能维持可靠的性能,适用于广泛的工业应用。这些压力表因其使用寿命长、维护成本低以及在电子压力表可能失效的严苛条件下有效运作的能力而备受青睐。
根据产品类型,全球市场分为类比压力表和数位压力表。模拟压力表(包括波登管式和隔膜式)在2024年占据约61.4%的市场份额,预计到2034年复合年增长率将达到3.5%。儘管数位压力表因其精确度和与智慧系统的兼容性而日益受到青睐,复合年增长率达到4.1%,但模拟压力表凭藉其机械可靠性、成本效益以及在需要大规模部署且无需额外电子元件成本的行业中的广泛应用,仍将占据主导地位。其简洁的设计和耐用的特性使其成为注重经济性和营运效率的行业的理想选择。
美国引领北美压力表市场,2024年其估值达3.1亿美元,预计2025年至2034年的复合年增长率将超过3.9%。美国强大的工业基础和持续升级老化基础设施的需求是推动这一成长的主要因素。压力测量系统对于能源、製造、水处理和其他关键产业的应用仍然至关重要。机械压力表因其可靠的性能和成本优势而继续广泛应用,尤其是在各行各业寻求符合严格安全和性能标准的可靠解决方案的情况下。
压力表市场仍然高度分散,众多参与者提供种类繁多的产品。在成本敏感的地区,价格竞争特别激烈,对利润率造成下行压力。製造商正大力投资研发,以打造满足不断变化的工业应用需求的下一代压力表。各公司也专注于产品创新和地理扩张,以期在新兴市场中占据更大的份额。在这种竞争格局下,快速适应不断变化的市场动态并提供差异化解决方案的能力仍然是企业成长的关键因素。
目录
第一章:方法论与范围
第二章:执行摘要
第三章:行业洞察
- 产业生态系统分析
- 影响价值链的因素。
- 利润率分析。
- 中断
- 未来展望
- 製造商
- 经销商
- 川普政府关税分析
- 对贸易的影响
- 贸易量中断
- 报復措施
- 对产业的影响
- 供给侧影响(原料)
- 主要材料价格波动
- 供应链重组
- 生产成本影响
- 需求面影响(售价)
- 价格传导至终端市场
- 市占率动态
- 消费者反应模式
- 受影响的主要公司
- 策略产业反应
- 供应链重组
- 定价和产品策略
- 政策参与
- 展望与未来考虑
- 对贸易的影响
- 供应商格局
- 利润率分析。
- 重要新闻和倡议
- 监管格局
- 衝击力
- 成长动力
- 工业化和製造业成长
- 工业应用对自动化和物联网的需求不断增长
- 压力感测技术的技术进步
- 产业陷阱与挑战
- 高阶车型的初始成本高
- 监管挑战
- 成长动力
- 成长潜力分析
- 波特的分析
- PESTEL分析
第四章:竞争格局
- 介绍
- 公司市占率分析
- 竞争定位矩阵
- 战略展望矩阵
第五章:市场估计与预测:依产品类型,2021-2034
- 主要趋势
- 模拟压力表
- 数位压力表
第六章:市场估计与预测:依技术,2021-2034 年
- 主要趋势
- 波登管压力表
- 隔膜压力表
- 膜盒压力表
- 绝对压力表
- 压力计压力表
- 其他(波纹管、压力计、差压计)
第七章:市场估计与预测:依材料,2021-2034
- 主要趋势
- 不銹钢
- 黄铜
- 铝
- 塑胶
- 其他(钢、铜、青铜等)
第八章:市场估计与预测:依最终用途,2021-2034
- 主要趋势
- 化工和石化
- 石油和天然气
- 能源与电力
- 製药
- 水和废水处理
- 其他(航太、汽车等)
第九章:市场估计与预测:按配销通路,2021-2034
- 主要趋势
- 在线的
- 离线
第十章:市场估计与预测:按地区,2021-2034
- 主要趋势
- 北美洲
- 我们
- 加拿大
- 欧洲
- 英国
- 德国
- 法国
- 义大利
- 西班牙
- 俄罗斯
- 亚太地区
- 中国
- 印度
- 日本
- 韩国
- 澳洲
- 印尼
- 马来西亚
- 拉丁美洲
- 巴西
- 墨西哥
- MEA
- 阿联酋
- 沙乌地阿拉伯
- 南非
第 11 章:公司简介
- Ametek
- Badotherm
- Circor
- Dwyer
- Emerson
- Fluke Corporation
- Honeywell International
- Kobold Instruments
- Newbow
- Omega Engineering
- QED Aerospace
- Wika Instruments
- Winters Instruments
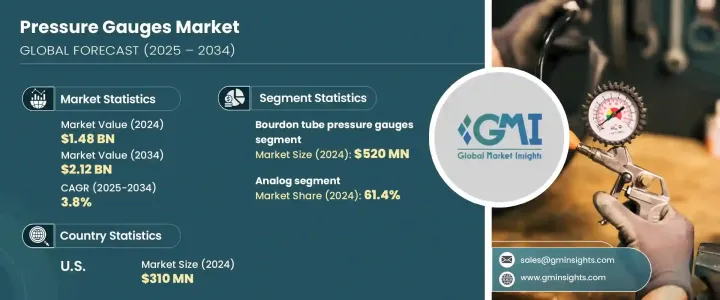
The Global Pressure Gauges Market was valued at USD 1.48 billion in 2024 and is estimated to grow at a CAGR of 3.8% to reach USD 2.12 billion by 2034. The growing demand for pressure measurement devices is largely driven by the accelerating development in industrial sectors such as oil and gas, chemical production, power generation, and automotive manufacturing. These sectors rely on consistent and accurate monitoring of pressure within equipment and systems to ensure operational safety, efficiency, and regulatory compliance. As industries continue to automate their operations, the need for reliable and integrated pressure monitoring solutions becomes even more critical. The technological infrastructure supporting these sectors is evolving rapidly, increasing reliance on automation tools, including pressure gauges, to maintain process integrity and reduce risks associated with equipment failure.
Manufacturing facilities, refineries, and other industrial environments are placing heightened emphasis on operational efficiency and machinery protection. Pressure gauges play a pivotal role in maintaining these standards by preventing over-pressurization, which can lead to significant downtime or costly damage. In emerging economies, especially in Asia-Pacific and Latin America, the demand is further intensified by the growing industrial activity. Nations with expanding industrial bases are turning into major consumers of heavy machinery and refinery operations, driving a corresponding increase in the need for advanced pressure monitoring solutions.
| Market Scope | |
|---|---|
| Start Year | 2024 |
| Forecast Year | 2025-2034 |
| Start Value | $1.48 Billion |
| Forecast Value | $2.12 Billion |
| CAGR | 3.8% |
The advancement of Industry 4.0 has transformed the pressure gauges market with the growing integration of smart technologies. Pressure gauges that are IoT-enabled now offer features such as real-time data tracking, predictive maintenance, and analytics-based performance insights. These devices are being adopted at a rapid pace, particularly in sectors where accuracy and process optimization are essential. With capabilities that enhance productivity, reduce downtime, and offer automated monitoring from remote locations, smart pressure gauges are becoming indispensable across a broad range of industries that demand high-performance monitoring tools.
By technology, the market is classified into bourdon tube, diaphragm, capsule, absolute, piezometer, and other types such as bellows, manometers, and differential pressure gauges. In 2024, the bourdon tube pressure gauges segment led the market with revenue of approximately USD 520 million and is projected to grow at a CAGR of around 4% during the forecast period. Bourdon tube gauges continue to be favored due to their robust design and ability to withstand extreme operational conditions. Their mechanical construction allows for reliable performance in harsh environments, making them suitable for a wide range of industrial applications. These gauges are valued for their longevity, low maintenance costs, and the ability to function effectively in demanding conditions where electronic alternatives may falter.
Based on product type, the global market is divided into analog and digital pressure gauges. Analog gauges, which include bourdon tube and diaphragm types, held around 61.4% of the market share in 2024 and are expected to register a CAGR of 3.5% through 2034. Although digital gauges are gaining traction due to their precision and compatibility with smart systems, growing at a CAGR of 4.1%, analog gauges continue to dominate because of their mechanical reliability, cost-effectiveness, and widespread application in industries that require large-scale deployment without the added cost of electronic components. Their simple design and durable nature make them ideal for industries focused on affordability and operational efficiency.
The United States led the North American pressure gauges market, reaching a valuation of USD 310 million in 2024 and forecasted to grow at a CAGR of over 3.9% from 2025 to 2034. The country's strong industrial base and the ongoing need to upgrade aging infrastructure are major factors contributing to this growth. Pressure measurement systems remain critical for applications across energy, manufacturing, water treatment, and other key sectors. Mechanical pressure gauges continue to be widely used due to their dependable performance and cost advantages, particularly as industries seek reliable solutions that meet strict safety and performance standards.
The pressure gauges market remains highly fragmented, with numerous players offering a wide variety of products. In cost-sensitive regions, price-based competition is especially intense, placing downward pressure on profit margins. Manufacturers are responding by investing heavily in R&D to create next-generation pressure gauges tailored to the evolving requirements of industrial applications. Companies are also focusing on product innovation and geographic expansion to capture a larger share of emerging markets. The ability to adapt quickly to changing market dynamics and deliver differentiated solutions remains a key factor for growth in this competitive landscape.
Table of Contents
Chapter 1 Methodology & Scope
- 1.1 Market scope & definitions
- 1.2 Base estimates & calculations
- 1.3 Forecast calculations.
- 1.4 Data sources
- 1.4.1 Primary
- 1.4.2 Secondary
- 1.4.2.1 Paid sources
- 1.4.2.2 Public sources
Chapter 2 Executive Summary
- 2.1 Industry synopsis, 2021-2034
Chapter 3 Industry Insights
- 3.1 Industry ecosystem analysis
- 3.1.1 Factor affecting the value chain.
- 3.1.2 Profit margin analysis.
- 3.1.3 Disruptions
- 3.1.4 Future outlook
- 3.1.5 Manufacturers
- 3.1.6 Distributors
- 3.2 Trump administration tariffs analysis
- 3.2.1 Impact on trade
- 3.2.1.1 Trade volume disruptions
- 3.2.1.2 Retaliatory measures
- 3.2.2 Impact on the industry
- 3.2.2.1 Supply-side impact (raw materials)
- 3.2.2.2 Price volatility in key materials
- 3.2.2.3 Supply chain restructuring
- 3.2.2.4 Production cost implications
- 3.2.2.5 Demand-side impact (selling price)
- 3.2.2.6 Price transmission to end markets
- 3.2.2.7 Market share dynamics
- 3.2.2.8 Consumer response patterns
- 3.2.3 Key companies impacted
- 3.2.4 Strategic industry responses
- 3.2.4.1 Supply chain reconfiguration
- 3.2.4.2 Pricing and product strategies
- 3.2.4.3 Policy engagement
- 3.2.5 Outlook and future considerations
- 3.2.1 Impact on trade
- 3.3 Supplier landscape
- 3.4 Profit margin analysis.
- 3.5 Key news & initiatives
- 3.6 Regulatory landscape
- 3.7 Impact forces
- 3.7.1 Growth drivers
- 3.7.1.1 Industrialization and manufacturing growth
- 3.7.1.2 Rising demand for automation and IoT in industrial applications
- 3.7.1.3 Technological advancements in pressure sensing technology
- 3.7.2 Industry pitfalls & challenges
- 3.7.2.1 High initial cost of premium models
- 3.7.2.2 Regulatory challenges
- 3.7.1 Growth drivers
- 3.8 Growth potential analysis
- 3.9 Porter's analysis
- 3.10 PESTEL analysis
Chapter 4 Competitive Landscape, 2024
- 4.1 Introduction
- 4.2 Company market share analysis
- 4.3 Competitive positioning matrix
- 4.4 Strategic outlook matrix
Chapter 5 Market Estimates & Forecast, By Product Type, 2021-2034 (USD Billion) (Thousand Units)
- 5.1 Key trends
- 5.2 Analog pressure gauges
- 5.3 Digital pressure gauges
Chapter 6 Market Estimates & Forecast, By Technology, 2021-2034 (USD Billion) (Thousand Units)
- 6.1 Key trends
- 6.2 Bourdon tube pressure gauges
- 6.3 Diaphragm pressure gauges
- 6.4 Capsule pressure gauges
- 6.5 Absolute pressure gauges
- 6.6 Piezometer pressure gauge
- 6.7 Others (Bellows, manometer, differential)
Chapter 7 Market Estimates & Forecast, By Material, 2021-2034 (USD Billion) (Thousand Units)
- 7.1 Key trends
- 7.2 Stainless steel
- 7.3 Brass
- 7.4 Aluminum
- 7.5 Plastic
- 7.6 Others (steel, copper, bronze etc.)
Chapter 8 Market Estimates & Forecast, By End Use, 2021-2034 (USD Billion) (Thousand Units)
- 8.1 Key trends
- 8.2 Chemical & petrochemical
- 8.3 Oil & gas
- 8.4 Energy & power
- 8.5 Pharmaceutical
- 8.6 Water & wastewater treatment
- 8.7 Others (aerospace, automotive, etc.)
Chapter 9 Market Estimates & Forecast, By Distribution Channel, 2021-2034 (USD Billion) (Thousand Units)
- 9.1 Key trends
- 9.2 Online
- 9.3 Offline
Chapter 10 Market Estimates & Forecast, By Region, 2021-2034 (USD Billion) (Thousand Units)
- 10.1 Key trends
- 10.2 North America
- 10.2.1 U.S.
- 10.2.2 Canada
- 10.3 Europe
- 10.3.1 UK
- 10.3.2 Germany
- 10.3.3 France
- 10.3.4 Italy
- 10.3.5 Spain
- 10.3.6 Russia
- 10.4 Asia Pacific
- 10.4.1 China
- 10.4.2 India
- 10.4.3 Japan
- 10.4.4 South Korea
- 10.4.5 Australia
- 10.4.6 Indonesia
- 10.4.7 Malaysia
- 10.5 Latin America
- 10.5.1 Brazil
- 10.5.2 Mexico
- 10.6 MEA
- 10.6.1 UAE
- 10.6.2 Saudi Arabia
- 10.6.3 South Africa
Chapter 11 Company Profiles
- 11.1 Ametek
- 11.2 Badotherm
- 11.3 Circor
- 11.4 Dwyer
- 11.5 Emerson
- 11.6 Fluke Corporation
- 11.7 Honeywell International
- 11.8 Kobold Instruments
- 11.9 Newbow
- 11.10 Omega Engineering
- 11.11 QED Aerospace
- 11.12 Wika Instruments
- 11.13 Winters Instruments


