


 |
市场调查报告书
商品编码
1750601
柴油主发电机市场机会、成长动力、产业趋势分析及 2025 - 2034 年预测Diesel Prime Power Generators Market Opportunity, Growth Drivers, Industry Trend Analysis, and Forecast 2025 - 2034 |
||||||
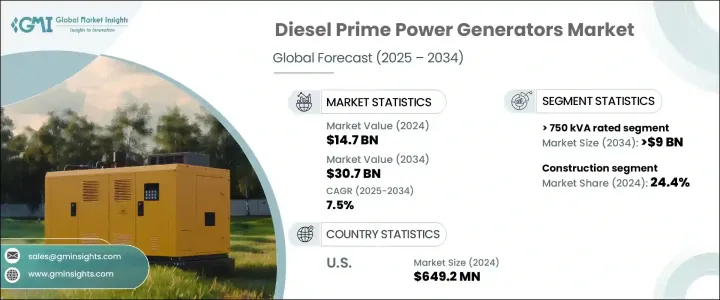
2024年,全球柴油主发电机市场规模达147亿美元,预计到2034年将以7.5%的复合年增长率成长,达到307亿美元,这得益于各行各业对稳定高效电力供应日益增长的需求。这一增长主要归因于基础设施的快速扩张以及发展中经济体对可靠电网系统日益增长的需求。世界各地的各行各业都面临着频繁停电和电力基础设施不稳定的问题,因此采用可靠的电源来维持营运的连续性至关重要。柴油主发电机已成为工业、商业机构和离网场所等需要持续供电的关键解决方案。
基础设施项目的广泛成长和工业化步伐的加快,为市场带来了强劲的发展势头。随着各国加大对大规模开发的投资,对可靠能源系统的需求也愈发迫切。备用电源和持续供电的需求日益凸显,尤其是在经常停电和电网不稳定的地区。旨在降低排放的技术进步也在塑造市场格局方面发挥关键作用。随着政府和组织机构对永续实践的重视,製造商正在创新柴油发电机技术,使其既符合排放法规,又能提供高性能。此外,工业设施和敏感商业应用等高功率营运的扩张也持续推动市场的发展。电力可靠性、灵活性和耐用性仍然是最终用户的首要考虑因素,这为基于柴油的主要电力系统创造了强大的商业案例。
| 市场范围 | |
|---|---|
| 起始年份 | 2024 |
| 预测年份 | 2025-2034 |
| 起始值 | 147亿美元 |
| 预测值 | 307亿美元 |
| 复合年增长率 | 7.5% |
市场也受益于对高负载处理设备需求产业的投资增加。随着人们对环境永续性的认识不断提高,将再生能源融入混合动力发电机模式的动力也日益增强。製造商正在积极开发节油型引擎和混合动力配置,以兼顾电力需求和环境问题。产品供应的这种演变符合不同地区最终用户的多样化需求,从而实现了更好的客製化和更广泛的应用。向永续解决方案的转变正在促进产品开发,从而催生更先进、更具成本效益和更高效的发电机组。
根据额定功率,柴油主发电机市场细分为 > 50 kVA - 125 kVA、? 50 kVA、> 125 kVA - 200 kVA、> 330 kVA - 750 kVA、> 200 kVA - 330 kVA 和 > 750 kVA。其中,> 750 kVA 类别占据主导地位,预计到 2034 年将超过 90 亿美元。这些大容量发电机专为电网不可用或不可靠的严苛环境而设计。它们能够在恶劣条件下持续提供大量电力,使其成为关键任务应用的理想选择。其坚固的设计和高效率使其成为需要持续稳定电力的场景中不可或缺的一部分,尤其是在营运要求高的行业中。
按应用领域划分,该行业可分为酒店、电信、采矿、建筑、石油和天然气、农业、工业及其他。光是建筑业在2024年的市占率就高达24.4%。这是由于在电网接入通常受限或不稳定的施工现场,对不间断电源的需求不断增长。智慧电源管理系统与再生能源组件的整合进一步提高了建筑领域的营运效率。工业建筑活动仍然严重依赖柴油发电机,这进一步增强了该行业在整体市场成长中的作用。
从区域来看,美国市场稳定扩张,2022年市值达5.706亿美元,2023年达到6.108亿美元,2024年达6.492亿美元。美国日益容易受到极端天气事件影响,加剧了对可靠备用电源系统的需求。预计北美市场将大幅成长,到2034年将突破10亿美元。这一增长主要源于电网基础设施老化以及城市和偏远地区对稳定能源日益增长的需求。排放控制、数位监控和智慧发电机技术的创新正在提升产品性能,并促进该地区的普及。
柴油主发电机产业整合程度适中,前五大公司占全球约40%的市场。这些公司以其强大的技术专长和广泛的供应网络而闻名。其广泛的产品组合可满足能源、医疗保健、製造和商业运营等行业的多样化需求。他们注重创新和适应性,确保在快速变化的能源格局中保持竞争力。
目录
第一章:方法论与范围
第二章:执行摘要
第三章:行业洞察
- 产业生态系统分析
- 川普政府关税分析
- 对贸易的影响
- 贸易量中断
- 报復措施
- 对产业的影响
- 供应方影响(原料)
- 主要材料价格波动
- 供应链重组
- 生产成本影响
- 需求面影响(售价)
- 价格传导至终端市场
- 市占率动态
- 消费者反应模式
- 供应方影响(原料)
- 受影响的主要公司
- 策略产业反应
- 供应链重组
- 定价和产品策略
- 政策参与
- 展望与未来考虑
- 对贸易的影响
- 监管格局
- 产业衝击力
- 成长动力
- 产业陷阱与挑战
- 成长潜力分析
- 波特的分析
- PESTEL分析
第四章:竞争格局
- 介绍
- 战略仪表板
- 策略倡议
- 公司市占率分析
- 竞争基准测试
- 创新与永续发展格局
第五章:市场规模及预测:依功率等级,2021 - 2034 年
- 主要趋势
- ≤50千伏安
- > 50千伏安 - 125千伏安
- > 125 千伏安 - 200 千伏安
- > 200 千伏安 - 330 千伏安
- > 330 千伏安 - 750 千伏安
- > 750千伏安
第六章:市场规模及预测:依应用,2021 - 2034
- 主要趋势
- 电信
- 饭店业
- 石油和天然气
- 矿业
- 建造
- 农业
- 产业
- 其他的
第七章:市场规模及预测:依地区,2021 - 2034
- 主要趋势
- 北美洲
- 我们
- 加拿大
- 欧洲
- 俄罗斯
- 英国
- 德国
- 法国
- 西班牙
- 奥地利
- 义大利
- 亚太地区
- 中国
- 澳洲
- 印度
- 日本
- 韩国
- 印尼
- 马来西亚
- 泰国
- 越南
- 菲律宾
- 缅甸
- 孟加拉
- 中东
- 沙乌地阿拉伯
- 阿联酋
- 卡达
- 土耳其
- 伊朗
- 阿曼
- 非洲
- 埃及
- 奈及利亚
- 阿尔及利亚
- 南非
- 安哥拉
- 肯亚
- 莫三比克
- 拉丁美洲
- 巴西
- 墨西哥
- 阿根廷
- 智利
第八章:公司简介
- Ashok Leyland
- Atlas Copco
- Briggs & Stratton
- Caterpillar
- Cummins
- Deere & Company
- Generac Power Systems
- HIMOINSA
- Kirloskar
- Mahindra POWEROL
- Mitsubishi Heavy Industries
- Rapid Power Generation
- Rehlko
- Rolls-Royce
- Siemens
- Volvo Penta
- Wartsilä
- Yanmar Holdings
The Global Diesel Prime Power Generators Market was valued at USD 14.7 billion in 2024 and is estimated to grow at a CAGR of 7.5% to reach USD 30.7 billion by 2034, driven by the increasing need for a stable and efficient power supply across various sectors. This surge is primarily attributed to rapid infrastructure expansion and the growing demand for reliable grid systems in developing economies. Industries around the world are facing frequent power outages and unstable electrical infrastructure, making it essential to adopt dependable power sources to maintain operational continuity. Diesel prime power generators have emerged as a critical solution for industries, commercial establishments, and off-grid locations that require consistent power without interruption.
The market is seeing considerable momentum from the widespread growth of infrastructure projects and the increasing pace of industrialization. As nations invest in large-scale developments, the demand for reliable energy systems becomes even more crucial. The need for backup and continuous power has become more pronounced, especially in areas facing regular blackouts and grid instability. Technological advancements aimed at lowering emissions are also playing a pivotal role in shaping the market landscape. As governments and organizations emphasize sustainable practices, manufacturers are innovating diesel generator technologies that align with emission regulations while delivering high performance. Furthermore, the expansion of high-power operations such as industrial facilities and sensitive commercial applications continues to boost the market. Power reliability, flexibility, and durability remain top priorities for end-users, creating a strong business case for diesel-based prime power systems.
| Market Scope | |
|---|---|
| Start Year | 2024 |
| Forecast Year | 2025-2034 |
| Start Value | $14.7 Billion |
| Forecast Value | $30.7 billion |
| CAGR | 7.5% |
The market is also benefiting from increased investments in sectors that require high-load handling equipment. With growing awareness around environmental sustainability, there is a stronger push to integrate renewable energy sources into hybrid generator models. Manufacturers are actively developing fuel-efficient engines and hybrid configurations that address both power demands and environmental concerns. This evolution in product offerings is in line with the diverse needs of end-users across various regions, allowing for better customization and wider adoption. The transition toward sustainable solutions is enhancing product development, leading to more advanced, cost-effective, and efficient generator sets.
Based on power rating, the diesel prime power generators market is segmented into ≤ 50 kVA, > 50 kVA - 125 kVA, > 125 kVA - 200 kVA, > 200 kVA - 330 kVA, > 330 kVA - 750 kVA, and > 750 kVA. Among these, the > 750 kVA category holds a dominant position and is anticipated to exceed USD 9 billion by 2034. These high-capacity generators are specifically designed for demanding environments where the grid is either unavailable or unreliable. Their ability to consistently deliver large volumes of power under strenuous conditions makes them ideal for mission-critical applications. Their robust design and high efficiency make them indispensable in scenarios requiring continuous and stable electricity, especially in industries with high operational demands.
In terms of application, the industry is categorized into hospitality, telecom, mining, construction, oil and gas, agriculture, industrial, and others. The construction segment alone held a 24.4% share in 2024. This is due to the increased demand for uninterrupted power on job sites where grid access is often limited or unreliable. The integration of intelligent power management systems and renewable components further enhances operational efficiency in the construction domain. Industrial construction activities continue to rely heavily on diesel generators, reinforcing the segment's role in overall market growth.
Regionally, the United States has shown steady market expansion, with values reaching USD 570.6 million in 2022, USD 610.8 million in 2023, and USD 649.2 million in 2024. The country's increasing susceptibility to extreme weather events has amplified the demand for reliable backup power systems. The broader North American market is projected to grow significantly and is expected to cross USD 1 billion by 2034. This growth is driven by aging grid infrastructure and a rising need for consistent energy in both urban and remote locations. Innovations in emission control, digital monitoring, and smart generator technologies are enhancing product performance and adoption across the region.
The diesel prime power generators industry is moderately consolidated, with the top five players accounting for approximately 40% of the global market. These companies are known for their strong technological expertise and expansive supply networks. Their broad product portfolios cater to diverse needs across sectors including energy, healthcare, manufacturing, and commercial operations. Their focus on innovation and adaptability ensures that they remain competitive in a rapidly changing energy landscape.
Table of Contents
Chapter 1 Methodology & Scope
- 1.1 Research design
- 1.2 Market estimates & forecast parameters
- 1.3 Forecast calculation
- 1.4 Data sources
- 1.4.1 Primary
- 1.4.2 Secondary
- 1.4.2.1 Paid
- 1.4.2.2 Public
- 1.5 Market definitions
Chapter 2 Executive Summary
- 2.1 Industry synopsis, 2021 - 2034
Chapter 3 Industry Insights
- 3.1 Industry ecosystem analysis
- 3.2 Trump administration tariffs analysis
- 3.2.1 Impact on trade
- 3.2.1.1 Trade volume disruptions
- 3.2.1.2 Retaliatory measures
- 3.2.2 Impact on the industry
- 3.2.2.1 Supply-side impact (raw materials)
- 3.2.2.1.1 Price volatility in key materials
- 3.2.2.1.2 Supply chain restructuring
- 3.2.2.1.3 Production cost implications
- 3.2.2.2 Demand-side impact (selling price)
- 3.2.2.2.1 Price transmission to end markets
- 3.2.2.2.2 Market share dynamics
- 3.2.2.2.3 Consumer response patterns
- 3.2.2.1 Supply-side impact (raw materials)
- 3.2.3 Key companies impacted
- 3.2.4 Strategic industry responses
- 3.2.4.1 Supply chain reconfiguration
- 3.2.4.2 Pricing and product strategies
- 3.2.4.3 Policy engagement
- 3.2.5 Outlook and future considerations
- 3.2.1 Impact on trade
- 3.3 Regulatory landscape
- 3.4 Industry impact forces
- 3.4.1 Growth drivers
- 3.4.2 Industry pitfalls & challenges
- 3.5 Growth potential analysis
- 3.6 Porter's analysis
- 3.6.1 Bargaining power of suppliers
- 3.6.2 Bargaining power of buyers
- 3.6.3 Threat of new entrants
- 3.6.4 Threat of substitutes
- 3.7 PESTEL analysis
Chapter 4 Competitive Landscape, 2025
- 4.1 Introduction
- 4.2 Strategic dashboard
- 4.3 Strategic initiatives
- 4.4 Company market share analysis, 2024
- 4.5 Competitive benchmarking
- 4.6 Innovation & sustainability landscape
Chapter 5 Market Size and Forecast, By Power Rating, 2021 - 2034 (USD Million & Units)
- 5.1 Key trends
- 5.2 ≤ 50 kVA
- 5.3 > 50 kVA - 125 kVA
- 5.4 > 125 kVA - 200 kVA
- 5.5 > 200 kVA - 330 kVA
- 5.6 > 330 kVA - 750 kVA
- 5.7 > 750 kVA
Chapter 6 Market Size and Forecast, By Application, 2021 - 2034 (USD Million & Units)
- 6.1 Key trends
- 6.2 Telecom
- 6.3 Hospitality
- 6.4 Oil & gas
- 6.5 Mining
- 6.6 Construction
- 6.7 Agriculture
- 6.8 Industries
- 6.9 Others
Chapter 7 Market Size and Forecast, By Region, 2021 - 2034 (USD Million & Units)
- 7.1 Key trends
- 7.2 North America
- 7.2.1 U.S.
- 7.2.2 Canada
- 7.3 Europe
- 7.3.1 Russia
- 7.3.2 UK
- 7.3.3 Germany
- 7.3.4 France
- 7.3.5 Spain
- 7.3.6 Austria
- 7.3.7 Italy
- 7.4 Asia Pacific
- 7.4.1 China
- 7.4.2 Australia
- 7.4.3 India
- 7.4.4 Japan
- 7.4.5 South Korea
- 7.4.6 Indonesia
- 7.4.7 Malaysia
- 7.4.8 Thailand
- 7.4.9 Vietnam
- 7.4.10 Philippines
- 7.4.11 Myanmar
- 7.4.12 Bangladesh
- 7.5 Middle East
- 7.5.1 Saudi Arabia
- 7.5.2 UAE
- 7.5.3 Qatar
- 7.5.4 Turkey
- 7.5.5 Iran
- 7.5.6 Oman
- 7.6 Africa
- 7.6.1 Egypt
- 7.6.2 Nigeria
- 7.6.3 Algeria
- 7.6.4 South Africa
- 7.6.5 Angola
- 7.6.6 Kenya
- 7.6.7 Mozambique
- 7.7 Latin America
- 7.7.1 Brazil
- 7.7.2 Mexico
- 7.7.3 Argentina
- 7.7.4 Chile
Chapter 8 Company Profiles
- 8.1 Ashok Leyland
- 8.2 Atlas Copco
- 8.3 Briggs & Stratton
- 8.4 Caterpillar
- 8.5 Cummins
- 8.6 Deere & Company
- 8.7 Generac Power Systems
- 8.8 HIMOINSA
- 8.9 Kirloskar
- 8.10 Mahindra POWEROL
- 8.11 Mitsubishi Heavy Industries
- 8.12 Rapid Power Generation
- 8.13 Rehlko
- 8.14 Rolls-Royce
- 8.15 Siemens
- 8.16 Volvo Penta
- 8.17 Wartsilä
- 8.18 Yanmar Holdings
 液气冷却剂分配单元市场:依产品类型、技术、应用、终端用户产业及通路划分,全球预测,2026-2032年
 柴油发电机:市场占有率分析、产业趋势与统计、成长预测(2026-2031)
 2026年全球空气冷发电机市场报告2026年全球柴油发电机市场报告
 柴油发电机监控系统市场 - 全球产业规模、份额、趋势、机会及预测(按类型、应用、组件、地区和竞争格局划分),2021-2031年
 日本柴油发电机市场规模、份额、趋势及预测(按容量、应用、移动性、最终用户及地区划分),2026年至2034年
 柴油发电机市场规模、份额和趋势分析报告:按额定输出功率、应用、地区和细分市场预测(2026-2033 年)
 空冷式发电机市场-2025-2030年预测
 2025年全球柴油发电机市场柴油发电机市场按千伏安额定值、最终用途、应用模式、冷却方式、安装方式和销售管道划分 - 全球预测 2025-2032