


 |
市场调查报告书
商品编码
1750602
水凝胶面膜市场机会、成长动力、产业趋势分析及 2025 - 2034 年预测Hydrogel Face Mask Market Opportunity, Growth Drivers, Industry Trend Analysis, and Forecast 2025 - 2034 |
||||||
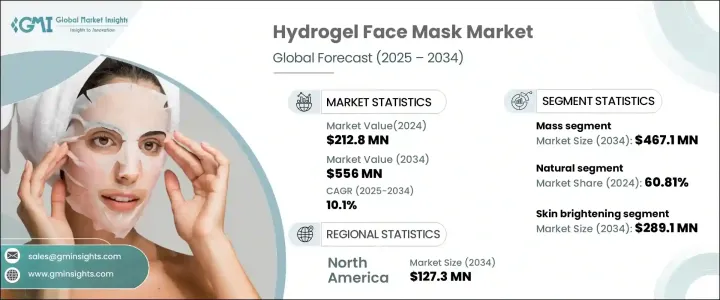
2024 年全球水凝胶面膜市场价值为 2.128 亿美元,预计到 2034 年将以 10.1% 的复合年增长率增长至 5.56 亿美元。这一增长得益于消费者对护肤日益增长的兴趣、不断升级的美容标准以及皮肤健康解决方案的创新。随着消费者越来越意识到皮肤补水和保养的重要性,对高级护肤产品的需求也持续增长。社群媒体影响者、皮肤科医生和线上美容社群在教育使用者持续护肤程序的好处方面发挥关键作用,尤其是那些提供保湿、皮肤修復和抗衰老等针对性护理的程序。因此,水凝胶面膜因其多功能优点和易于使用的特性而越来越受欢迎。消费者习惯的转变,尤其是年轻一代的消费者习惯的转变,极大地促进了这一上升趋势,因为他们寻求有效且有科学依据的解决方案来保持健康和容光焕发的肌肤。此外,这些面膜透过线上平台和零售店的便利购买,也提升了不同地区消费者的参与度。水凝胶技术的进步,加上可支配收入的提高和消费者对自我照顾的偏好,持续提升了产品的吸引力。各大公司也更加重视永续性和清洁标籤配方,使得这些面膜成为环保消费者的热门选择。
就产品类型而言,市场细分为大众和高端两大类别。大众细分市场在2024年占据市场主导地位,价值达1.738亿美元,预计2034年将达到4.671亿美元。大众水凝胶面膜因其价格实惠且效果显着,对价格敏感的消费者极具吸引力。这些产品专为解决干燥、细纹和肤色不均等常见皮肤问题而配製,适合广泛人群。它们在实体零售店和数位市场的广泛供应,对扩大其影响力发挥了关键作用。与迎合特定消费群体的高端替代品不同,大众水凝胶面膜因其功能性和易得性而广受欢迎,并在市场上占据了主导地位。
| 市场范围 | |
|---|---|
| 起始年份 | 2024 |
| 预测年份 | 2025-2034 |
| 起始值 | 2.128亿美元 |
| 预测值 | 5.56亿美元 |
| 复合年增长率 | 10.1% |
依来源分类,水凝胶面膜可分为天然和合成两大类。 2024年,天然成分占据市场主导地位,占60.81%,预计在整个预测期内仍将保持领先地位。人们越来越意识到使用植物性和永续护肤品的益处,这显着提升了天然水凝胶面膜的受欢迎程度。由于担心潜在的副作用,消费者越来越多地避免使用含有人工成分的产品。这种偏好体现在对含有植物萃取物、天然酵素和生物基聚合物的面膜的需求不断增长。人们对清洁美容和环保实践的重视,使得天然水凝胶面膜成为寻求更安全护肤方案人士的首选。
根据应用,市场可分为美白、抗衰老、抗痤疮和其他。美白细分市场在2024年占据了最大的市场份额,达到1.086亿美元,预计到2034年将达到2.891亿美元。随着消费者越来越追求能够均匀肤色、淡化色斑、恢復光泽的产品,美白细分市场将继续占据主导地位。所有年龄层和所有肤质的消费者都对美白产品的需求,源自于他们对健康亮泽肤色的渴望。这些面膜通常兼具保湿功效,增强了它们的吸引力和实用性。美白水凝胶面膜兼具美容和护理功效,已成为个人护理的必备品。
从区域来看,北美市场在2024年的市值为4,760万美元,预计到2034年将达到1.273亿美元。预计美国市场在预测期内的复合年增长率将达到10.5%。这一增长主要源于消费者偏好的转变、对多步骤护肤程序的兴趣日益浓厚以及创新产品的日益普及。强大的购买力、强大的线上零售基础设施以及对优质美容产品日益增长的兴趣,都促进了该地区市场的扩张。消费者更倾向于探索和投资新的护肤品形式,从而推动了水凝胶面膜在这一领域的流行。
产业主要参与者专注于创新、永续性和产品个人化,以满足多样化的消费者需求。从提供丰富的选择到透过併购和合作进军新市场,各大企业都在积极提升竞争优势。利用数位平台拓展业务,并针对特定区域设计客製化产品,也是在这个快速发展的市场中吸引和留住客户的关键策略。
目录
第一章:方法论与范围
第二章:执行摘要
第三章:行业洞察
- 产业生态系统分析
- 影响价值链的因素
- 利润率分析
- 中断
- 未来展望
- 製造商
- 经销商
- 零售商
- 川普政府关税分析
- 对贸易的影响
- 贸易量中断
- 报復措施
- 对产业的影响
- 供应方影响(原料)
- 主要材料价格波动
- 供应链重组
- 生产成本影响
- 需求面影响(售价)
- 价格传导至终端市场
- 市占率动态
- 消费者反应模式
- 供应方影响(原料)
- 受影响的主要公司
- 策略产业反应
- 供应链重组
- 定价和产品策略
- 政策参与
- 展望与未来考虑
- 对贸易的影响
- 利润率分析
- 成分分析
- 重要新闻和倡议
- 监管格局
- 对部队的影响
- 成长动力
- 消费者护肤意识不断增强
- 皮肤健康技术的进步
- 日益增长的护肤品行业
- 提高可及性和可负担性
- 产业陷阱与挑战
- 激烈的竞争
- 监理合规性
- 成长动力
- 成长潜力分析
- 消费者购买行为
- 人口趋势
- 影响购买决策的因素
- 消费者产品采用
- 首选配销通路
- 首选价格范围
- 波特的分析
- PESTEL分析
第四章:竞争格局
- 介绍
- 公司市占率分析
- 竞争定位矩阵
- 战略展望矩阵
第五章:市场估计与预测:依产品,2021-2034
- 主要趋势
- 大量的
- 优质的
第六章:市场估计与预测:依来源,2021-2034
- 主要趋势
- 自然的
- 合成的
第七章:市场估计与预测:按应用,2021-2034
- 主要趋势
- 亮肤
- 抗衰老
- 抗痤疮
- 其他的
第八章:市场估计与预测:按配销通路,2021-2034 年
- 主要趋势
- 离线
- 大型超市和超市
- 专卖店
- 药局和药局
- 在线的
- 其他的
第九章:市场估计与预测:按地区,2021-2034
- 主要趋势
- 北美洲
- 我们
- 加拿大
- 欧洲
- 英国
- 德国
- 法国
- 义大利
- 西班牙
- 俄罗斯
- 亚太地区
- 中国
- 印度
- 日本
- 韩国
- 澳洲
- 拉丁美洲
- 巴西
- 墨西哥
- MEA
- 南非
- 沙乌地阿拉伯
- 阿联酋
第十章:公司简介
- Amorepacific Corporation
- Boscia
- Dr. Jart+
- Estee Lauder
- Garnier
- Hada Labo
- Johnson & Johnson
- Lancôme
- L'Oreal
- MEDIHEAL
- Peter Thomas Roth
- Procter & Gamble
- Shiseido Company, Limited
- TONYMOLY
- Unilever
The Global Hydrogel Face Mask Market was valued at USD 212.8 million in 2024 and is estimated to grow at a CAGR of 10.1% to reach USD 556 million by 2034. This growth is driven by increasing consumer interest in skincare, evolving beauty standards, and innovation in skin health solutions. As consumers become more informed about the importance of skin hydration and maintenance, the demand for advanced skincare products continues to rise. Social media influencers, dermatologists, and online beauty communities play a key role in educating users on the benefits of consistent skincare routines, especially those that offer targeted treatments like hydration, skin repair, and anti-aging. As a result, hydrogel face masks are gaining popularity for their multifunctional benefits and user-friendly application. The shift in consumer habits, particularly among younger generations, is significantly contributing to this upward trend, as they seek out effective and science-backed solutions to maintain healthy and radiant skin. Moreover, easy accessibility of these masks through both online platforms and retail outlets has boosted consumer engagement across various regions. Advancements in hydrogel technology, coupled with rising disposable income and preference for self-care, continue to enhance product appeal. Companies are also prioritizing sustainability and clean-label formulations, making these masks an attractive choice for environmentally conscious buyers.
In terms of product type, the market is segmented into mass and premium categories. The mass segment led the market in 2024 with a value of USD 173.8 million and is estimated to reach USD 467.1 million by 2034. Mass hydrogel face masks appeal strongly to price-sensitive consumers due to their affordability and ability to deliver effective results. These products are specifically formulated to address common skin concerns such as dryness, fine lines, and uneven skin tone, making them suitable for a wide audience. Their widespread availability across physical retail stores and digital marketplaces has played a crucial role in amplifying their reach. Unlike premium alternatives that cater to specific consumer groups, mass hydrogel face masks enjoy broad acceptance and have carved out a strong position in the market due to their functionality and accessibility.
| Market Scope | |
|---|---|
| Start Year | 2024 |
| Forecast Year | 2025-2034 |
| Start Value | $212.8 Million |
| Forecast Value | $556 Million |
| CAGR | 10.1% |
When classified by source, hydrogel face masks fall into natural and synthetic categories. The natural segment dominated the market in 2024, accounting for a 60.81% share, and is expected to maintain its lead throughout the forecast period. Growing awareness around the benefits of using plant-based and sustainable skincare has significantly boosted the popularity of natural hydrogel face masks. Consumers are increasingly avoiding products with artificial ingredients due to concerns about potential side effects. This preference is reflected in the rising demand for masks formulated with botanical extracts, natural enzymes, and bio-based polymers. The emphasis on clean beauty and environmentally friendly practices has made natural hydrogel face masks a preferred choice for individuals seeking safer skincare options.
Based on application, the market is categorized into skin brightening, anti-aging, anti-acne, and others. The skin brightening segment held the largest market share of USD 108.6 million in 2024 and is forecasted to reach USD 289.1 million by 2034. This segment continues to dominate as consumers increasingly look for products that promote even skin tone, minimize dark spots, and restore radiance. The demand for skin brightening solutions spans across all age groups and skin types, driven by the desire for a healthy and luminous complexion. These masks often double as hydrating treatments, which enhances their appeal and utility. By offering a combination of cosmetic and therapeutic benefits, skin brightening hydrogel masks have become a staple in personal care routines.
Regionally, North America represented a market value of USD 47.6 million in 2024 and is projected to reach USD 127.3 million by 2034. The U.S. market in particular is anticipated to grow at a CAGR of 10.5% during the forecast period. This growth is fueled by changing consumer preferences, a heightened interest in multi-step skincare routines, and increasing adoption of innovative products. The high purchasing power, robust online retail infrastructure, and growing interest in quality beauty products all contribute to market expansion in the region. Consumers are more inclined to explore and invest in new skincare formats, boosting the popularity of hydrogel face masks in this landscape.
Key players in the industry are focusing on innovation, sustainability, and product personalization to meet diverse consumer needs. From offering a wide array of options to entering new markets through mergers and partnerships, companies are actively enhancing their competitive edge. Expanding their presence through digital platforms and designing products tailored for specific regions are also critical strategies to attract and retain customers in this rapidly evolving market.
Table of Contents
Chapter 1 Methodology & Scope
- 1.1 Research design
- 1.1.1 Research approach
- 1.1.2 Data collection methods
- 1.2 Base estimates and calculations
- 1.2.1 Base year calculation
- 1.2.2 Key trends for market estimates
- 1.3 Forecast model
- 1.4 Primary research & validation
- 1.4.1 Primary sources
- 1.4.2 Data mining sources
- 1.5 Market definitions
Chapter 2 Executive Summary
- 2.1 Industry synopsis, 2021 - 2034
Chapter 3 Industry Insights
- 3.1 Industry ecosystem analysis
- 3.1.1 Factor affecting the value chain
- 3.1.2 Profit margin analysis
- 3.1.3 Disruptions
- 3.1.4 Future outlook
- 3.1.5 Manufacturers
- 3.1.6 Distributors
- 3.1.7 Retailers
- 3.2 Trump administration tariffs analysis
- 3.2.1 Impact on trade
- 3.2.1.1 Trade volume disruptions
- 3.2.1.2 Retaliatory measures
- 3.2.2 Impact on the industry
- 3.2.2.1 Supply-side impact (raw materials)
- 3.2.2.1.1 Price volatility in key materials
- 3.2.2.1.2 Supply chain restructuring
- 3.2.2.1.3 Production cost implications
- 3.2.2.2 Demand-side impact (selling price)
- 3.2.2.3 Price transmission to end markets
- 3.2.2.4 Market share dynamics
- 3.2.2.5 Consumer response patterns
- 3.2.2.1 Supply-side impact (raw materials)
- 3.2.3 Key companies impacted
- 3.2.4 Strategic industry responses
- 3.2.4.1 Supply chain reconfiguration
- 3.2.4.2 Pricing and product strategies
- 3.2.4.3 Policy engagement
- 3.2.5 Outlook and future considerations
- 3.2.1 Impact on trade
- 3.3 Profit margin analysis
- 3.4 Ingredient analysis
- 3.5 Key news & initiatives
- 3.6 Regulatory landscape
- 3.7 Impact on forces
- 3.7.1 Growth drivers
- 3.7.1.1 Growing consumer awareness in skin care
- 3.7.1.2 Advancements in skin health technology
- 3.7.1.3 Growing skincare products industry
- 3.7.1.4 Increasing accessibility and affordability
- 3.7.2 Industry pitfalls & challenges
- 3.7.2.1 Intense competition
- 3.7.2.2 Regulatory compliance
- 3.7.1 Growth drivers
- 3.8 Growth potential analysis
- 3.9 Consumer buying behavior
- 3.9.1 Demographic trends
- 3.9.2 Factors affecting buying decisions
- 3.9.3 Consumer product adoption
- 3.9.4 Preferred distribution channel
- 3.9.5 Preferred price range
- 3.10 Porter's analysis
- 3.11 PESTEL analysis
Chapter 4 Competitive Landscape, 2024
- 4.1 Introduction
- 4.2 Company market share analysis
- 4.3 Competitive positioning matrix
- 4.4 Strategic outlook matrix
Chapter 5 Market Estimates & Forecast, By Product, 2021-2034 ($ Mn, Units)
- 5.1 Key trends
- 5.2 Mass
- 5.3 Premium
Chapter 6 Market Estimates & Forecast, By Source, 2021-2034 ($ Mn, Units)
- 6.1 Key trends
- 6.2 Natural
- 6.3 Synthetic
Chapter 7 Market Estimates & Forecast, By Application, 2021-2034 ($ Mn, Units)
- 7.1 Key trends
- 7.2 Skin brightening
- 7.3 Anti-aging
- 7.4 Anti-acne
- 7.5 Others
Chapter 8 Market Estimates & Forecast, By Distribution Channel, 2021-2034 ($ Mn, Units)
- 8.1 Key trends
- 8.2 Offline
- 8.2.1 Hypermarkets & supermarkets
- 8.2.2 Specialty stores
- 8.2.3 Pharmacy & drug stores
- 8.3 Online
- 8.4 Others
Chapter 9 Market Estimates & Forecast, By Region, 2021-2034 ($ Mn, Units)
- 9.1 Key trends
- 9.2 North America
- 9.2.1 U.S.
- 9.2.2 Canada
- 9.3 Europe
- 9.3.1 UK
- 9.3.2 Germany
- 9.3.3 France
- 9.3.4 Italy
- 9.3.5 Spain
- 9.3.6 Russia
- 9.4 Asia Pacific
- 9.4.1 China
- 9.4.2 India
- 9.4.3 Japan
- 9.4.4 South Korea
- 9.4.5 Australia
- 9.5 Latin America
- 9.5.1 Brazil
- 9.5.2 Mexico
- 9.6 MEA
- 9.6.1 South Africa
- 9.6.2 Saudi Arabia
- 9.6.3 UAE
Chapter 10 Company Profiles
- 10.1 Amorepacific Corporation
- 10.2 Boscia
- 10.3 Dr. Jart+
- 10.4 Estee Lauder
- 10.5 Garnier
- 10.6 Hada Labo
- 10.7 Johnson & Johnson
- 10.8 Lancome
- 10.9 L'Oreal
- 10.10 MEDIHEAL
- 10.11 Peter Thomas Roth
- 10.12 Procter & Gamble
- 10.13 Shiseido Company, Limited
- 10.14 TONYMOLY
- 10.15 Unilever
 LED灯面膜市场 - 全球产业规模、份额、趋势、竞争格局、机会及预测(按产品类型、应用、最终用户、分销管道、地区和竞争情况划分,2021-2031年)全球去角质面膜市场-按类型、最终用户、分销管道、地区和竞争格局分類的行业规模、份额、趋势、机会和预测(2021-2031年)水凝胶面膜市场-全球产业规模、份额、趋势、机会与预测:按类型、肤质、应用、定价、分销管道、地区和竞争格局划分,2021-2031年
 可携式LED光疗面膜市场:依产品类型、波长、应用、最终用户和分销管道划分-2026-2032年全球预测银纤维口罩市场:按口罩类型、分销管道、最终用户和应用划分-2026-2032年全球预测全球夜间面膜市场-产业规模、份额、趋势、机会及预测,依产品、销售通路(直销、线上、大型超市/超市、专卖店、其他)、地区及竞争格局划分,2021-2031年预测
 LED光疗面膜市场规模、份额、成长分析(按类型、应用、治疗方法、分销管道和地区划分)-2026-2033年产业预测
 水凝胶面膜市场规模、份额及成长分析(按产品、应用、肤质、通路和地区划分)-产业预测,2026-2033年
 口罩市场规模、份额及成长分析(依性质、产品防护、类型、材料类型、通路、最终用户及地区划分)-2026-2033年产业预测
 口罩市场按类型、材料、应用、分销管道和地区划分