


 |
市场调查报告书
商品编码
1750618
电脑视觉市场中的人工智慧机会、成长动力、产业趋势分析及 2025 - 2034 年预测AI in Computer Vision Market Opportunity, Growth Drivers, Industry Trend Analysis, and Forecast 2025 - 2034 |
||||||
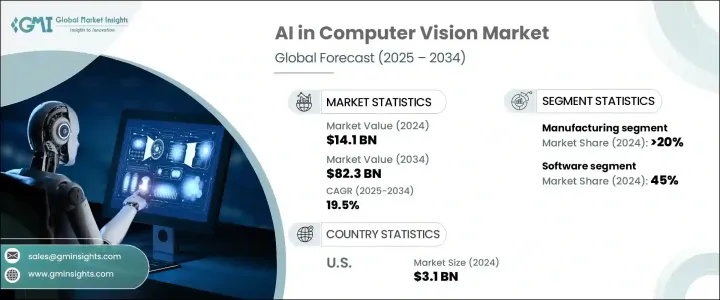
2024 年全球电脑视觉人工智慧市场价值为 141 亿美元,预计到 2034 年将以 19.5% 的复合年增长率成长,达到 823 亿美元,这得益于深度学习技术的进步,尤其是卷积神经网路 (CNN) 和 Transformer 模型,它们提高了视觉资料处理的准确性和效率。这些发展使机器能够解读复杂的视觉讯息,促进物件侦测、分类和识别等应用。随着人工智慧系统越来越擅长处理多样化和复杂的视觉资料,它们的效用遍及医疗保健、汽车、零售和製造等各个领域。来自监视摄影机、无人机和智慧型手机等来源的视觉资料量不断增加,迫切需要开发自动分析工具。
人工智慧驱动的电脑视觉系统可以即时处理和分析海量影像和视讯资料集,提供对安防和医疗等行业至关重要的及时准确的洞察。这些系统能够侦测异常、辨识人脸、辨识物体并监控活动,其速度和精确度远超传统方法。在安防领域,这可以实现主动威胁检测和自动化监控;在医疗领域,它可以透过医学影像促进早期诊断,支援手术辅助,并增强病患监护。随着这些技术的不断发展,它们在提升各种应用的营运效率、安全性和决策能力方面发挥着越来越重要的作用。
| 市场范围 | |
|---|---|
| 起始年份 | 2024 |
| 预测年份 | 2025-2034 |
| 起始值 | 141亿美元 |
| 预测值 | 823亿美元 |
| 复合年增长率 | 19.5% |
2024年,製造业占了20%的市场份额,价值30亿美元。在製造业中整合人工智慧驱动的视觉系统有助于实现自动化品质控制,减少人为错误并确保产品标准的一致性。这些系统透过即时识别缺陷和异常来提高营运效率,从而优化生产流程并减少浪费。工业4.0概念的采用,将人工智慧、物联网(IoT)和机器人技术结合,正在加速电脑视觉技术在製造环境中的部署。
软体领域在2024年引领市场,占45%的份额。软体解决方案是电脑视觉领域人工智慧不可或缺的一部分,能够实现脸部辨识、物件侦测和影像分类等复杂任务。这些软体平台高度可客製化,能够适应特定行业需求,包括医学影像、自动驾驶汽车导航和零售分析。人工智慧软体的灵活性和可扩展性使其成为寻求提升技术能力和实现更高投资回报的公司的首选投资。
2024年,北美电脑视觉市场人工智慧 (AI) 产值达31亿美元,这得益于领先的科技公司、政府和私营部门的大量投资以及强大的研发现状系统。麻省理工学院 (MIT) 和史丹佛大学 (Stanford) 等大学以及企业研究实验室为人工智慧技术的发展做出了贡献。美国的汽车、医疗保健和零售等行业是人工智慧电脑视觉工具的早期采用者,并利用这些工具实现自动化、进阶监控、诊断和物流营运。
电脑视觉产业人工智慧的主要参与者包括亚马逊、NVIDIA、IBM、微软、英特尔、Google、AMD、康耐视、Teledyne Technologies 和 Basler AG。这些公司在开发和部署人工智慧驱动的视觉系统方面处于领先地位,涵盖各个领域,推动创新并扩大市场覆盖范围。为了巩固市场地位,电脑视觉产业的人工智慧公司正在采取多项关键策略,包括投资研发以增强人工智慧演算法和硬体的功能,建立策略合作伙伴关係和合作关係以扩展其技术专长和市场覆盖范围,以及专注于产品创新以满足不同产业不断变化的需求。
目录
第一章:方法论与范围
第二章:执行摘要
第三章:行业洞察
- 产业生态系统分析
- 供应商格局
- 硬体提供者
- 软体供应商
- 服务提供者
- 技术提供者
- 最终用途
- 利润率分析
- 川普政府关税的影响
- 对贸易的影响
- 贸易量中断
- 报復措施
- 对产业的影响
- 供应方影响(原料)
- 主要材料价格波动
- 供应链重组
- 生产成本影响
- 需求面影响(售价)
- 价格传导至终端市场
- 市占率动态
- 消费者反应模式
- 供应方影响(原料)
- 受影响的主要公司
- 策略产业反应
- 供应链重组
- 定价和产品策略
- 政策参与
- 展望与未来考虑
- 对贸易的影响
- 技术与创新格局
- 机器人流程自动化
- AI优化硬体
- 深度学习平台
- 专利分析
- 重要新闻和倡议
- 电脑视觉中人工智慧的用例
- 监管格局
- 衝击力
- 成长动力
- 深度学习和人工智慧演算法的快速进步
- 视觉资料量的增加
- 对自动化和品质控制的需求日益增长
- 边缘运算整合度的提高
- 产业陷阱与挑战
- 资料隐私和安全问题
- 与遗留系统集成
- 成长动力
- 成长潜力分析
- 波特的分析
- PESTEL分析
第四章:竞争格局
- 介绍
- 公司市占率分析
- 竞争定位矩阵
- 战略展望矩阵
第五章:市场估计与预测:按组件,2021 - 2034 年
- 主要趋势
- 硬体
- 相机和影像感测器
- 处理器(GPU、TPU、VPU)
- 整合系统
- 边缘运算设备
- 软体
- 开发框架和工具
- 视觉 API 和 SDK
- 预训练模型
- 客製化视觉解决方案
- 基于云端的视觉服务
- 服务
- 实施与整合
- 培训和支持
- 咨询
- 维护和升级
第六章:市场估计与预测:按应用,2021 - 2034 年
- 主要趋势
- 预测性维护
- 品质保证和检验
- 定位与引导
- 识别和测量
- 其他的
第七章:市场估计与预测:依最终用途,2021 - 2034 年
- 主要趋势
- 汽车和运输
- 製造业
- 政府
- 零售
- 金融服务业
- 卫生保健
- 其他的
第八章:市场估计与预测:依功能,2021 - 2034 年
- 主要趋势
- 训练
- 推论
第九章:市场估计与预测:依技术分类,2021 - 2034 年
- 主要趋势
- 机器学习
- 通用人工智慧
第十章:市场估计与预测:按地区,2021 - 2034 年
- 主要趋势
- 北美洲
- 我们
- 加拿大
- 欧洲
- 英国
- 德国
- 法国
- 义大利
- 西班牙
- 俄罗斯
- 北欧人
- 亚太地区
- 中国
- 印度
- 日本
- 澳洲
- 韩国
- 东南亚
- 拉丁美洲
- 巴西
- 墨西哥
- 阿根廷
- MEA
- 阿联酋
- 南非
- 沙乌地阿拉伯
第 11 章:公司简介
- Advanced Micro Device
- Amazon
- Basler
- Clarifai
- Cognex
- Deepomatic
- Graphcore
- Hailo
- IBM
- Intel
- Keyence
- Microsoft
- NVIDIA
- Omron
- Qualcomm
- Sick
- Sony
- Teledyne Technologies
- Texas Instruments
The Global AI in Computer Vision Market was valued at USD 14.1 billion in 2024 and is estimated to grow at a CAGR of 19.5% to reach USD 82.3 billion by 2034, driven by the advancements in deep learning technologies, particularly Convolutional Neural Networks (CNNs) and transformer models, have enhanced the accuracy and efficiency of visual data processing. These developments enable machines to interpret complex visual information, facilitating applications such as object detection, classification, and recognition. As AI systems become more adept at handling diverse and intricate visual data, their utility spans various sectors, including healthcare, automotive, retail, and manufacturing. The increasing volume of visual data from sources like surveillance cameras, drones, and smartphones necessitates the development of automated analysis tools.
AI-powered computer vision systems can process and analyze large image and video datasets in real time, providing timely and accurate insights crucial for industries like security and healthcare. These systems can detect anomalies, recognizing faces, identifying objects, and monitoring activities with a level of speed and precision that far exceeds traditional methods. In security, this enables proactive threat detection and automated surveillance, while in healthcare, it facilitates early diagnosis through medical imaging, supports surgical assistance, and enhances patient monitoring. As these technologies continue to evolve, they are playing an increasingly integral role in improving operational efficiency, safety, and decision-making across a wide range of applications.
| Market Scope | |
|---|---|
| Start Year | 2024 |
| Forecast Year | 2025-2034 |
| Start Value | $14.1 Billion |
| Forecast Value | $82.3 Billion |
| CAGR | 19.5% |
In 2024, the manufacturing sector held a 20% share, valued at USD 3 billion. Integrating AI-driven vision systems in manufacturing facilitates automated quality control, reducing human error and ensuring consistent product standards. These systems enhance operational efficiency by identifying defects and anomalies in real time, leading to optimized production processes and reduced waste. The adoption of Industry 4.0 concepts, which combine AI, the Internet of Things (IoT), and robotics, is accelerating the deployment of computer vision technologies in manufacturing environments.
The software segment led the market in 2024, capturing 45% share. Software solutions are integral to AI in computer vision, enabling complex tasks such as facial recognition, object detection, and image classification. These software platforms are highly customizable, allowing adaptation to specific industry needs, including medical imaging, autonomous vehicle navigation, and retail analytics. The flexibility and scalability of AI software make it a preferred investment for companies seeking to enhance their technological capabilities and achieve a higher return on investment.
North America AI in Computer Vision Market generated USD 3.1 billion in 2024, attributed to the presence of leading technology companies, substantial government and private sector investments, and a robust research and development ecosystem. Institutions such as MIT and Stanford, along with corporate research labs, contribute to developing AI technologies. Industries in the U.S., including automotive, healthcare, and retail, are early adopters of AI-powered computer vision tools, leveraging them for automation, advanced surveillance, diagnostics, and logistical operations.
Key players in the AI in Computer Vision Industry include Amazon, NVIDIA, IBM, Microsoft, Intel, Google, Advanced Micro Devices Inc., Cognex Corporation, Teledyne Technologies, and Basler AG. These companies are at the forefront of developing and deploying AI-driven vision systems across various sectors, driving innovation and expanding the market's reach. To strengthen their market position, companies in the AI in computer vision industry are adopting several key strategies. These include investing in research and development to enhance the capabilities of AI algorithms and hardware, forming strategic partnerships and collaborations to expand their technological expertise and market reach, and focusing on product innovation to meet the evolving needs of different industries.
Table of Contents
Chapter 1 Methodology & Scope
- 1.1 Research design
- 1.1.1 Research approach
- 1.1.2 Data collection methods
- 1.2 Base estimates & calculations
- 1.2.1 Base year calculation
- 1.2.2 Key trends for market estimation
- 1.3 Forecast model
- 1.4 Primary research and validation
- 1.4.1 Primary sources
- 1.4.2 Data mining sources
- 1.5 Market scope & definition
Chapter 2 Executive Summary
- 2.1 Industry 3600 synopsis, 2021 - 2034
Chapter 3 Industry Insights
- 3.1 Industry ecosystem analysis
- 3.2 Supplier landscape
- 3.2.1 Hardware providers
- 3.2.2 Software providers
- 3.2.3 Service providers
- 3.2.4 Technology providers
- 3.2.5 End use
- 3.3 Profit margin analysis
- 3.4 Impact of Trump administration tariffs
- 3.4.1 Impact on trade
- 3.4.1.1 Trade volume disruptions
- 3.4.1.2 Retaliatory measures
- 3.4.2 Impact on industry
- 3.4.2.1 Supply-side impact (raw materials)
- 3.4.2.1.1 Price volatility in key materials
- 3.4.2.1.2 Supply chain restructuring
- 3.4.2.1.3 Production cost implications
- 3.4.2.2 Demand-side impact (selling price)
- 3.4.2.2.1 Price transmission to end markets
- 3.4.2.2.2 Market share dynamics
- 3.4.2.2.3 Consumer response patterns
- 3.4.2.1 Supply-side impact (raw materials)
- 3.4.3 Key companies impacted
- 3.4.4 Strategic industry responses
- 3.4.4.1 Supply chain reconfiguration
- 3.4.4.2 Pricing and product strategies
- 3.4.4.3 Policy engagement
- 3.4.5 Outlook & future considerations
- 3.4.1 Impact on trade
- 3.5 Technology & innovation landscape
- 3.5.1 Robotic process automation
- 3.5.2 AI optimized hardware
- 3.5.3 Deep learning platform
- 3.6 Patent analysis
- 3.7 Key news & initiatives
- 3.8 Use cases of AI in computer vision
- 3.9 Regulatory landscape
- 3.10 Impact forces
- 3.10.1 Growth drivers
- 3.10.1.1 Rapid advancements in deep learning & AI algorithms
- 3.10.1.2 Rise in amount of visual data
- 3.10.1.3 Growing need for automation and quality control
- 3.10.1.4 Increase in the edge computing integration
- 3.10.2 Industry pitfalls & challenges
- 3.10.2.1 Data privacy and security concerns
- 3.10.2.2 Integration with legacy systems
- 3.10.1 Growth drivers
- 3.11 Growth potential analysis
- 3.12 Porter's analysis
- 3.13 PESTEL analysis
Chapter 4 Competitive Landscape, 2024
- 4.1 Introduction
- 4.2 Company market share analysis
- 4.3 Competitive positioning matrix
- 4.4 Strategic outlook matrix
Chapter 5 Market Estimates & Forecast, By Component, 2021 - 2034 ($Bn, Units)
- 5.1 Key trends
- 5.2 Hardware
- 5.2.1 Cameras and image sensors
- 5.2.2 Processors (GPUs, TPUs, VPUs)
- 5.2.3 Integrated systems
- 5.2.4 Edge computing devices
- 5.3 Software
- 5.3.1 Development frameworks and tools
- 5.3.2 Vision APIs and SDKs
- 5.3.3 Pre-trained models
- 5.3.4 Custom vision solutions
- 5.3.5 Cloud-based vision services
- 5.4 Services
- 5.4.1 Implementation and integration
- 5.4.2 Training and support
- 5.4.3 Consulting
- 5.4.4 Maintenance and upgrades
Chapter 6 Market Estimates & Forecast, By Application, 2021 - 2034 ($Bn)
- 6.1 Key trends
- 6.2 Predictive maintenance
- 6.3 Quality assurance and inspection
- 6.4 Positioning and guidance
- 6.5 Identification and measurement
- 6.6 Others
Chapter 7 Market Estimates & Forecast, By End Use, 2021 - 2034 ($Bn)
- 7.1 Key trends
- 7.2 Automotive and transportation
- 7.3 Manufacturing
- 7.4 Government
- 7.5 Retail
- 7.6 BFSI
- 7.7 Healthcare
- 7.8 Others
Chapter 8 Market Estimates & Forecast, By Function, 2021 - 2034 ($Bn)
- 8.1 Key trends
- 8.2 Training
- 8.3 Inferences
Chapter 9 Market Estimates & Forecast, By Technology, 2021 - 2034 ($Bn)
- 9.1 Key trends
- 9.2 ML
- 9.3 Gen AI
Chapter 10 Market Estimates & Forecast, By Region, 2021 - 2034 ($Bn)
- 10.1 Key trends
- 10.2 North America
- 10.2.1 U.S.
- 10.2.2 Canada
- 10.3 Europe
- 10.3.1 UK
- 10.3.2 Germany
- 10.3.3 France
- 10.3.4 Italy
- 10.3.5 Spain
- 10.3.6 Russia
- 10.3.7 Nordics
- 10.4 Asia Pacific
- 10.4.1 China
- 10.4.2 India
- 10.4.3 Japan
- 10.4.4 Australia
- 10.4.5 South Korea
- 10.4.6 Southeast Asia
- 10.5 Latin America
- 10.5.1 Brazil
- 10.5.2 Mexico
- 10.5.3 Argentina
- 10.6 MEA
- 10.6.1 UAE
- 10.6.2 South Africa
- 10.6.3 Saudi Arabia
Chapter 11 Company Profiles
- 11.1 Advanced Micro Device
- 11.2 Amazon
- 11.3 Basler
- 11.4 Clarifai
- 11.5 Cognex
- 11.6 Deepomatic
- 11.7 Google
- 11.8 Graphcore
- 11.9 Hailo
- 11.10 IBM
- 11.11 Intel
- 11.12 Keyence
- 11.13 Microsoft
- 11.14 NVIDIA
- 11.15 Omron
- 11.16 Qualcomm
- 11.17 Sick
- 11.18 Sony
- 11.19 Teledyne Technologies
- 11.20 Texas Instruments
 2026年全球人工智慧电脑视觉市场报告2026年全球人工智慧(AI)音乐相似度搜寻市场报告
 头部和眼动追踪软体市场:按追踪类型、组件、部署模式、应用程式和最终用户划分,全球预测(2026-2032年)
 电脑视觉人工智慧市场分析及预测(至2035年):按类型、产品、技术、组件、应用、最终用户、流程、部署和解决方案划分全球可视化人数计算摄影机市场:按技术、部署模式、外形规格、精度等级和应用划分,2026-2032年预测嵌入式视觉板级相机市场:按技术、分销管道和应用划分 - 全球预测(2026-2032 年)
 电脑视觉人工智慧 (AI) 市场规模、份额和成长分析(按机器学习模型、产品、功能、技术、应用、垂直产业和地区划分)—产业预测 (2026-2033)电脑视觉市场中的人工智慧(按组件、技术、功能、应用、部署模式和最终用途行业)—全球预测,2025-2032
 电脑视觉AI的全球市场(~2035年):各元件类型,各功能,机器学习模式,各部署,各应用领域,各产品,各终端用户,不同企业规模,各主要地区,产业趋势,预测
 2025-2029年全球AI车辆检查系统市场