


 |
市场调查报告书
商品编码
1755205
整合视觉增强系统市场机会、成长动力、产业趋势分析及 2025 - 2034 年预测Integrated Visual Augmentation System Market Opportunity, Growth Drivers, Industry Trend Analysis, and Forecast 2025 - 2034 |
||||||
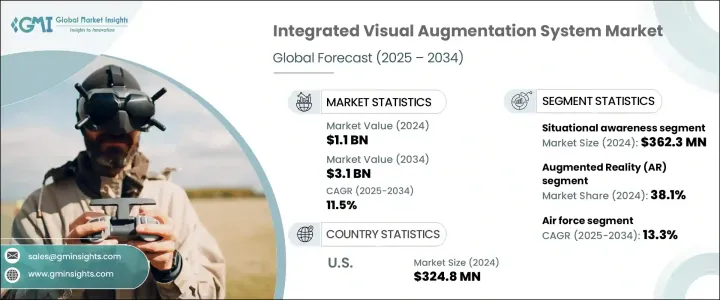
2024年,全球整合视觉增强系统市场规模达11亿美元,预计2034年将以11.5%的复合年增长率成长,达到31亿美元。影响这一发展轨蹟的一个主要因素是对中国进口产品征收的关税,这推高了光学感测器和微电子装置等关键零件的采购成本。这些贸易措施促使许多国防供应商修改其采购策略,转向其他供应商并增加国内製造,以控製成本并确保专案持续有效。
全球各地的武装部队正在加紧现代化建设,旨在提升士兵在不断变化的战场上的表现、敏捷性和生存力。 IVAS 解决方案在这一转变中发挥核心作用,它整合了即时导航、通讯、热成像和战术感知等先进功能。军事组织正在采用这些系统来应对新兴威胁,尤其是在城市战争日益盛行、全球衝突加剧的背景下。穿戴式科技的整合有助于简化决策流程并增强指挥控制流程。跨职能国防计画进一步推动了对高科技、多功能设备的需求,以满足日益复杂的现代作战场景的需求。
| 市场范围 | |
|---|---|
| 起始年份 | 2024 |
| 预测年份 | 2025-2034 |
| 起始值 | 11亿美元 |
| 预测值 | 31亿美元 |
| 复合年增长率 | 11.5% |
就产品类型而言,头盔显示器市场在2023年创造了4.936亿美元的收入。这类系统因其能够直接在士兵视野范围内提供关键任务资料,从而提高反应时间、机动性和环境感知能力,而日益受到欢迎。随着武装部队致力于优化即时战术执行和态势指挥,对头盔显示器的需求也不断增长。
从技术角度来看,扩增实境 (AR) 预计将在 2024 年占据整合视觉增强系统市场 38.1% 的份额。该技术透过即时迭加关键视觉资料来增强战场功能,显着提升导航、威胁识别和作战协调能力。作为一项核心赋能技术,它对于当前和未来专注于沉浸式、数据丰富的作战支援系统的军事战略至关重要。
2024年,美国整合视觉增强系统市场规模达3.248亿美元。国防和航太领域的积极投资推动了美国在该领域的成长。对系统升级的持续重视以及联邦政府对现代军事计画的投入,加剧了对整合视觉增强功能的需求,这有助于增强任务准备度和整体作战效率。
影响全球整合视觉增强系统市场竞争格局的关键参与者包括 Varjo、L3Harris Technologies, Inc. 和 Elbit Systems Ltd.。 IVAS 市场的领导企业正在透过策略性投资、产品创新和供应链重组等多种方式来提升竞争优势。为了因应不断变化的进口形势,各公司一直在实现供应商基础多元化,并加强国内零件采购。许多公司将研发工作放在首位,以增强 AR 整合度、光学性能和系统耐用性。这些公司正与军事现代化目标紧密结合,客製化解决方案以满足战场特定需求,包括紧凑设计、无缝通讯模组和即时资料迭加。建立战略国防伙伴关係和参与政府主导的技术计划也是扩大市场范围和获得长期合约的关键策略。
目录
第一章:方法论与范围
第二章:执行摘要
第三章:行业洞察
- 产业生态系统分析
- 影响价值链的因素
- 利润率分析
- 中断
- 未来展望
- 製造商
- 经销商
- 川普政府关税分析
- 对贸易的影响
- 贸易量中断
- 报復措施
- 对产业的影响
- 供应方影响(原料)
- 主要材料价格波动
- 供应链重组
- 生产成本影响
- 需求面影响(售价)
- 价格传导至终端市场
- 市占率动态
- 消费者反应模式
- 供应方影响(原料)
- 受影响的主要公司
- 策略产业反应
- 供应链重组
- 定价和产品策略
- 政策参与
- 展望与未来考虑
- 对贸易的影响
- 供应商格局
- 利润率分析
- 重要新闻和倡议
- 监管格局
- 衝击力
- 成长动力
- 军事现代化计划不断推进
- 扩增实境 (AR) 与人工智慧的融合
- 要求提高士兵的安全和表现
- 政府支持资金和合约
- 全球安全威胁与不对称战争不断上升
- 产业陷阱与挑战
- 开发和采购成本高
- 操作和技术可靠性问题
- 成长动力
- 成长潜力分析
- 波特的分析
- PESTEL分析
第四章:竞争格局
- 介绍
- 公司市占率分析
- 竞争定位矩阵
- 战略展望矩阵
第五章:市场估计与预测:按产品,2021-2034
- 主要趋势
- 头盔显示器
- 夜视装置
第六章:市场估计与预测:依技术,2021-2034 年
- 主要趋势
- 扩增实境(AR)
- 混合实境(MR)
- 虚拟实境(VR)
- 热成像和微光成像
- 其他的
第七章:市场估计与预测:按应用,2021-2034
- 主要趋势
- 态势感知
- 导航和地图绘製
- 训练和模拟
- 目标获取和参与
- 其他的
第八章:市场估计与预测:依最终用途,2021-2034
- 主要趋势
- 空军
- 军队
- 海军
第九章:市场估计与预测:按地区,2021-2034
- 主要趋势
- 北美洲
- 我们
- 加拿大
- 欧洲
- 英国
- 德国
- 法国
- 义大利
- 西班牙
- 俄罗斯
- 亚太地区
- 中国
- 印度
- 日本
- 韩国
- 澳洲
- 拉丁美洲
- 巴西
- 墨西哥
- MEA
- 南非
- 沙乌地阿拉伯
- 阿联酋
第十章:公司简介
- Ajnalens
- Anduril
- Elbit Systems Ltd
- L3Harris Technologies, Inc.
- Lockheed Martin
- Optex Systems
- Varjo
- VirTra, Inc.
- Vrgineers, Inc.
- Vuzix Corporation
The Global Integrated Visual Augmentation System Market was valued at USD 1.1 billion in 2024 and is estimated to grow at a CAGR of 11.5% to reach USD 3.1 billion by 2034. A major factor influencing this trajectory is the impact of tariffs imposed on Chinese imports, which have driven up procurement costs for critical components like optical sensors and microelectronics. These trade measures have prompted many defense suppliers to revise their sourcing strategies, turning to alternative vendors and increasing domestic manufacturing to manage costs and ensure continued program functionality.
Worldwide, armed forces are ramping up modernization efforts aimed at enhancing soldier performance, agility, and survivability on evolving battlefields. IVAS solutions play a central role in this shift, integrating advanced capabilities such as real-time navigation, communication, thermal imaging, and tactical awareness. Military organizations are adopting these systems to stay ahead of emerging threats, particularly as urban warfare becomes more prevalent and global conflicts intensify. The integration of wearable tech is helping to streamline decision-making and bolster command-and-control processes. Cross-functional defense programs are further driving demand for high-tech, multifunctional devices that meet the increasing complexity of modern combat scenarios.
| Market Scope | |
|---|---|
| Start Year | 2024 |
| Forecast Year | 2025-2034 |
| Start Value | $1.1 Billion |
| Forecast Value | $3.1 Billion |
| CAGR | 11.5% |
In terms of product types, the helmet-mounted display segment generated USD 493.6 million in 2023. These systems are gaining popularity due to their ability to deliver mission-critical data directly within a soldier's field of view, improving reaction time, mobility, and environmental awareness. Demand is on the rise as armed forces aim to optimize real-time tactical execution and situational command.
By technology, Augmented Reality is expected to hold a 38.1% share of the integrated visual augmentation system market in 2024. This technology enhances battlefield functionality by overlaying essential visual data in real-time, significantly improving navigation, threat identification, and operational coordination. Its role as a core enabling technology makes it vital for current and future military strategies focused on immersive, data-rich combat support systems.
United States Integrated Visual Augmentation System Market reached USD 324.8 million in 2024. The country's growth in this sector is being fueled by aggressive investments from both the defense and aerospace sectors. Continued emphasis on system upgrades and federal spending on modern military initiatives are intensifying the need for integrated visual augmentation capabilities, helping to reinforce mission readiness and overall operational efficiency.
Key players influencing the competitive landscape of the Global Integrated Visual Augmentation System Market include Varjo, L3Harris Technologies, Inc., and Elbit Systems Ltd. Leading players in the IVAS market are advancing their competitive edge through a combination of strategic investments, product innovation, and supply chain restructuring. In response to shifting import dynamics, companies have been diversifying vendor bases and boosting domestic component sourcing. Many are prioritizing R&D to enhance AR integration, optical performance, and system durability. These firms are aligning closely with military modernization goals by customizing solutions to meet battlefield-specific needs, including compact designs, seamless communication modules, and real-time data overlays. Forming strategic defense partnerships and participating in government-led technology initiatives are also key tactics being employed to expand market reach and secure long-term contracts.
Table of Contents
Chapter 1 Methodology & Scope
- 1.1 Market scope & definitions
- 1.2 Base estimates & calculations
- 1.3 Forecast calculations
- 1.4 Data sources
- 1.4.1 Primary
- 1.4.2 Secondary
- 1.4.2.1 Paid sources
- 1.4.2.2 Public sources
Chapter 2 Executive Summary
- 2.1 Industry synopsis, 2021-2034
Chapter 3 Industry Insights
- 3.1 Industry ecosystem analysis
- 3.1.1 Factor affecting the value chain
- 3.1.2 Profit margin analysis
- 3.1.3 Disruptions
- 3.1.4 Future outlook
- 3.1.5 Manufacturers
- 3.1.6 Distributors
- 3.2 Trump administration tariff analysis
- 3.2.1 Impact on trade
- 3.2.1.1 Trade volume disruptions
- 3.2.1.2 Retaliatory measures
- 3.2.2 Impact on the industry
- 3.2.2.1 Supply-side impact (raw materials)
- 3.2.2.1.1 Price volatility in key materials
- 3.2.2.1.2 Supply chain restructuring
- 3.2.2.1.3 Production cost implications
- 3.2.2.2 Demand-side impact (selling price)
- 3.2.2.2.1 Price transmission to end markets
- 3.2.2.2.2 Market share dynamics
- 3.2.2.2.3 Consumer response patterns
- 3.2.2.1 Supply-side impact (raw materials)
- 3.2.3 Key companies impacted
- 3.2.4 Strategic industry responses
- 3.2.4.1 Supply chain reconfiguration
- 3.2.4.2 Pricing and product strategies
- 3.2.4.3 Policy engagement
- 3.2.5 Outlook and future considerations
- 3.2.1 Impact on trade
- 3.3 Supplier landscape
- 3.4 Profit margin analysis
- 3.5 Key news & initiatives
- 3.6 Regulatory landscape
- 3.7 Impact forces
- 3.7.1 Growth drivers
- 3.7.1.1 Rising military modernization programs
- 3.7.1.2 Integration of Augmented Reality (AR) and AI
- 3.7.1.3 Demand for enhanced soldier safety and performance
- 3.7.1.4 Supportive government funding and contracts
- 3.7.1.5 Rising global security threats and asymmetric warfare
- 3.7.2 Industry pitfalls & challenges
- 3.7.2.1 High development and procurement costs
- 3.7.2.2 Operational and technical reliability issues
- 3.7.1 Growth drivers
- 3.8 Growth potential analysis
- 3.9 Porter's analysis
- 3.10 PESTEL analysis
Chapter 4 Competitive Landscape, 2024
- 4.1 Introduction
- 4.2 Company market share analysis
- 4.3 Competitive positioning matrix
- 4.4 Strategic outlook matrix
Chapter 5 Market Estimates & Forecast, By Product, 2021-2034 (USD Million & Thousand Unit)
- 5.1 Key trends
- 5.2 Helmet mounted display
- 5.3 Night vision device
Chapter 6 Market Estimates & Forecast, By Technology, 2021-2034 (USD Million & Thousand Unit)
- 6.1 Key trends
- 6.2 Augmented Reality (AR)
- 6.3 Mixed Reality (MR)
- 6.4 Virtual Reality (VR)
- 6.5 Thermal and low-light imaging
- 6.6 Others
Chapter 7 Market Estimates & Forecast, By Application, 2021-2034 (USD Million & Thousand Unit)
- 7.1 Key trends
- 7.2 Situational awareness
- 7.3 Navigation and mapping
- 7.4 Training and simulation
- 7.5 Target acquisition and engagement
- 7.6 Others
Chapter 8 Market Estimates & Forecast, By End Use, 2021-2034 (USD Million & Thousand Unit)
- 8.1 Key trends
- 8.2 Air force
- 8.3 Army
- 8.4 Navy
Chapter 9 Market Estimates & Forecast, By Region, 2021-2034 (USD Million & Thousand Unit)
- 9.1 Key trends
- 9.2 North America
- 9.2.1 U.S.
- 9.2.2 Canada
- 9.3 Europe
- 9.3.1 UK
- 9.3.2 Germany
- 9.3.3 France
- 9.3.4 Italy
- 9.3.5 Spain
- 9.3.6 Russia
- 9.4 Asia Pacific
- 9.4.1 China
- 9.4.2 India
- 9.4.3 Japan
- 9.4.4 South Korea
- 9.4.5 Australia
- 9.5 Latin America
- 9.5.1 Brazil
- 9.5.2 Mexico
- 9.6 MEA
- 9.6.1 South Africa
- 9.6.2 Saudi Arabia
- 9.6.3 UAE
Chapter 10 Company Profiles
- 10.1 Ajnalens
- 10.2 Anduril
- 10.3 Elbit Systems Ltd
- 10.4 L3Harris Technologies, Inc.
- 10.5 Lockheed Martin
- 10.6 Optex Systems
- 10.7 Varjo
- 10.8 VirTra, Inc.
- 10.9 Vrgineers, Inc.
- 10.10 Vuzix Corporation


