


 |
市场调查报告书
商品编码
1755264
翻新 MRI 系统市场机会、成长动力、产业趋势分析及 2025 - 2034 年预测Refurbished MRI Systems Market Opportunity, Growth Drivers, Industry Trend Analysis, and Forecast 2025 - 2034 |
||||||
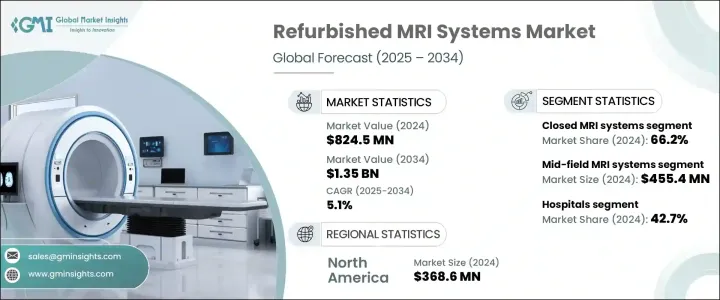
2024 年,全球翻新 MRI 系统市场估值达 8.245 亿美元,预计到 2034 年将以 5.1% 的复合年增长率成长,达到 13.5 亿美元。翻新 MRI 系统持续受到青睐,因为它们为资金有限的医疗服务提供者提供了实用且经济高效的解决方案。由于全新的 MRI 机器价格在 100 万美元至 300 万美元之间,许多中小型医疗机构往往无法负担。相较之下,翻新机器提供了符合成像性能标准的可靠替代方案,使其成为资金不足的医疗环境中改善诊断途径的重要资源。对公平取得医学影像服务的需求日益增长,尤其是在经济受限地区,这是推动这些系统需求的核心因素之一。
翻新的MRI系统并非简单的回收产品;它们经过精心检修,以满足原始规格并确保高品质的成像效果。其价格实惠,使医疗机构能够在不超出紧张预算的情况下扩展诊断服务。此外,无需等待新机器通常伴随的漫长交付週期,即可提供必要的影像服务,这也增加了它们的吸引力。随着全球医疗保健系统面临患者人数不断增长和慢性病发病率不断上升的问题,对可靠、便利且价格合理的影像解决方案的需求变得至关重要。翻新的MRI系统有效地填补了这一空白,帮助医疗机构在控制营运成本的同时保持照护水准。它们的使用也有助于缩小资源丰富地区和服务欠缺地区之间医疗技术可用性的差距,从而支持实现全球健康公平的长期目标。
| 市场范围 | |
|---|---|
| 起始年份 | 2024 |
| 预测年份 | 2025-2034 |
| 起始值 | 8.245亿美元 |
| 预测值 | 13.5亿美元 |
| 复合年增长率 | 5.1% |
2024年,封闭式MRI系统占据了翻新MRI系统市场的绝大部分份额,占全球收入的66.2%。封闭式系统凭藉其卓越的影像清晰度和先进的诊断能力,仍然是许多医疗机构的首选。这些系统支援高磁场强度,使其能够检测微小异常,并为复杂的临床评估提供精确的成像。医疗机构选择翻新的封闭式MRI设备是为了获得高品质的诊断,而无需承担购买新型号的成本负担。预计这些系统的持续成长将在整个预测期内保持主导地位。
根据磁场强度,中场磁振造影系统类别在2024年占据市场领先地位,估值达4.554亿美元。中场磁振造影系统(最常见的是1.5T)因其在各种诊断程序中的多功能性而广受认可。医疗保健提供者青睐这些系统,因为它们能够提供高解析度影像,同时保持成本效益。 1.5T机器在全球范围内的广泛应用为翻新设备创造了一个强劲的二级市场,使医疗机构能够以经济实惠的方式在其网路中提供全面的影像服务。这有助于确保患者能够获得必要的诊断服务,而无需医疗机构在品质或预算方面做出妥协。
在终端用户中,医院在2024年占据了最大的市场份额,达到42.7%。预算限制通常会阻碍许多医院,尤其是规模较小或偏远地区的医院,购买新的MRI系统。翻新设备提供了一个可行的解决方案,使这些机构能够在预算范围内升级或扩展成像能力。与新系统相比,医院不仅受益于较低的前期成本,还受益于更短的交付时间。这使得医院能够更快地更换过时或无法正常运作的设备,并有助于满足患者日益增长的诊断服务需求。随着全球慢性病和复杂疾病负担的增加,医院越来越依赖可靠的MRI系统来提供及时且准确的照护。
从地区来看,北美是2024年领先的市场,价值达3.686亿美元。预计到2034年,该地区将以5%的复合年增长率稳定成长,这得益于不断增长的医疗保健需求和成本敏感型购买行为。在该地区,光是美国在2024年的市场规模就达3.326亿美元,预计到2034年将达到5.382亿美元。面对高昂的医疗支出和资金限制,许多医院和诊断中心正在将翻新的MRI系统视为策略性投资。这些系统使医疗保健提供者能够在保留诊断能力的同时更有效地管理预算。
翻新MRI系统市场竞争激烈,既有国际巨头,也有本土企业。顶级公司占据约65%的市场份额,提供客製化的高效能係统,以满足医疗保健提供者不断变化的需求。随着需求的成长和技术的进步,製造商正在调整其定价和产品策略,以在全球多元化市场提供价格合理、合规且耐用的MRI系统。
目录
第一章:方法论与范围
第二章:执行摘要
第三章:行业洞察
- 产业生态系统分析
- 供应商格局
- 每个阶段的增值
- 影响价值链的因素
- 产业衝击力
- 成长动力
- 对经济高效的成像解决方案的需求不断增长
- 慢性病盛行率不断上升
- 扩大发展中地区的诊断中心
- 更加重视医疗保健的可持续性
- 产业陷阱与挑战
- 对产品品质和性能的担忧
- 缺乏标准化法规
- 市场机会
- 成长动力
- 成长潜力分析
- 监管格局
- 技术和创新格局
- 当前的技术趋势
- 新兴技术
- 价格趋势
- 按地区
- 按产品
- 报销场景
- 报销政策对市场成长的影响
- 未来市场趋势
- 消费者行为分析
- 专利分析
- 波特的分析
- PESTEL分析
第四章:竞争格局
- 介绍
- 竞争市占率分析
- 按地区
- 北美洲
- 欧洲
- 亚太地区
- 按地区
- 公司矩阵分析
- 主要市场参与者的竞争分析
- 竞争定位矩阵
- 关键进展
- 併购
- 伙伴关係和合作
- 新产品发布
- 扩张计划
第五章:市场估计与预测:按系统类型,2021 - 2034 年
- 主要趋势
- 封闭式MRI系统
- 开放式MRI系统
第六章:市场估计与预测:按场强,2021 - 2034 年
- 主要趋势
- 低场MRI系统
- 中场MRI系统
- 高场MRI系统
第七章:市场估计与预测:依最终用途,2021 - 2034 年
- 主要趋势
- 医院
- 门诊手术中心
- 诊断影像中心
- 研究机构和学术中心
第八章:市场估计与预测:按地区,2021 - 2034 年
- 主要趋势
- 北美洲
- 我们
- 加拿大
- 欧洲
- 德国
- 英国
- 法国
- 义大利
- 西班牙
- 荷兰
- 亚太地区
- 日本
- 中国
- 印度
- 澳洲
- 韩国
- 拉丁美洲
- 墨西哥
- 巴西
- 阿根廷
- 中东和非洲
- 南非
- 沙乌地阿拉伯
- 阿联酋
第九章:公司简介
- Aegys
- Amber Diagnostics
- Avante Health Solutions
- Block Imaging
- Canon Medical Systems
- DirectMed Imaging
- Fujifilm Healthcare
- GE HealthCare
- Integrity Medical Systems
- Koninklijke Philips
- LBN Medical
- MedScanner
- Providian Medical
- Siemens Healthineers
- SOMA Technology
The Global Refurbished MRI Systems Market reached a valuation of USD 824.5 million in 2024 and is estimated to grow at a CAGR of 5.1% to reach USD 1.35 billion by 2034. Refurbished MRI systems continue to gain traction as they offer a practical, cost-effective solution to healthcare providers with limited capital. As brand-new MRI machines can cost anywhere between USD 1 million and USD 3 million, they often remain financially inaccessible for many small and mid-sized healthcare organizations. In contrast, refurbished machines provide a reliable alternative that meets imaging performance standards, making them an essential resource for improving diagnostic access in underfunded healthcare environments. The increasing demand for equitable access to medical imaging, especially in economically constrained regions, is one of the core factors driving the demand for these systems.
Refurbished MRI systems are not simply recycled products; they are carefully overhauled to meet original specifications and ensure quality imaging outcomes. Their affordability allows facilities to expand diagnostic services without exceeding tight budgets. Additionally, the ability to deliver essential imaging services without waiting for the long lead times often associated with new machines adds to their appeal. As global healthcare systems face growing patient populations and increasing incidences of chronic illness, the need for dependable, accessible, and affordable imaging solutions has become critical. Refurbished MRI systems fill this gap effectively, helping providers maintain care standards while managing operational costs. Their use also helps reduce the disparity in medical technology availability between well-resourced and underserved regions, supporting the long-term goal of global health equity.
| Market Scope | |
|---|---|
| Start Year | 2024 |
| Forecast Year | 2025-2034 |
| Start Value | $824.5 Million |
| Forecast Value | $1.35 Billion |
| CAGR | 5.1% |
In 2024, the closed MRI systems segment held the majority of the refurbished MRI systems market, accounting for 66.2% of global revenue. Closed systems remain the preferred option for many facilities due to their superior image clarity and advanced diagnostic capability. These systems support high magnetic field strengths, allowing them to detect small abnormalities and provide precise imaging for complex clinical evaluations. Facilities opt for refurbished closed MRI units to access high-quality diagnostics without the cost burden of purchasing new models. The continued preference for these systems is expected to sustain their dominance through the forecast period.
Based on magnetic field strength, the mid-field MRI systems category led the market in 2024 with a valuation of USD 455.4 million. Mid-field MRI systems-most commonly 1.5T-are widely recognized for their versatility across a range of diagnostic procedures. Healthcare providers favor these systems because they deliver high-resolution images while maintaining cost-efficiency. The widespread adoption of 1.5T machines across the globe has created a robust secondary market for refurbished units, giving providers an affordable means of offering comprehensive imaging services across their networks. This helps ensure that patients can access essential diagnostics without facilities needing to compromise on quality or budget.
Among end users, hospitals represented the largest market share in 2024 at 42.7%. Budgetary constraints often prevent many hospitals, especially smaller or rural facilities, from acquiring new MRI systems. Refurbished units offer a viable solution, enabling these institutions to upgrade or expand imaging capabilities within financial limits. Hospitals benefit not only from the lower upfront costs but also from shorter delivery timelines compared to new systems. This allows quicker replacement of outdated or non-functional units and helps meet growing patient demands for diagnostic services. As the global burden of chronic and complex conditions rises, hospitals increasingly rely on dependable MRI systems to deliver timely and accurate care.
Regionally, North America was the leading market in 2024, valued at USD 368.6 million. The region is forecast to grow at a steady pace of 5% CAGR through 2034, driven by rising healthcare needs and cost-sensitive purchasing behaviors. Within this region, the United States alone accounted for USD 332.6 million in 2024 and is expected to reach USD 538.2 million by 2034. Faced with high healthcare expenditures and capital limitations, many hospitals and diagnostic centers are turning to refurbished MRI systems as a strategic investment. These systems allow healthcare providers to preserve diagnostic capabilities while managing budgets more effectively.
The refurbished MRI systems market is competitive, featuring both international giants and local players. Collectively, top companies hold approximately 65% of the market share, offering tailored, high-performance systems to meet the evolving needs of healthcare providers. With increasing demand and technological advancements, manufacturers are adapting their pricing and product strategies to deliver affordable, compliant, and durable MRI systems across diverse global markets.
Table of Contents
Chapter 1 Methodology and Scope
- 1.1 Market scope and definitions
- 1.2 Research design
- 1.2.1 Research approach
- 1.2.2 Data collection methods
- 1.3 Data mining sources
- 1.3.1 Global
- 1.3.2 Regional/country
- 1.4 Base estimates and calculations
- 1.4.1 Base year calculation
- 1.4.2 Key trends for market estimation
- 1.5 Primary research and validation
- 1.5.1 Primary sources
- 1.6 Forecast model
- 1.7 Research assumptions and limitations
Chapter 2 Executive Summary
- 2.1 Industry 360° synopsis
- 2.2 Key market trends
- 2.2.1 Regional
- 2.2.2 Product
- 2.2.3 Application
- 2.2.4 End Use
- 2.3 CXO perspectives: Strategic imperatives
- 2.3.1 Key decision points for industry executives
- 2.3.2 Critical success factors for market players
- 2.4 Future outlook and strategic recommendations
Chapter 3 Industry Insights
- 3.1 Industry ecosystem analysis
- 3.1.1 Supplier landscape
- 3.1.2 Value addition at each stage
- 3.1.3 Factor affecting the value chain
- 3.2 Industry impact forces
- 3.2.1 Growth drivers
- 3.2.1.1 Rising demand for cost-effective imaging solutions
- 3.2.1.2 Growing prevalence of chronic diseases
- 3.2.1.3 Expansion of diagnostic centers in developing regions
- 3.2.1.4 Increased emphasis on sustainability in healthcare
- 3.2.2 Industry pitfalls and challenges
- 3.2.2.1 Concerns over product quality and performance
- 3.2.2.2 Lack of standardized regulations
- 3.2.3 Market opportunities
- 3.2.1 Growth drivers
- 3.3 Growth potential analysis
- 3.4 Regulatory landscape
- 3.4.1 North America
- 3.4.2 Europe
- 3.4.3 Asia Pacific
- 3.4.4 Latin America
- 3.4.5 Middle East and Africa
- 3.5 Technology and innovation landscape
- 3.5.1 Current technological trends
- 3.5.2 Emerging technologies
- 3.6 Price trends
- 3.6.1 By region
- 3.6.2 By product
- 3.7 Reimbursement scenario
- 3.7.1 Impact of reimbursement policies on market growth
- 3.8 Future market trends
- 3.9 Consumer behaviour analysis
- 3.10 Patent analysis
- 3.11 Porter's analysis
- 3.12 PESTEL analysis
Chapter 4 Competitive Landscape, 2024
- 4.1 Introduction
- 4.2 Competitive market share analysis
- 4.2.1 By region
- 4.2.1.1 North America
- 4.2.1.2 Europe
- 4.2.1.3 Asia Pacific
- 4.2.1 By region
- 4.3 Company matrix analysis
- 4.4 Competitive analysis of major market players
- 4.5 Competitive positioning matrix
- 4.6 Key developments
- 4.6.1 Mergers and acquisitions
- 4.6.2 Partnerships and collaborations
- 4.6.3 New Product Launches
- 4.6.4 Expansion Plans
Chapter 5 Market Estimates and Forecast, By System Type, 2021 - 2034 ($ Mn)
- 5.1 Key trends
- 5.2 Closed MRI systems
- 5.3 Open MRI systems
Chapter 6 Market Estimates and Forecast, By Field Strength, 2021 - 2034 ($ Mn)
- 6.1 Key trends
- 6.2 Low-field MRI systems
- 6.3 Mid-field MRI systems
- 6.4 High-field MRI systems
Chapter 7 Market Estimates and Forecast, By End Use, 2021 - 2034 ($ Mn)
- 7.1 Key trends
- 7.2 Hospitals
- 7.3 Ambulatory surgical centers
- 7.4 Diagnostic imaging centers
- 7.5 Research institutes and academic centers
Chapter 8 Market Estimates and Forecast, By Region, 2021 - 2034 ($ Mn)
- 8.1 Key trends
- 8.2 North America
- 8.2.1 U.S.
- 8.2.2 Canada
- 8.3 Europe
- 8.3.1 Germany
- 8.3.2 UK
- 8.3.3 France
- 8.3.4 Italy
- 8.3.5 Spain
- 8.3.6 Netherlands
- 8.4 Asia Pacific
- 8.4.1 Japan
- 8.4.2 China
- 8.4.3 India
- 8.4.4 Australia
- 8.4.5 South Korea
- 8.5 Latin America
- 8.5.1 Mexico
- 8.5.2 Brazil
- 8.5.3 Argentina
- 8.6 Middle East and Africa
- 8.6.1 South Africa
- 8.6.2 Saudi Arabia
- 8.6.3 UAE
Chapter 9 Company Profiles
- 9.1 Aegys
- 9.2 Amber Diagnostics
- 9.3 Avante Health Solutions
- 9.4 Block Imaging
- 9.5 Canon Medical Systems
- 9.6 DirectMed Imaging
- 9.7 Fujifilm Healthcare
- 9.8 GE HealthCare
- 9.9 Integrity Medical Systems
- 9.10 Koninklijke Philips
- 9.11 LBN Medical
- 9.12 MedScanner
- 9.13 Providian Medical
- 9.14 Siemens Healthineers
- 9.15 SOMA Technology


