


 |
市场调查报告书
商品编码
1755359
工业真空帮浦市场机会、成长动力、产业趋势分析及2025-2034年预测Industrial Vacuum Pump Market Opportunity, Growth Drivers, Industry Trend Analysis, and Forecast 2025 - 2034 |
||||||
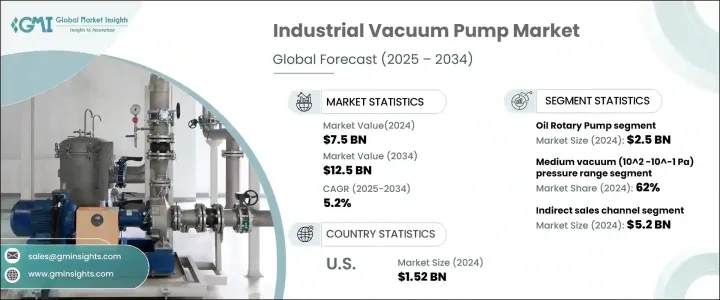
2024年,全球工业真空帮浦市场规模达75亿美元,预计2034年将以5.2%的复合年增长率成长,达到125亿美元,这主要得益于多个终端应用领域日益增长的需求。这些真空帮浦广泛应用于需要精密製造和高纯度加工的产业,为市场扩张做出了巨大贡献。它们广泛应用于需要受控环境的敏感操作领域,巩固了其在工业工作流程中的重要性。
随着半导体产业的发展,它刺激了互联市场的需求。随着工业自动化和清洁生产标准的提高,真空帮浦技术在全球的应用日益广泛。然而,高昂的前期投资和持续的维护成本仍然是主要的限制因素,尤其对于小型企业而言。此外,营运复杂性和对技术专业知识的需求使得在欠发达地区采用该技术更具挑战性,从而限制了其在新兴市场的成长。
| 市场范围 | |
|---|---|
| 起始年份 | 2024 |
| 预测年份 | 2025-2034 |
| 起始值 | 75亿美元 |
| 预测值 | 125亿美元 |
| 复合年增长率 | 5.2% |
许多地区都面临着熟练技术人员短缺的问题,并且缺乏管理和维护现代真空系统所需的专业培训课程。即使是常规的故障排除或维护也可能成为重大障碍,导致停机时间增加,设备寿命缩短。此外,技术人员配备的高成本,加上支援复杂机械的基础设施有限,进一步阻碍了小型企业升级到先进的真空帮浦技术。
油旋转帮浦市场在2024年创收25亿美元,预计2034年将维持强劲成长势头,复合年增长率达5%。这类帮浦因其稳定的真空输出以及在可变压力条件下承受持续高要求运行的能力而备受推崇。其坚固的结构和高性能使其成为精度和一致性至关重要的工业环境中的首选解决方案。它们能够适应严苛的製程环境,并最大程度地缩短停机时间,这进一步提升了其在材料加工、真空镀膜等各个领域的应用。
从分销角度来看,间接销售领域在2024年创造了52亿美元的收入,预计到2034年将以4.7%的复合年增长率成长。间接销售的成功得益于完善的经销商、经销商和数位市场网络,这些网络提供丰富的真空帮浦产品选择。这些管道简化了最终用户的采购流程,并提供增值服务,例如係统客製化、技术培训、售后支援以及透过区域库存实现更快的交付。
2024年,美国工业真空帮浦市场规模达15.2亿美元,预计2034年复合年增长率将达5.2%。美国在电子、製药和特种化学品等需要高纯度製造製程的产业拥有先进的基础设施,这进一步巩固了其在工业真空帮浦市场的领先地位。政府对製造业现代化的支持以及自动化技术的广泛集成,进一步增强了市场前景。
为全球工业真空帮浦市场做出贡献的知名公司包括 Gardner Denver、Ebara Corporation、Pfeiffer Vacuum GmbH、Atlas Copco AB (Edwards)、ULVAC Inc.、Flowserve Corporation、Global Vac、Wintek Corporation、Ingersoll Rand Inc.、Busch Vacuum Solutions、Beckerxecker PKil Technologies. Technologies Peckera.alx.、Becker.alxx Technologies Peckera、Becker)。工业真空帮浦市场领导者采用的关键策略包括高度重视产品创新、产能扩张以及策略合併或合作。各公司正在投资研发,以推出节能和智慧真空技术,旨在提高自动化和数位整合度。与行业特定的 OEM 合作有助于拓宽其应用范围。透过分销网路进行地理扩张可确保更强大的区域足迹,而售后服务和客製化产品有助于提高客户保留率。
目录
第一章:方法论与范围
第二章:执行摘要
第三章:行业洞察
- 产业生态系统分析
- 影响价值链的因素
- 利润率分析
- 中断
- 未来展望
- 製造商
- 经销商
- 零售商
- 川普政府关税的影响
- 贸易影响
- 贸易量中断
- 报復措施
- 对产业的影响
- 供给侧影响(原料)
- 主要材料价格波动
- 供应链重组
- 生产成本影响
- 需求面影响(客户成本)
- 价格传导至终端市场
- 市占率动态
- 消费者反应模式
- 供给侧影响(原料)
- 受影响的主要公司
- 策略产业反应
- 供应链重组
- 定价和产品策略
- 政策参与
- 展望与未来考虑
- 贸易影响
- 衝击力
- 成长动力
- 半导体和电子产业需求不断成长
- 化工和製药业的扩张
- 食品和饮料行业的采用率不断上升
- 製造业和工业流程的成长
- 产业陷阱与挑战
- 初期投资及维护成本高
- 复杂性和技术挑战
- 成长动力
- 技术与创新格局
- 成长潜力分析
- 监管格局
- 定价分析
- 波特的分析
- PESTEL分析
第四章:竞争格局
- 介绍
- 公司市占率分析
- 竞争定位矩阵
- 战略展望矩阵
第五章:市场估计与预测:按类型,2021 年至 2034 年
- 主要趋势
- 液环真空帮浦
- 油旋转泵
- 罗茨帮浦
- 干式真空帮浦
- 多级罗茨真空泵
- 干式螺桿真空泵
- 干式涡旋真空泵
- 干式隔膜真空泵
- 干式旋片真空泵
- 干式摇摆活塞真空泵
- 干式旋转乌鸦真空泵
- 干式涡轮真空泵
第六章:市场估计与预测:依压力范围,2021 年至 2034 年
- 主要趋势
- 低真空(10^5-10^2 Pa)
- 中真空(10^2-10^-1 Pa)
第七章:市场估计与预测:依规模,2021 年至 2034 年
- 主要趋势
- 小型(< 10 立方公尺/小时)
- 中(10-100立方米/小时)
- 大型(> 100 m3/h)
第 8 章:市场估计与预测:按最终用途产业,2021 年至 2034 年
- 主要趋势
- 半导体
- 水和废水处理
- 化学品和石化产品
- 矿业
- 食品和饮料
- 建造
- 石油和天然气
- 製药
- 其他(农业、纺织等)
第九章:市场估计与预测:按配销通路,2021 年至 2034 年
- 主要趋势
- 直销
- 间接销售
第十章:市场估计与预测:按地区,2021 年至 2034 年
- 主要趋势
- 北美洲
- 我们
- 加拿大
- 欧洲
- 德国
- 英国
- 法国
- 义大利
- 西班牙
- 亚太地区
- 中国
- 印度
- 日本
- 韩国
- 澳洲
- 马来西亚
- 印尼
- 拉丁美洲
- 巴西
- 墨西哥
- MEA
- 沙乌地阿拉伯
- 阿联酋
- 南非
第 11 章:公司简介
- Agilent Technologies
- Atlas Copco AB (Edwards)
- Becker Pumps Corporation
- Busch Vacuum Solutions
- Ebara Corporation
- Flowserve Corporation
- Gardner Denver
- Global Vac
- Graham Corporation
- Ingersoll Rand Inc.
- Pfeiffer Vacuum GmbH
- Tsurumi Manufacturing Co. Ltd
- ULVAC Inc.
- Wintek Corporation
The Global Industrial Vacuum Pump Market was valued at USD 7.5 billion in 2024 and is estimated to grow at a CAGR of 5.2% to reach USD 12.5 billion by 2034, driven by the increasing demand across multiple end-use sectors. These vacuum pumps are extensively used in industries requiring precision manufacturing and high-purity processing, contributing significantly to market expansion. Their widespread application across sectors dealing with sensitive operations requiring a controlled environment has solidified their relevance in industrial workflows.
As the semiconductor segment advances, it fuels demand in interconnected markets. With rising industrial automation and cleaner production standards, vacuum pump technology is increasingly being adopted across the globe. Nevertheless, the high upfront investment and the ongoing maintenance costs remain major deterrents, especially for smaller companies. In addition, the operational complexity and the need for technical expertise make adoption more challenging in less advanced setups, creating growth limitations in emerging markets.
| Market Scope | |
|---|---|
| Start Year | 2024 |
| Forecast Year | 2025-2034 |
| Start Value | $7.5 Billion |
| Forecast Value | $12.5 Billion |
| CAGR | 5.2% |
Many of these regions face a shortage of skilled technicians and lack access to specialized training programs, essential for managing and maintaining modern vacuum systems. Even routine troubleshooting or maintenance can become a significant hurdle, leading to increased downtime and reduced equipment lifespan. Moreover, the high cost associated with technical staffing, coupled with limited infrastructure to support complex machinery, further deters smaller industries from upgrading to advanced vacuum pump technologies.
The oil rotary pump segment generated USD 2.5 billion in 2024 and is projected to maintain strong momentum with a CAGR of 5% through 2034. These pumps are particularly valued for their stable vacuum output and ability to withstand continuous, demanding operations under variable pressure conditions. Their robust construction and high performance make them a go-to solution in industrial environments where precision and consistency are mission-critical. Their adaptability to harsh process environments and minimal downtime further boost their utility across various sectors, from material processing to vacuum coating.
From a distribution standpoint, the indirect sales segment generated USD 5.2 billion in 2024 and is anticipated to grow at a CAGR of 4.7% through 2034. The success of indirect sales is driven by a well-established network of distributors, resellers, and digital marketplaces that offer a broad selection of vacuum pump products. These channels simplify procurement for end-users but provide value-added services like system customization, technical training, post-purchase support, and faster delivery through regional inventories.
United States Industrial Vacuum Pump Market was valued at USD 1.52 billion in 2024, projected to grow at a CAGR of 5.2% by 2034. This leadership is fueled by the country's advanced infrastructure in sectors requiring high-purity manufacturing processes, such as electronics, pharmaceuticals, and specialty chemicals. Government support for modernizing manufacturing and the widespread integration of automation technologies further strengthens the market outlook.
Prominent companies contributing to the Global Industrial Vacuum Pump Market include Gardner Denver, Ebara Corporation, Pfeiffer Vacuum GmbH, Atlas Copco AB (Edwards), ULVAC Inc., Flowserve Corporation, Global Vac, Wintek Corporation, Ingersoll Rand Inc., Busch Vacuum Solutions, Becker Pumps Corporation, Tsurumi Manufacturing Co. Ltd, Graham Corporation, and Agilent Technologies. Key strategies adopted by leading players in the industrial vacuum pump market include a strong focus on product innovation, capacity expansion, and strategic mergers or partnerships. Companies are investing in R&D to introduce energy-efficient and smart vacuum technologies, targeting increased automation and digital integration. Collaborations with industry-specific OEMs help broaden their application reach. Geographic expansion through distribution networks ensures stronger regional footprints, while after-sales services and customized offerings help boost customer retention.
Table of Contents
Chapter 1 Methodology & Scope
- 1.1 Market scope & definition
- 1.2 Base estimates & calculations
- 1.3 Forecast parameters
- 1.4 Data sources
- 1.4.1 Primary
- 1.4.2 Secondary
- 1.4.2.1 Paid sources
- 1.4.2.2 Public sources
Chapter 2 Executive Summary
- 2.1 Industry 3600 synopsis, 2021 - 2034
Chapter 3 Industry Insights
- 3.1 Industry ecosystem analysis
- 3.1.1 Factors affecting the value chain
- 3.1.2 Profit margin analysis
- 3.1.3 Disruptions
- 3.1.4 Future outlook
- 3.1.5 Manufacturers
- 3.1.6 Distributors
- 3.1.7 Retailers
- 3.2 Impact of Trump administration tariffs
- 3.2.1 Trade impact
- 3.2.1.1 Trade volume disruptions
- 3.2.1.2 Retaliatory measures
- 3.2.2 Impact on industry
- 3.2.2.1 Supply-side impact (raw materials)
- 3.2.2.1.1 Price volatility in key materials
- 3.2.2.1.2 Supply chain restructuring
- 3.2.2.1.3 Production cost implications
- 3.2.2.2 Demand-side impact (Cost to customers)
- 3.2.2.2.1 Price transmission to end markets
- 3.2.2.2.2 Market share dynamics
- 3.2.2.2.3 Consumer response patterns
- 3.2.2.1 Supply-side impact (raw materials)
- 3.2.3 Key companies impacted
- 3.2.4 Strategic industry responses
- 3.2.4.1 Supply chain reconfiguration
- 3.2.4.2 Pricing and product strategies
- 3.2.4.3 Policy engagement
- 3.2.5 Outlook & future considerations
- 3.2.1 Trade impact
- 3.3 Impact forces
- 3.3.1 Growth drivers
- 3.3.1.1 Increasing demand in semiconductor and electronics industry
- 3.3.1.2 Expansion in chemical and pharmaceutical industries
- 3.3.1.3 Rising adoption in food and beverage industry
- 3.3.1.4 Growth in manufacturing and industrial processes
- 3.3.2 Industry pitfalls & challenges
- 3.3.2.1 High initial investment and maintenance costs
- 3.3.2.2 Complexity and technical challenges
- 3.3.1 Growth drivers
- 3.4 Technology & innovation landscape
- 3.5 Growth potential analysis
- 3.6 Regulatory landscape
- 3.7 Pricing analysis
- 3.8 Porter's analysis
- 3.9 PESTEL analysis
Chapter 4 Competitive Landscape, 2024
- 4.1 Introduction
- 4.2 Company market share analysis
- 4.3 Competitive positioning matrix
- 4.4 Strategic outlook matrix
Chapter 5 Market Estimates & Forecast, By Type, 2021 – 2034, (USD Billion) (Million Units)
- 5.1 Key trends
- 5.2 Liquid ring vacuum pump
- 5.3 Oil rotary pump
- 5.4 Roots pump
- 5.5 Dry vacuum pump
- 5.6 Multi-stage roots vacuum pump
- 5.6.1 Dry screw vacuum pump
- 5.6.2 Dry scroll vacuum pump
- 5.6.3 Dry diaphragm vacuum pump
- 5.6.4 Dry rotary vane vacuum pump
- 5.6.5 Dry rocking piston vacuum pump
- 5.6.6 Dry rotary crow vacuum pump
- 5.6.7 Dry turbo vacuum pump
Chapter 6 Market Estimates & Forecast, By Pressure Range, 2021 – 2034, (USD Billion) (Million Units)
- 6.1 Key trends
- 6.2 Low vacuum (10^5-10^2 Pa)
- 6.3 Medium vacuum (10^2 -10^-1 Pa)
Chapter 7 Market Estimates & Forecast, By Size, 2021 – 2034, (USD Billion) (Million Units)
- 7.1 Key trends
- 7.2 Small (< 10 m3/h)
- 7.3 Medium (10-100 m3/h)
- 7.4 Large (> 100 m3/h)
Chapter 8 Market Estimates & Forecast, By End Use Industry, 2021 – 2034, (USD Billion) (Million Units)
- 8.1 Key trends
- 8.2 Semiconductor
- 8.3 Water & wastewater treatment
- 8.4 Chemicals and petrochemicals
- 8.5 Mining
- 8.6 Food and beverages
- 8.7 Construction
- 8.8 Oil & gas
- 8.9 Pharmaceutical
- 8.10 Others (Agricultural, textile, etc.)
Chapter 9 Market Estimates & Forecast, By Distribution Channel, 2021 – 2034, (USD Billion) (Million Units)
- 9.1 Key trends
- 9.2 Direct sales
- 9.3 Indirect sales
Chapter 10 Market Estimates & Forecast, By Region, 2021 – 2034, (USD Billion) (Million Units)
- 10.1 Key trends
- 10.2 North America
- 10.2.1 U.S.
- 10.2.2 Canada
- 10.3 Europe
- 10.3.1 Germany
- 10.3.2 UK
- 10.3.3 France
- 10.3.4 Italy
- 10.3.5 Spain
- 10.4 Asia Pacific
- 10.4.1 China
- 10.4.2 India
- 10.4.3 Japan
- 10.4.4 South Korea
- 10.4.5 Australia
- 10.4.6 Malaysia
- 10.4.7 Indonesia
- 10.5 Latin America
- 10.5.1 Brazil
- 10.5.2 Mexico
- 10.6 MEA
- 10.6.1 Saudi Arabia
- 10.6.2 UAE
- 10.6.3 South Africa
Chapter 11 Company Profiles (Business Overview, Financial Data, Product Landscape, Strategic Outlook, SWOT Analysis)
- 11.1 Agilent Technologies
- 11.2 Atlas Copco AB (Edwards)
- 11.3 Becker Pumps Corporation
- 11.4 Busch Vacuum Solutions
- 11.5 Ebara Corporation
- 11.6 Flowserve Corporation
- 11.7 Gardner Denver
- 11.8 Global Vac
- 11.9 Graham Corporation
- 11.10 Ingersoll Rand Inc.
- 11.11 Pfeiffer Vacuum GmbH
- 11.12 Tsurumi Manufacturing Co. Ltd
- 11.13 ULVAC Inc.
- 11.14 Wintek Corporation
 全球干式真空帮浦市场(依技术、真空度、泵浦速、安装类型、最终用途产业及销售管道划分),2026-2032年预测双级高真空变压器油净化器市场按产品类型、油类型、销售管道、应用和最终用户产业划分,全球预测,2026-2032年模组化干式真空系统市场按类型、真空度、功率等级、应用、最终用户和分销管道划分,全球预测,2026-2032年
 2026年全球工业真空帮浦市场报告2026年全球真空帮浦市场报告
 真空帮浦市场 - 全球产业规模、份额、趋势、机会及预测(按润滑类型、机构、压力、最终用户、地区和竞争格局划分),2021-2031年
 2026-2030年全球液环真空帮浦市场
 液环真空帮浦市场-2026-2031年预测真空帮浦市场-2026-2031年预测按材料类型、形状、最终用途产业、应用和销售管道分類的压印包装片材市场-2026-2032年全球预测