


 |
市场调查报告书
商品编码
1766178
硫酸铵市场机会、成长动力、产业趋势分析及2025-2034年预测Ammonium Sulphate Market Opportunity, Growth Drivers, Industry Trend Analysis, and Forecast 2025 - 2034 |
||||||
2024年,全球硫酸铵市场价值为36亿美元,预计到2034年将以3.5%的复合年增长率成长,达到50亿美元。这一增长的驱动力源于全球粮食生产需求的日益增长、农业经营规模的不断扩大以及为不断增长的人口提供安全食品供应链的需求。硫酸铵持续受到强劲的关注,这主要得益于其作为氮基肥料的关键作用及其在各工业领域日益广泛的应用。硫酸铵在碱性土壤中的高溶解性和高效性使其成为提高作物产量的首选,尤其是在水稻、玉米和小麦种植中。在政府推动永续农业实践的倡议的支持下,硫酸铵在发展中地区的应用日益广泛。
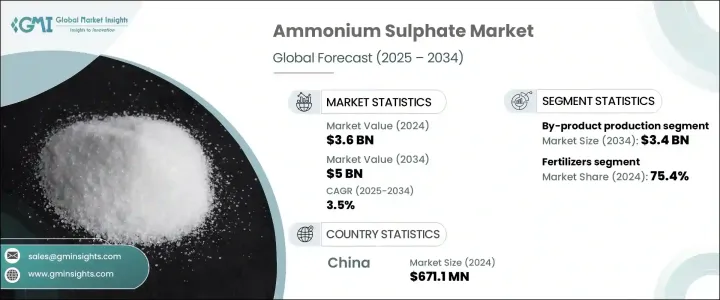
全球超过75%的硫酸铵需求来自化肥。在亚太地区,尤其是中国和印度等国家,人口成长和对耕地扩张的日益重视导致化肥消费量增加。硫酸铵在水处理、製药和食品加工等工业领域也扮演越来越重要的角色。其在烟气脱硫系统中的应用已变得越来越重要,尤其是在执行严格空气品质标准的地区。随着全球法规的不断收紧,透过排放控制技术推动清洁航运也推动了硫酸铵的使用。
| 市场范围 | |
|---|---|
| 起始年份 | 2024 |
| 预测年份 | 2025-2034 |
| 起始值 | 36亿美元 |
| 预测值 | 50亿美元 |
| 复合年增长率 | 3.5% |
2024年,副产品生产方法贡献了24亿美元的市场规模,预计到2034年将达到34亿美元,维持3.5%的复合年增长率。副产品生产占68.4%,因为它成本效益高,并且能够以环保的方式利用废液。此方法可在焦炉煤气和己内酰胺等物料加工过程中以及在煤烟气洗涤过程中回收硫酸铵。这些方法在降低生产成本的同时,也解决了环境问题,尤其是在《工业排放指令》等鼓励将硫回收为可用形式(例如硫酸铵)的政策下。
2024年,肥料领域占据市场主导地位,占75.4%。由于硫酸铵是一种高效能低成本的氮肥,尤其有助于提高碱性土壤的养分吸收,该领域将继续蓬勃发展。硫酸铵支持各种农业活动,包括自给自足型和商业型。玉米、水稻和其他谷物等作物受益于其易用性以及与其他肥料的兼容性。由于政府补贴的增加,以及向精准农业等现代农业战略的转变,亚太和拉丁美洲的发展中国家在硫酸铵的应用方面处于领先地位,精准农业可以提高效率并最大限度地减少浪费。
2024年,中国硫酸铵市场产值达6.711亿美元,预估年复合成长率为3.6%,到2034年将达到9.539亿美元。由于中国强劲的农业产量,该市场正在快速扩张。儘管中国耕地面积不到全球的10%,但却生产了全球约25%的粮食,这进一步加剧了对硫酸铵等土壤改良剂的严重依赖,尤其是在水稻种植方面。中国也受益于不断增长的工业生产,旨在大规模生产压实硫酸铵的大规模合作正在推动该行业的发展势头。
全球硫酸铵产业的主要参与者包括巴斯夫欧洲公司、宇部兴产株式会社、OCI Nitrogen公司、赢创工业股份公司和朗盛股份公司。硫酸铵市场领导者采取的关键策略重点是透过策略合作扩大产能、加强成本效益生产技术的研发以及开发增值工业应用。企业正在投资更清洁的生产路线,尤其是己内酰胺和焦炉製程副产品的回收,不仅可以节省成本,还能满足环境永续监管压力。透过合资企业和工厂扩建扩大在亚太等高成长地区的业务范围仍然是一项重要任务。此外,主要企业正在加强其供应链和分销网络,以确保提供更好的服务和本地化支持,尤其是在化肥需求旺盛的新兴经济体。
目录
第一章:方法论与范围
第二章:执行摘要
第三章:行业洞察
- 产业生态系统分析
- 供应商概况
- 利润率
- 每个阶段的增值
- 影响价值链的因素
- 中断
- 产业衝击力
- 成长动力
- 产业陷阱与挑战
- 市场机会
- 成长潜力分析
- 监管格局
- 北美洲
- 欧洲
- 亚太地区
- 拉丁美洲
- 中东和非洲
- 波特的分析
- PESTEL分析
- 价格趋势
- 按地区
- 按产品形态
- 未来市场趋势
- 科技与创新格局
- 当前的技术趋势
- 新兴技术
- 专利态势
- 贸易统计数据
(註:仅提供重点国家的贸易统计数据
- 主要进口国
- 主要出口国
- 永续性和环境方面
- 永续实践
- 减少废弃物的策略
- 生产中的能源效率
- 环保倡议
- 碳足迹考量
第四章:竞争格局
- 介绍
- 公司市占率分析
- 按地区
- 北美洲
- 欧洲
- 亚太地区
- 拉丁美洲
- MEA
- 按地区
- 公司矩阵分析
- 主要市场参与者的竞争分析
- 竞争定位矩阵
- 关键进展
- 併购
- 伙伴关係与合作
- 新产品发布
- 扩张计划
第五章:市场估计与预测:依生产方式,2021 年至 2034 年
- 主要趋势
- 合成生产
- 副产品生产
- 己内酰胺生产
- 焦炉操作
- 甲基丙烯酸甲酯生产
- 其他副产品来源
第六章:市场估计与预测:依产品形式,2021 年至 2034 年
- 主要趋势
- 坚硬的
- 颗粒状
- 结晶
- 液体
第七章:市场估计与预测:依纯度等级,2021 年至 2034 年
- 主要趋势
- 标准品级(≤99%)
- 高纯度等级(>99%)
第 8 章:市场估计与预测:按应用,2021 年至 2034 年
- 主要趋势
- 肥料
- 纯肥料
- 复合肥料
- 特种肥料
- 工业应用
- 纺织业
- 水处理
- 食品添加物
- 阻燃剂
- 化学製造
- 其他的
- 製药
- 其他的
第九章:市场估计与预测:按地区,2021 年至 2034 年
- 主要趋势
- 北美洲
- 我们
- 加拿大
- 欧洲
- 德国
- 英国
- 法国
- 西班牙
- 义大利
- 欧洲其他地区
- 亚太地区
- 中国
- 印度
- 日本
- 澳洲
- 韩国
- 亚太其他地区
- 拉丁美洲
- 巴西
- 墨西哥
- 阿根廷
- 拉丁美洲其他地区
- 中东和非洲
- 沙乌地阿拉伯
- 南非
- 阿联酋
- 中东和非洲其他地区
第十章:公司简介
- BASF SE
- AdvanSix Inc.
- CF Industries Holdings, Inc.
- Domo Chemicals GmbH
- Domo Engineering Plastics US
- EuroChem Group AG
- Evonik Industries AG
- Grupa Azoty SA
- Helm AG
- Honeywell International Inc.
- JSC Kuibyshevazot
- Lanxess AG
- Novus International, Inc.
- Nutrien Ltd.
- OCI NV
- Ostchem Holding
- Sinopec
- Sumitomo Chemical Co., Ltd.
- Ube Industries, Ltd.
- Yara International ASA
The Global Ammonium Sulphate Market was valued at USD 3.6 billion in 2024 and is estimated to grow at a CAGR of 3.5% to reach USD 5 billion by 2034. This growth is driven by the increasing need to support global food production, expanding agricultural operations, and the rising demand to secure food supply chains for a growing population. Ammonium sulphate continues to see strong traction primarily due to its critical role as a nitrogen-based fertilizer and its expanding applications across various industrial sectors. Its high solubility and efficiency in alkaline soils make it a preferred choice for enhancing crop yields, especially in rice, maize, and wheat farming. The compound's relevance is rising in developing regions, supported by governmental initiatives promoting sustainable agricultural practices.
More than 75% of global ammonium sulphate demand is attributed to fertilizer usage. In regions like Asia Pacific, especially countries such as China and India, the growing population and increased focus on arable land expansion have resulted in higher fertilizer consumption. The compound also plays a growing role in industrial fields like water treatment, pharmaceutical manufacturing, and food processing. Its application in flue gas desulfurization systems has gained significance, particularly in areas that enforce stringent air quality standards. The push toward cleaner shipping through emission control technologies has also boosted ammonium sulphate usage, as global regulations continue to tighten.
| Market Scope | |
|---|---|
| Start Year | 2024 |
| Forecast Year | 2025-2034 |
| Start Value | $3.6 Billion |
| Forecast Value | $5 Billion |
| CAGR | 3.5% |
In 2024, the by-product production method contributed USD 2.4 billion and is forecasted to reach USD 3.4 billion by 2034, maintaining a 3.5% CAGR. By-product production accounts for 68.4% share due to its cost-effectiveness and environmentally favorable use of waste streams. This method recovers ammonium sulphate during the processing of materials like coke oven gas and caprolactam, as well as during coal flue gas scrubbing. These routes lower production costs while addressing environmental concerns, especially under policies like the Industrial Emissions Directive, which promotes sulphur recovery into usable forms such as ammonium sulphate.
The fertilizer segment dominated the market in 2024, holding a 75.4% share. This segment continues to thrive as ammonium sulphate serves as an effective and low-cost nitrogen fertilizer, especially valuable in improving nutrient uptake in alkaline soils. It supports a wide range of agricultural activities at both subsistence and commercial levels. Crops like maize, rice, and other cereals benefit from its ease of use and compatibility with other fertilizers. Developing nations in Asia Pacific and Latin America are leading in its adoption, thanks to increased government subsidies and a greater shift toward modern agricultural strategies like precision farming, which enhances efficiency and minimizes waste.
China Ammonium Sulphate Market generated USD 671.1 million in 2024 and is projected to grow at a 3.6% CAGR, reaching USD 953.9 million by 2034. This market is expanding rapidly, underpinned by the country's robust agricultural output. Despite having under 10% of the world's arable land, China produces around 25% of global grain, reinforcing its heavy reliance on soil enhancers like ammonium sulphate, particularly for rice cultivation. The country also benefits from growing industrial production, and large-scale collaborations aimed at manufacturing significant volumes of compacted ammonium sulphate are boosting the sector's momentum.
Major players in the global ammonium sulfate industry include BASF SE, UBE Corporation, OCI Nitrogen, Evonik Industries AG, and Lanxess AG. Key strategies adopted by leading companies in the ammonium sulphate market focus on expanding capacity through strategic collaborations, boosting R&D for cost-efficient production technologies, and tapping into value-added industrial applications. Companies are investing in cleaner production routes, especially by-product recovery from caprolactam and coke oven processes, which allow cost savings and align with regulatory pressures for environmental sustainability. Expanding footprint in high-growth regions like Asia Pacific through joint ventures and facility expansions also remains a major priority. Additionally, key firms are strengthening their supply chains and distribution networks to ensure better service delivery and localized support, especially in emerging economies where fertilizer demand is booming.
Table of Contents
Chapter 1 Methodology & Scope
- 1.1 Market scope and definition
- 1.2 Research design
- 1.2.1 Research approach
- 1.2.2 Data collection methods
- 1.3 Data mining sources
- 1.3.1 Global
- 1.3.2 Regional/Country
- 1.4 Base estimates and calculations
- 1.4.1 Base year calculation
- 1.4.2 Key trends for market estimation
- 1.5 Primary research and validation
- 1.5.1 Primary sources
- 1.6 Forecast model
- 1.7 Research assumptions and limitations
Chapter 2 Executive Summary
- 2.1 Industry 360° synopsis
- 2.2 Key market trends
- 2.2.1 Regional
- 2.2.2 Production Method
- 2.2.3 Application
- 2.3 TAM Analysis, 2025-2034
- 2.4 CXO perspectives: Strategic imperatives
- 2.4.1 Executive decision points
- 2.4.2 Critical success factors
- 2.5 Future Outlook and Strategic Recommendations
Chapter 3 Industry Insights
- 3.1 Industry ecosystem analysis
- 3.1.1 Supplier Landscape
- 3.1.2 Profit Margin
- 3.1.3 Value addition at each stage
- 3.1.4 Factor affecting the value chain
- 3.1.5 Disruptions
- 3.2 Industry impact forces
- 3.2.1 Growth drivers
- 3.2.2 Industry pitfalls and challenges
- 3.2.3 Market opportunities
- 3.3 Growth potential analysis
- 3.4 Regulatory landscape
- 3.4.1 North America
- 3.4.2 Europe
- 3.4.3 Asia Pacific
- 3.4.4 Latin America
- 3.4.5 Middle East & Africa
- 3.5 Porter's analysis
- 3.6 PESTEL analysis
- 3.6.1 Technology and Innovation landscape
- 3.6.2 Current technological trends
- 3.6.3 Emerging technologies
- 3.7 Price trends
- 3.7.1 By region
- 3.7.2 By product form
- 3.8 Future market trends
- 3.9 Technology and Innovation landscape
- 3.9.1 Current technological trends
- 3.9.2 Emerging technologies
- 3.10 Patent Landscape
- 3.11 Trade statistics
( Note: the trade statistics will be provided for key countries only
- 3.11.1 Major importing countries
- 3.11.2 Major exporting countries
- 3.12 Sustainability and Environmental Aspects
- 3.12.1 Sustainable Practices
- 3.12.2 Waste Reduction Strategies
- 3.12.3 Energy Efficiency in Production
- 3.12.4 Eco-friendly Initiatives
- 3.13 Carbon Footprint Considerations
Chapter 4 Competitive Landscape, 2024
- 4.1 Introduction
- 4.2 Company market share analysis
- 4.2.1 By region
- 4.2.1.1 North America
- 4.2.1.2 Europe
- 4.2.1.3 Asia Pacific
- 4.2.1.4 LATAM
- 4.2.1.5 MEA
- 4.2.1 By region
- 4.3 Company matrix analysis
- 4.4 Competitive analysis of major market players
- 4.5 Competitive positioning matrix
- 4.6 Key developments
- 4.6.1 Mergers & acquisitions
- 4.6.2 Partnerships & collaborations
- 4.6.3 New Product Launches
- 4.7 Expansion Plans
Chapter 5 Market Estimates and Forecast, By Production Method, 2021 – 2034 (USD Billion) (Tons)
- 5.1 Key trends
- 5.2 Synthetic production
- 5.3 By-product production
- 5.3.1 Caprolactam production
- 5.3.2 Coke oven operations
- 5.3.3 Methyl methacrylate production
- 5.3.4 Other by-product sources
Chapter 6 Market Estimates and Forecast, By Product Form, 2021 – 2034 (USD Billion) (Tons)
- 6.1 Key trends
- 6.2 Solid
- 6.2.1 Granular
- 6.2.2 Crystalline
- 6.3 Liquid
Chapter 7 Market Estimates and Forecast, By Purity Grade, 2021 – 2034 (USD Billion) (Tons)
- 7.1 Key trends
- 7.2 Standard grade (≤99%)
- 7.3 High purity grade (>99%)
Chapter 8 Market Estimates and Forecast, By Application, 2021 – 2034 (USD Billion) (Tons)
- 8.1 Key trends
- 8.2 Fertilizers
- 8.2.1 Straight fertilizers
- 8.2.2 Compound fertilizers
- 8.2.3 Specialty fertilizers
- 8.3 Industrial applications
- 8.3.1 Textile industry
- 8.3.2 Water treatment
- 8.3.3 Food additives
- 8.3.4 Flame retardants
- 8.3.5 Chemical manufacturing
- 8.3.6 Others
- 8.4 Pharmaceutical
- 8.5 Others
Chapter 9 Market Estimates and Forecast, By Region, 2021 – 2034 (USD Billion) (Tons)
- 9.1 Key trends
- 9.2 North America
- 9.2.1 U.S.
- 9.2.2 Canada
- 9.3 Europe
- 9.3.1 Germany
- 9.3.2 UK
- 9.3.3 France
- 9.3.4 Spain
- 9.3.5 Italy
- 9.3.6 Rest of Europe
- 9.4 Asia Pacific
- 9.4.1 China
- 9.4.2 India
- 9.4.3 Japan
- 9.4.4 Australia
- 9.4.5 South Korea
- 9.4.6 Rest of Asia Pacific
- 9.5 Latin America
- 9.5.1 Brazil
- 9.5.2 Mexico
- 9.5.3 Argentina
- 9.5.4 Rest of Latin America
- 9.6 Middle East and Africa
- 9.6.1 Saudi Arabia
- 9.6.2 South Africa
- 9.6.3 UAE
- 9.6.4 Rest of Middle East and Africa
Chapter 10 Company Profiles
- 10.1 BASF SE
- 10.2 AdvanSix Inc.
- 10.3 CF Industries Holdings, Inc.
- 10.4 Domo Chemicals GmbH
- 10.5 Domo Engineering Plastics US
- 10.6 EuroChem Group AG
- 10.7 Evonik Industries AG
- 10.8 Grupa Azoty S.A.
- 10.9 Helm AG
- 10.10 Honeywell International Inc.
- 10.11 JSC Kuibyshevazot
- 10.12 Lanxess AG
- 10.13 Novus International, Inc.
- 10.14 Nutrien Ltd.
- 10.15 OCI N.V.
- 10.16 Ostchem Holding
- 10.17 Sinopec
- 10.18 Sumitomo Chemical Co., Ltd.
- 10.19 Ube Industries, Ltd.
- 10.20 Yara International ASA
 全球硫酸铵市场:按类型、应用和地区划分-预测至2030年
 2026年全球硫酸铵市场报告
 2025-2029年全球硫酸铵市场
 硫酸铵:全球市占率及排名、总销售额及需求预测(2025-2031 年)
 硫酸铵市场-全球产业规模、份额、趋势、机会和预测(按产品、应用、地区和竞争细分,2020-2030 年)
 硝酸铈铵市场报告(按类型(中和法、转化法)、应用(实验室化学品、光掩模、液晶显示器等)和地区)2025-2033
 硫酸铵市场报告:2031 年趋势、预测与竞争分析
 硫酸铵市场:市场分析与预测至 2033 年 - 按类型、按产品、按应用、按形式、按材料类型、按最终用户、按流程、按技术、按解决方案
 全球硫酸铵市场:市场规模、份额、趋势分析(按最终用途、按应用、按地区)、细分市场预测(2025-2030 年)
 硫酸铵市场规模、份额、成长分析,按类型、应用、地区 - 产业预测,2025-2032