


 |
市场调查报告书
商品编码
1766274
生物活性成分市场机会、成长动力、产业趋势分析及 2025 - 2034 年预测Bioactive Ingredients Market Opportunity, Growth Drivers, Industry Trend Analysis, and Forecast 2025 - 2034 |
||||||
2024年,全球生物活性成分市场规模达1,275亿美元,预计2034年将以7.9%的复合年增长率成长,达到2,799亿美元。生物活性成分是食品、补充剂和个人护理产品中天然存在的化合物,其健康益处远超基本营养。这些成分包括多酚、益生菌、ω-3脂肪酸、植物萃取物和膳食纤维,有助于增强免疫力、促进消化和整体健康。消费者对健康保健意识的不断提升、向预防性医疗保健的转变以及对清洁标籤功能性产品日益增长的需求,共同推动着生物活性成分市场的扩张。
绿色萃取方法的技术进步也提高了生物活性成分的功效和永续性,进一步推动了市场成长。这些创新技术,例如超临界流体萃取、超音波辅助萃取和酵素辅助萃取,不仅提高了产量和纯度,还保留了多酚和欧米伽脂肪酸等热敏性化合物的完整性。这确保了成分在最终应用中具有更高的生物利用度和更佳的功能性能。此外,绿色萃取最大限度地减少了有害溶剂的使用,降低了对环境的影响,这与产业向清洁标籤和环保生产的转变相契合。因此,製造商越来越多地采用这些先进的方法,以满足监管要求和消费者对安全、天然和永续健康保健解决方案日益增长的需求。
| 市场范围 | |
|---|---|
| 起始年份 | 2024 |
| 预测年份 | 2025-2034 |
| 起始值 | 1275亿美元 |
| 预测值 | 2799亿美元 |
| 复合年增长率 | 7.9% |
2024年,脂肪酸市场占19.1%,价值243亿美元。该细分市场的主导地位得益于消费者对脂肪酸日益增长的需求,脂肪酸以其对心臟健康、认知功能和抗发炎支持等益处而闻名。压力、疲劳、消化问题和维生素缺乏等与生活方式相关的健康状况日益普遍,促使消费者寻求预防性医疗保健解决方案,从而推动了该细分市场的成长。
2024年,植物性来源市场占比58.3%,预计到2034年将以6.8%的复合年增长率快速成长。这种主导地位源于全球对清洁标籤、天然和纯素产品的需求不断增长,尤其是在功能性食品、补充剂和个人护理领域。水果和蔬菜、谷物和谷类、香草和香料、油籽和豆类都是植物性生物活性物质的来源。这些成分中含有的抗氧化剂、维生素、多酚和纤维具有抗发炎、抗衰老和增强免疫力等健康益处。
2024年,亚太生物活性成分市场占38.8%的市占率。中国、印度和日本是亚太地区的主要贡献者,其成长主要得益于消费者健康意识的提升、快速的城市化进程以及功能性食品和补充剂行业日益普及。政府支持营养补充剂的政策、日益增长的老龄化人口以及对植物性、草药和传统医药基生物活性成分的高需求,进一步推动了市场的发展。疫情过后,对增强免疫力的补充剂的需求不断增加,从而引发了人们对功能性食品和营养保健品的浓厚兴趣。
全球生物活性成分市场的主要参与者包括FMC Corporation、Ingredion Incorporated、Mazza Innovation Ltd.、Roquette、Sabinsa Corporation、Archer Daniels Midland、Cargill、BASF SE、Ajinomoto Co.和Arla Foods。这些公司专注于产品创新、策略合作伙伴关係以及扩大全球影响力,以巩固其市场地位。生物活性成分市场中的公司正在采取多项关键策略来增强其影响力。产品创新是一项主要策略,在研发方面投入大量资金,从而推出新产品,以满足食品饮料、膳食补充剂和个人护理等各个终端用户行业对功能性成分日益增长的需求。
策略合作伙伴关係和收购也日益盛行,使企业能够扩大产品组合和市场覆盖范围。例如,与区域合作伙伴的合作使企业能够进入新兴市场并利用当地专业知识。此外,企业正专注于永续发展,采用绿色萃取技术并负责任地采购原材料,以满足消费者对天然和有机产品日益增长的需求。
目录
第一章:方法论与范围
第二章:执行摘要
第三章:行业洞察
- 产业生态系统分析
- 供应商概况
- 利润率
- 每个阶段的增值
- 影响价值链的因素
- 中断
- 产业衝击力
- 成长动力
- 产业陷阱与挑战
- 市场机会
- 成长潜力分析
- 监管格局
- 北美洲
- 欧洲
- 亚太地区
- 拉丁美洲
- 中东和非洲
- 波特的分析
- PESTEL分析
- 价格趋势
- 按地区
- 按产品
- 未来市场趋势
- 技术和创新格局
- 当前的技术趋势
- 新兴技术
- 专利态势
- 贸易统计(HS编码)(註:仅提供重点国家的贸易统计资料)
- 主要进口国
- 主要出口国
- 永续性和环境方面
- 永续实践
- 减少废弃物的策略
- 生产中的能源效率
- 环保倡议
第四章:竞争格局
- 介绍
- 公司市占率分析
- 按地区
- 北美洲
- 欧洲
- 亚太地区
- 拉丁美洲
- MEA
- 按地区
- 公司矩阵分析
- 主要市场参与者的竞争分析
- 竞争定位矩阵
- 关键进展
- 併购
- 伙伴关係与合作
- 新产品发布
- 扩张计划
第五章:市场估计与预测:依产品类型,2021 - 2034 年
- 主要趋势
- 多酚
- 单一维生素
- 黄酮类化合物
- 酚酸
- 木脂素
- 芪类
- 其他的
- 类胡萝卜素
- β-胡萝卜素
- 叶黄素
- 番茄红素
- 虾红素
- 其他的
- 益生元
- 接骨木
- 低聚果糖
- 低聚半乳糖
- 菊粉
- 其他的
- 益生菌
- 乳酸桿菌
- 双歧桿菌
- 链球菌
- 其他的
- 脂肪酸
- Omega-3脂肪酸
- Omega-6脂肪酸
- 其他的
- 蛋白质和胺基酸
- 植物基
- 动物性
- 生物活性胜肽
- 维生素
- 矿物质
- 纤维
- 其他的
第六章:市场估计与预测:按来源,2021 - 2034 年
- 主要趋势
- 植物基
- 水果和蔬菜
- 谷物和谷类
- 香草和香料
- 油籽和豆类
- 其他的
- 动物性
- 乳製品
- 肉类和鱼类
- 蛋
- 其他的
- 微生物
- 细菌
- 真菌
- 藻类
- 其他的
- 海洋
- 海藻
- 鱼
- 其他的
- 其他的
第七章:市场估计与预测:按应用,2021 - 2034 年
- 主要趋势
- 食品和饮料
- 功能性食品
- 功能性饮料
- 烘焙和糖果
- 乳製品
- 肉类和家禽产品
- 其他的
- 膳食补充剂
- 片剂和胶囊
- 粉末
- 液体
- 其他的
- 製药
- 口服製剂
- 外用製剂
- 其他的
- 化妆品和个人护理
- 保养品
- 护髮
- 其他的
- 动物营养
- 其他的
第 8 章:市场估计与预测:按提取技术,2021 年至 2034 年
- 主要趋势
- 常规提取方法
- 溶剂萃取
- 浸渍
- 渗滤
- 其他的
- 先进的萃取方法
- 表面流体萃取(SFE)
- 加压液体萃取(PLE)
- 微波辅助萃取(MAE)
- 超音波辅助萃取(UAE)
- 酵素辅助萃取
- 其他的
- 绿色萃取技术
- 深共熔溶剂(DES)
- 天然深层共熔溶剂(NADES)
- 其他的
- 其他的
第九章:市场估计与预测:按地区,2021 - 2034 年
- 主要趋势
- 北美洲
- 我们
- 加拿大
- 欧洲
- 德国
- 英国
- 法国
- 西班牙
- 义大利
- 荷兰
- 亚太地区
- 中国
- 印度
- 日本
- 澳洲
- 韩国
- 拉丁美洲
- 巴西
- 墨西哥
- 阿根廷
- 中东和非洲
- 沙乌地阿拉伯
- 南非
- 阿联酋
第十章:公司简介
- Nestle SA
- Fonterra Co-operative Group
- Arla Foods
- FrieslandCampina
- Glanbia Nutritionals
- Davisco Foods International
- DSM
- Cargill, Inc.
- Archer Daniels Midland Company
- DuPont
- BASF SE
- Ajinomoto Co., Inc.
- Chr. Hansen Holding A/S
- Kerry Group
- Ingredion Incorporated
- Tate & Lyle PLC
- Koninklijke DSM NV
- Roquette Freres
- Symrise AG
- Givaudan
- Naturex (now part of Givaudan)
- Frutarom (now part of IFF)
- Kemin Industries
- Kalsec Inc.
- Dohler GmbH
- Diana Group (now part of Symrise)
- Mazza Innovation Ltd.
- Sabinsa Corporation
- Indena SpA
- Martin Bauer Group
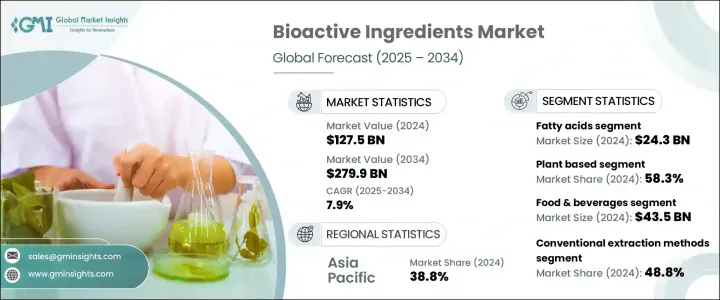
The Global Bioactive Ingredients Market was valued at USD 127.5 billion in 2024 and is estimated to grow at a CAGR of 7.9% to reach USD 279.9 billion by 2034. Bioactive ingredients are naturally occurring compounds found in foods, supplements, and personal care products that offer health benefits beyond basic nutrition. These include polyphenols, probiotics, omega-3 fatty acids, plant extracts, and fibers, which support immunity, digestion, and overall wellness. The market's expansion is driven by increasing consumer awareness of health and wellness, a shift toward preventive healthcare, and a growing demand for clean-label, functional products.
Technological advancements in green extraction methods have also enhanced the efficacy and sustainability of bioactive ingredients, further fueling market growth. These innovative techniques-such as supercritical fluid extraction, ultrasound-assisted extraction, and enzyme-assisted extraction-not only improve yield and purity but also preserve the integrity of heat-sensitive compounds like polyphenols and omega fatty acids. This ensures higher bioavailability and better functional performance of the ingredients in end-use applications. Moreover, green extraction minimizes the use of harmful solvents and reduces environmental impact, aligning well with the industry's shift toward clean-label, eco-friendly production. As a result, manufacturers are increasingly adopting these advanced methods to meet regulatory requirements and growing consumer demand for safe, natural, and sustainable health and wellness solutions.
| Market Scope | |
|---|---|
| Start Year | 2024 |
| Forecast Year | 2025-2034 |
| Start Value | $127.5 Billion |
| Forecast Value | $279.9 Billion |
| CAGR | 7.9% |
The fatty acids segment accounted for a 19.1% share in 2024, valued at USD 24.3 billion. This segment's dominance is attributed to rising consumer demand for these fatty acids, known for their benefits in heart health, cognitive function, and anti-inflammatory support. The increasing prevalence of lifestyle-related health conditions such as stress, fatigue, digestive issues, and vitamin deficiencies has led consumers to seek preventive healthcare solutions, thereby boosting this segment's growth.
Plant-based sources segment made up 58.3% share in 2024 and is expected to grow at a faster rate of 6.8% CAGR through 2034. This dominance is due to the rising global demand for clean-label, natural, and vegan products, especially in functional foods, supplements, and personal care. Fruits and vegetables, cereals and grains, herbs and spices, and oilseeds and pulses are among the sources of plant-based bioactives. Antioxidants, vitamins, polyphenols, and fibers present in these ingredients offer health benefits such as anti-inflammatory, anti-aging, and immunity-boosting properties.
Asia Pacific Bioactive Ingredients Market held a 38.8% share in 2024. China, India, and Japan are the leading contributors within the Asia Pacific region, with growth driven by rising consumer health awareness, rapid urbanization, and increasing popularity of functional foods and the supplement industry. Government policies supporting nutritional supplements, a growing aging population, and high demand for plant-based, herbal, and traditional medicine-based bioactives have further propelled the market. Post-pandemic, there has been an increased demand for immunity-enhancing supplements, leading to greater interest in functional foods and nutraceuticals.
Key players in the Global Bioactive Ingredients Market include FMC Corporation, Ingredion Incorporated, Mazza Innovation Ltd., Roquette, Sabinsa Corporation, Archer Daniels Midland, Cargill, BASF SE, Ajinomoto Co., and Arla Foods. These companies are focusing on product innovation, strategic partnerships, and expanding their global presence to strengthen their position in the market. Companies in the Bioactive Ingredients Market are adopting several key strategies to strengthen their presence. Product innovation is a primary tactic, with significant investments in research and development leading to the launch of new products that cater to the growing demand for functional ingredients across various end-user industries like food & beverage, dietary supplements, and personal care.
Strategic partnerships and acquisitions are also prevalent, allowing companies to expand their product portfolios and market reach. For instance, collaborations with regional partners enable companies to tap into emerging markets and leverage local expertise. Additionally, companies are focusing on sustainability by adopting green extraction technologies and sourcing raw materials responsibly to meet the increasing consumer demand for natural and organic products.
Table of Contents
Chapter 1 Methodology & Scope
- 1.1 Market scope and definition
- 1.2 Research design
- 1.2.1 Research approach
- 1.2.2 Data collection methods
- 1.3 Data mining sources
- 1.3.1 Global
- 1.3.2 Regional/Country
- 1.4 Base estimates and calculations
- 1.4.1 Base year calculation
- 1.4.2 Key trends for market estimation
- 1.5 Primary research and validation
- 1.5.1 Primary sources
- 1.6 Forecast model
- 1.7 Research assumptions and limitations
Chapter 2 Executive Summary
- 2.1 Industry 360° synopsis
- 2.2 Key market trends
- 2.2.1 Regional
- 2.2.2 Product
- 2.2.3 End Use
- 2.3 TAM Analysis, 2025-2034
- 2.4 CXO perspectives: Strategic imperatives
- 2.4.1 Executive decision points
- 2.4.2 Critical success factors
- 2.5 Future Outlook and Strategic Recommendations
Chapter 3 Industry Insights
- 3.1 Industry ecosystem analysis
- 3.1.1 Supplier Landscape
- 3.1.2 Profit Margin
- 3.1.3 Value addition at each stage
- 3.1.4 Factor affecting the value chain
- 3.1.5 Disruptions
- 3.2 Industry impact forces
- 3.2.1 Growth drivers
- 3.2.2 Industry pitfalls and challenges
- 3.2.3 Market opportunities
- 3.3 Growth potential analysis
- 3.4 Regulatory landscape
- 3.4.1 North America
- 3.4.2 Europe
- 3.4.3 Asia Pacific
- 3.4.4 Latin America
- 3.4.5 Middle East & Africa
- 3.5 Porter's analysis
- 3.6 PESTEL analysis
- 3.6.1 Technology and innovation landscape
- 3.6.2 Current technological trends
- 3.6.3 Emerging technologies
- 3.7 Price trends
- 3.7.1 By region
- 3.7.2 By product
- 3.8 Future market trends
- 3.9 Technology and innovation landscape
- 3.9.1 Current technological trends
- 3.9.2 Emerging technologies
- 3.10 Patent Landscape
- 3.11 Trade statistics (HS code) (Note: the trade statistics will be provided for key countries only)
- 3.11.1 Major importing countries
- 3.11.2 Major exporting countries
- 3.12 Sustainability and environmental aspects
- 3.12.1 Sustainable practices
- 3.12.2 Waste reduction strategies
- 3.12.3 Energy efficiency in production
- 3.12.4 Eco-friendly Initiatives
Chapter 4 Competitive Landscape, 2024
- 4.1 Introduction
- 4.2 Company market share analysis
- 4.2.1 By region
- 4.2.1.1 North America
- 4.2.1.2 Europe
- 4.2.1.3 Asia Pacific
- 4.2.1.4 LATAM
- 4.2.1.5 MEA
- 4.2.1 By region
- 4.3 Company matrix analysis
- 4.4 Competitive analysis of major market players
- 4.5 Competitive positioning matrix
- 4.6 Key developments
- 4.6.1 Mergers & acquisitions
- 4.6.2 Partnerships & collaborations
- 4.6.3 New Product Launches
- 4.6.4 Expansion Plans
Chapter 5 Market Estimates and Forecast, By Product Type, 2021 - 2034 (USD Million) (Kilo Tons)
- 5.1 Key trends
- 5.2 Polyphenols
- 5.2.1 Single vitamins
- 5.2.2 Flavonoids
- 5.2.3 Phenolic acids
- 5.2.4 Lignans
- 5.2.5 Stilbenes
- 5.2.6 Others
- 5.3 Carotenoids
- 5.3.1 Beta-carotene
- 5.3.2 Lutein
- 5.3.3 Lycopene
- 5.3.4 Astaxanthin
- 5.3.5 Others
- 5.4 Prebiotics
- 5.4.1 Elderberry
- 5.4.2 Fructo-oligosaccharides
- 5.4.3 Galacto-oligosaccharides
- 5.4.4 Inulin
- 5.4.5 Others
- 5.5 Probiotics
- 5.5.1 Lactobacillus
- 5.5.2 Bifidobacterium
- 5.5.3 Streptococcus
- 5.5.4 Others
- 5.6 Fatty Acids
- 5.6.1 Omega-3 fatty acids
- 5.6.2 Omega-6 fatty acids
- 5.6.3 Others
- 5.7 Proteins & Amino Acids
- 5.7.1 Plant-based
- 5.7.2 Animal-based
- 5.7.3 Bioactive Peptides
- 5.8 Vitamins
- 5.9 Minerals
- 5.10 Fibres
- 5.11 Others
Chapter 6 Market Estimates and Forecast, By Source, 2021 - 2034 (USD Million) (Kilo Tons)
- 6.1 Key trends
- 6.2 Plant based
- 6.2.1 Fruits & vegetables
- 6.2.2 Cereals & grains
- 6.2.3 Herbs & spices
- 6.2.4 Oilseeds & pulses
- 6.2.5 Others
- 6.3 Animal based
- 6.3.1 Dairy products
- 6.3.2 Meat & fish
- 6.3.3 Eggs
- 6.3.4 Others
- 6.4 Microbial
- 6.4.1 Bacteria
- 6.4.2 Fungi
- 6.4.3 Algae
- 6.4.4 Others
- 6.5 Marine
- 6.5.1 Seaweed
- 6.5.2 Fish
- 6.5.3 Others
- 6.6 Others
Chapter 7 Market Estimates and Forecast, By Application, 2021 - 2034 (USD Million) (Kilo Tons)
- 7.1 Key trends
- 7.2 Food & Beverages
- 7.2.1 Functional foods
- 7.2.2 Functional beverages
- 7.2.3 Bakery & confectionery
- 7.2.4 Dairy products
- 7.2.5 Meat & poultry products
- 7.2.6 Others
- 7.3 Dietary Supplements
- 7.3.1 Tablets & capsules
- 7.3.2 Powders
- 7.3.3 Liquid
- 7.3.4 Others
- 7.4 Pharmaceuticals
- 7.4.1 Oral formulations
- 7.4.2 Topical formulations
- 7.4.3 Others
- 7.5 Cosmetics & personal care
- 7.5.1 Skincare
- 7.5.2 Haircare
- 7.5.3 Others
- 7.6 Animal Nutrition
- 7.7 Others
Chapter 8 Market Estimates and Forecast, By Extraction Technology, 2021 - 2034 (USD Million) (Kilo Tons)
- 8.1 Key trends
- 8.2 Convention extraction methods
- 8.2.1 Solvent extraction
- 8.2.2 Maceration
- 8.2.3 Percolation
- 8.2.4 Others
- 8.3 Advanced extraction methods
- 8.3.1 Superficial fluid extraction (SFE)
- 8.3.2 Pressurized liquid extraction (PLE)
- 8.3.3 Microwave assisted extraction (MAE)
- 8.3.4 Ultrasound assisted extraction (UAE)
- 8.3.5 Enzyme assisted extraction
- 8.3.6 Others
- 8.4 Green extraction technologies
- 8.4.1 Deep eutectic solvents (DES)
- 8.4.2 Natural deep eutectic solvents (NADES)
- 8.4.3 Others
- 8.5 Others
Chapter 9 Market Estimates and Forecast, By Region, 2021 - 2034 (USD Million) (Kilo Tons)
- 9.1 Key trends
- 9.2 North America
- 9.2.1 U.S.
- 9.2.2 Canada
- 9.3 Europe
- 9.3.1 Germany
- 9.3.2 UK
- 9.3.3 France
- 9.3.4 Spain
- 9.3.5 Italy
- 9.3.6 Netherlands
- 9.4 Asia Pacific
- 9.4.1 China
- 9.4.2 India
- 9.4.3 Japan
- 9.4.4 Australia
- 9.4.5 South Korea
- 9.5 Latin America
- 9.5.1 Brazil
- 9.5.2 Mexico
- 9.5.3 Argentina
- 9.6 Middle East and Africa
- 9.6.1 Saudi Arabia
- 9.6.2 South Africa
- 9.6.3 UAE
Chapter 10 Company Profiles
- 10.1 Nestle S.A.
- 10.2 Fonterra Co-operative Group
- 10.3 Arla Foods
- 10.4 FrieslandCampina
- 10.5 Glanbia Nutritionals
- 10.6 Davisco Foods International
- 10.7 DSM
- 10.8 Cargill, Inc.
- 10.9 Archer Daniels Midland Company
- 10.10 DuPont
- 10.11 BASF SE
- 10.12 Ajinomoto Co., Inc.
- 10.13 Chr. Hansen Holding A/S
- 10.14 Kerry Group
- 10.15 Ingredion Incorporated
- 10.16 Tate & Lyle PLC
- 10.17 Koninklijke DSM N.V.
- 10.18 Roquette Freres
- 10.19 Symrise AG
- 10.20 Givaudan
- 10.21 Naturex (now part of Givaudan)
- 10.22 Frutarom (now part of IFF)
- 10.23 Kemin Industries
- 10.24 Kalsec Inc.
- 10.25 Dohler GmbH
- 10.26 Diana Group (now part of Symrise)
- 10.27 Mazza Innovation Ltd.
- 10.28 Sabinsa Corporation
- 10.29 Indena S.p.A.
- 10.30 Martin Bauer Group


