


 |
市场调查报告书
商品编码
1766275
化妆品生物活性成分市场机会、成长动力、产业趋势分析及 2025 - 2034 年预测Cosmetic Bioactive Ingredients Market Opportunity, Growth Drivers, Industry Trend Analysis, and Forecast 2025 - 2034 |
||||||
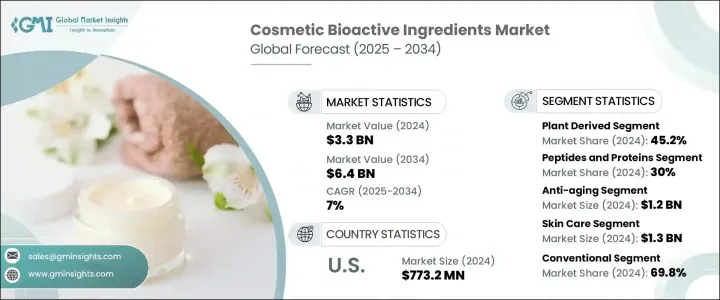
2024年,全球化妆品生物活性成分市场规模达33亿美元,预计2034年将以7%的复合年增长率成长,达到64亿美元。这一增长主要源于对多功能个人护理产品日益增长的需求,这些产品能够显着改善肌肤和秀髮。生物活性成分因其精准的生物效应——增强保湿、焕发光彩、紧緻肌肤、延缓衰老以及抵御环境压力——而成为现代化妆品配方中不可或缺的一部分。随着消费者越来越注重成分,并寻求功效得到验证的产品,生物活性成分的作用也变得越来越重要。消费者对清洁美容、永续性和实证功效的追求也在重塑化妆品配方的发展方式。封装和微递送系统等新技术正在提升这些成分的稳定性和吸收率。
在护肤和护髮领域,生物活性化合物正被用于解决特定问题,使品牌在竞争激烈且快速发展的市场中脱颖而出。这些成分能够针对老化、干燥、色素沉着、敏感和头皮失衡等问题提供针对性解决方案,帮助配方师打造出效果显着、科学可靠的产品。随着消费者越来越重视个人化照护和成分透明度,品牌纷纷转向胜肽、神经酰胺、植物干细胞、海洋萃取物和微生物友善成分等生物活性成分,以建立信任并提升功效。高性能生物活性成分的整合不仅提升了产品吸引力,也支持了纯净美妆的定位,使品牌在吸引大众和高端细分市场中註重健康、注重效果的消费者方面拥有战略优势。
| 市场范围 | |
|---|---|
| 起始年份 | 2024 |
| 预测年份 | 2025-2034 |
| 起始值 | 33亿美元 |
| 预测值 | 64亿美元 |
| 复合年增长率 | 7% |
植物成分占45.2%的市场份额,预计到2034年将以7.2%的复合年增长率成长。由于其天然来源、功能多样性以及抗氧化、抗炎和舒缓肌肤的功效,植物成分的受欢迎程度持续上升。包括海洋植物萃取物在内的植物成分因其消费者吸引力和安全性而越来越多地被融入个人护理产品中。发酵和胜肽合成等功能性过程进一步提高了天然化合物的精准度和功效,从而催生出更具针对性且效果显着的护肤解决方案。
2024年,胜肽类和蛋白质类产品占据30%的市场份额,预计到2034年将以7%的复合年增长率稳定成长。这些成分因其再生能力,是抗衰老配方的基础。胜肽类产品能够刺激胶原蛋白生成,并透过作用于细胞层面来提升肌肤弹性,从而帮助减少皱纹,恢復肌肤紧緻。生物工程胜肽类和载体蛋白因其精准的功效而备受青睐,能够为消费者带来更有效率、更个人化的益处。其功效和在皮肤科学领域日益增长的声誉,使其继续成为化妆品创新领域的高价值成分。
2024年,北美化妆品生物活性成分市场规模达7.732亿美元,预计2034年复合年增长率将达5.4%。美国市场凭藉其成熟的美容和个人护理行业、高人均消费以及对科学和功效型产品的强烈偏好而脱颖而出。消费者积极寻求透明度和临床支援的配方。对胜肽、抗氧化剂和植物萃取物等成分的需求激增,正在推动市场向前发展。整体健康和抗衰老趋势,加上强大的研发管道和积极的产品推广,正在巩固美国作为全球市场关键驱动力的地位。
该行业的领先公司包括科莱恩股份公司 (Clariant AG)、亚什兰全球控股公司 (Ashland Global Holdings Inc.)、BioSpectrum 公司、Active Concepts LLC 和巴斯夫欧洲公司 (BASF SE)。为了提升竞争优势,化妆品生物活性成分领域的公司正在部署一系列策略措施。这些措施包括大力投资研发,以创新高性能、以科学为依据的成分,满足不断变化的消费者偏好。许多公司正在透过加入符合清洁美容价值观的天然来源和永续成分来扩展其产品组合。与化妆品品牌和皮肤病学机构的合作有助于验证功效声明并扩大市场范围。此外,该公司正在采用奈米封装等先进加工技术来提高成分稳定性和生物利用度。区域扩张、定製配方和遵守监管标准正在进一步加强其全球影响力。
目录
第一章:方法论
- 市场范围和定义
- 研究设计
- 研究方法
- 资料收集方法
- 资料探勘来源
- 全球的
- 地区/国家
- 基础估算与计算
- 基准年计算
- 市场评估的主要趋势
- 初步研究和验证
- 主要来源
- 预测模型
- 研究假设和局限性
第二章:执行摘要
第三章:行业洞察
- 产业生态系统分析
- 供应商概况
- 利润率
- 每个阶段的增值
- 影响价值链的因素。
- 中断
- 产业衝击力
- 成长动力
- 产业陷阱与挑战
- 市场机会
- 成长潜力分析
- 监管格局
- 北美洲
- 欧洲
- 亚太地区
- 拉丁美洲
- 中东和非洲
- 波特的分析
- PESTEL分析
- 价格趋势
- 按地区
- 按产品
- 未来市场趋势
- 技术和创新格局
- 当前的技术趋势
- 新兴技术
- 专利格局
- 贸易统计(HS编码)
(註:仅提供重点国家的贸易统计数据
- 主要进口国
- 主要出口国
- 永续性和环境方面
- 永续实践
- 减少废弃物的策略
- 生产中的能源效率
- 环保倡议
- 碳足迹考量
- 原料分析
- 植物衍生材料
- 海洋衍生材料
- 生物技术衍生材料
- 动物源性材料
- 原物料采购挑战
- 可持续性考虑
- 萃取和加工技术
- 传统萃取方法
- 绿色萃取技术
- 生物技术生产
- 酵素法萃取
- 超临界流体萃取
- 超音波辅助萃取
- 品质控制和测试
- 配销通路分析
- 直销
- 分销商/批发商
- 网路零售
- 专业供应商
- 技术创新与进步
- 新型萃取技术
- 先进的输送系统
- 封装技术
- 生物技术应用
- 人工智慧在成分发现的应用
第四章:竞争格局
- 介绍
- 公司市占率分析
- 按地区
- 北美洲
- 欧洲
- 亚太地区
- 拉丁美洲
- MEA
- 按地区
- 公司矩阵分析
- 主要市场参与者的竞争分析
- 竞争定位矩阵
- 关键进展
- 併购
- 伙伴关係与合作
- 新产品发布
- 扩张计划
第五章:市场估计与预测:按来源,2021 - 2034 年
- 主要趋势
- 植物衍生
- 草药和植物药
- 水果和蔬菜
- 种子和油
- 其他的
- 海洋衍生
- 藻类和海藻
- 鱼和鱼副产品
- 海洋微生物
- 其他的
- 生物技术衍生
- 发酵产品
- 工程胜肽
- 其他的
- 动物源性
- 胶原蛋白和明胶
- 蜂蜜和蜂胶
- 其他的
第六章:市场估计与预测:按类型,2021 - 2034 年
- 主要趋势
- 抗氧化剂
- 多酚
- 类胡萝卜素
- 维生素
- 其他的
- 胜肽和蛋白质
- 胶原蛋白胜肽
- 信号肽
- 载体胜肽
- 酵素抑制胜肽
- 其他的
- 多醣
- 玻尿酸
- 藻酸盐
- 壳聚醣
- 其他的
- 脂质和脂肪酸
- Omega-3脂肪酸
- 神经酰胺
- 磷脂
- 其他的
- 酵素
- 蛋白酶
- 脂肪酶
- 其他的
- 维生素和矿物质
- 维生素A
- 维生素C
- 维生素E
- 其他的
- 其他的
第七章:市场估计与预测:按应用,2021 - 2034 年
- 主要趋势
- 抗衰老
- 使肌肤亮丽明亮。
- 防紫外线
- 保湿补水
- 抗痤疮
- 头髮护理
- 其他的
第八章:市场估计与预测:依最终用途,2021 - 2034 年
- 主要趋势
- 皮肤护理
- 脸部护理
- 身体护理
- 防晒护理
- 其他的
- 头髮护理
- 洗髮精和护髮素
- 髮油和精华素
- 染髮剂
- 其他的
- 化妆品和彩妆
- 脸部化妆
- 眼妆
- 唇部产品
- 其他的
- 香水
- 口腔护理
- 其他的
第九章:市场估计与预测:依功能,2021-2034
- 主要趋势
- 传统的
- 胶囊
- 脂质体
- 囊泡
- 微乳液
- 固体脂质奈米颗粒
- 其他的
第十章:市场估计与预测:按地区,2021 - 2034 年
- 主要趋势
- 北美洲
- 我们
- 加拿大
- 欧洲
- 德国
- 英国
- 法国
- 义大利
- 西班牙
- 欧洲其他地区
- 亚太地区
- 中国
- 印度
- 日本
- 澳洲
- 韩国
- 亚太其他地区
- 拉丁美洲
- 巴西
- 墨西哥
- 阿根廷
- 拉丁美洲其他地区
- 中东和非洲
- 沙乌地阿拉伯
- 南非
- 阿联酋
- 中东和非洲其他地区
第 11 章:公司简介
- Active Concepts LLC
- Ashland Global Holdings Inc.
- BASF SE
- BioSpectrum, Inc.
- Clariant AG
- Codif Technologie Naturelle
- Croda International Plc
- Evonik Industries AG
- Gattefosse SAS
- Givaudan SA
- Laboratoires Expanscience
- Lipotec SAU
- Lonza Group
- Lucas Meyer Cosmetics (IFF)
- Mibelle Biochemistry
- Provital Group
- Seppic SA
- Silab
- Symrise AG
- Vytrus Biotech
The Global Cosmetic Bioactive Ingredients Market was valued at USD 3.3 billion in 2024 and is estimated to grow at a CAGR of 7% to reach USD 6.4 billion by 2034. This growth is fueled by rising demand for multifunctional personal care products that deliver visible skin and hair improvements. Bioactive ingredients are integral to modern cosmetic formulations due to their targeted biological effects-enhancing hydration, promoting radiance, firming the skin, reversing signs of aging, and defending against environmental stressors. As consumers become more ingredient-conscious and seek products offering proven efficacy, the role of bioactives has become increasingly important. The shift toward clean beauty, sustainability, and evidence-backed performance is also reshaping how formulations are developed. New technologies like encapsulation and micro-delivery systems are advancing the stability and absorption of these ingredients.
In both skincare and haircare, bioactive compounds are being leveraged to address specific concerns, allowing brands to differentiate themselves in a competitive and rapidly evolving landscape. These ingredients enable targeted solutions for issues such as aging, dryness, pigmentation, sensitivity, and scalp imbalances, helping formulators create products that offer visible, science-backed results. As consumers increasingly prioritize personalized care and ingredient transparency, brands are turning to bioactives like peptides, ceramides, plant stem cells, marine extracts, and microbiome-friendly agents to build trust and deliver efficacy. The integration of high-performance bioactives not only elevates product appeal but also supports clean beauty positioning, giving brands a strategic advantage in appealing to health-conscious, results-driven consumers across both mass and premium segments.
| Market Scope | |
|---|---|
| Start Year | 2024 |
| Forecast Year | 2025-2034 |
| Start Value | $3.3 Billion |
| Forecast Value | $6.4 Billion |
| CAGR | 7% |
The plant-based ingredients segment held 45.2% share and is projected to grow at a CAGR of 7.2% through 2034. Their popularity continues to rise due to their natural origin, functional versatility, and effectiveness in delivering antioxidant, anti-inflammatory, and skin-soothing benefits. Botanical elements, including marine and plant extracts, are increasingly integrated into personal care products because of their consumer appeal and perceived safety. Functional processes such as fermentation and peptide synthesis are further enhancing the precision and performance of natural compounds, giving rise to more targeted skincare solutions with measurable results.
The peptides and proteins segment held a 30% share in 2024 and is forecast to grow at a steady 7% CAGR by 2034. These ingredients are fundamental to anti-aging formulations due to their regenerative capabilities. Peptides stimulate collagen production and improve elasticity by acting at the cellular level, helping reduce wrinkles and restore skin firmness. Bioengineered peptides and carrier proteins are particularly favored for their ability to deliver targeted action, giving consumers more potent and personalized benefits. Their effectiveness and growing reputation in dermal science continue to position them as high-value components in cosmetic innovation.
North America Cosmetic Bioactive Ingredients Market generated USD 773.2 million in 2024 and is expected to see a 5.4% CAGR through 2034. The U.S. market stands out due to its mature beauty and personal care sector, high per capita spending, and strong inclination toward scientific and performance-driven products. Consumers are actively seeking transparency and clinically supported formulations. A surge in demand for ingredients such as peptides, antioxidants, and botanical extracts is propelling the market forward. The trend toward holistic wellness and anti-aging, along with robust R&D pipelines and aggressive product rollouts, is cementing the U.S. as a key driver in the global market.
Leading companies in this industry include Clariant AG, Ashland Global Holdings Inc., BioSpectrum, Inc., Active Concepts LLC, and BASF SE. To enhance their competitive positioning, companies in the cosmetic bioactive ingredients space are deploying a range of strategic measures. These include investing heavily in research and development to innovate high-performance, science-backed ingredients that meet evolving consumer preferences. Many firms are expanding their portfolios by incorporating naturally sourced and sustainable ingredients that align with clean beauty values. Collaborations with cosmetic brands and dermatological institutes help validate efficacy claims and expand market reach. Additionally, companies are adopting advanced processing technologies like nano-encapsulation to improve ingredient stability and bioavailability. Regional expansion, customized formulations, and compliance with regulatory standards are further strengthening their global footprint.
Table of Contents
Chapter 1 Methodology
- 1.1 Market scope and definition
- 1.2 Research design
- 1.2.1 Research approach
- 1.2.2 Data collection methods
- 1.3 Data mining sources
- 1.3.1 Global
- 1.3.2 Regional/Country
- 1.4 Base estimates and calculations
- 1.4.1 Base year calculation
- 1.4.2 Key trends for market estimation
- 1.5 Primary research and validation
- 1.5.1 Primary sources
- 1.6 Forecast model
- 1.7 Research assumptions and limitations
Chapter 2 Executive Summary
- 2.1 Industry 3600 synopsis
- 2.2 Key market trends
- 2.2.1 Regional
- 2.2.2 Sources
- 2.2.3 Type
- 2.2.4 Application
- 2.2.5 End use
- 2.2.6 Function
- 2.3 TAM Analysis, 2025-2034
- 2.4 CXO perspectives: Strategic imperatives
- 2.4.1 Executive decision points
- 2.4.2 Critical success factors
- 2.5 Future Outlook and Strategic Recommendations
Chapter 3 Industry Insights
- 3.1 Industry ecosystem analysis
- 3.1.1 Supplier Landscape
- 3.1.2 Profit Margin
- 3.1.3 Value addition at each stage
- 3.1.4 Factor affecting the value chain.
- 3.1.5 Disruptions
- 3.2 Industry impact forces
- 3.2.1 Growth drivers
- 3.2.2 Industry pitfalls and challenges
- 3.2.3 Market opportunities
- 3.3 Growth potential analysis
- 3.4 Regulatory landscape
- 3.4.1 North America
- 3.4.2 Europe
- 3.4.3 Asia Pacific
- 3.4.4 Latin America
- 3.4.5 Middle East & Africa
- 3.5 Porter's analysis
- 3.6 PESTEL analysis
- 3.7 Price trends
- 3.7.1 By region
- 3.7.2 By product
- 3.8 Future market trends
- 3.9 Technology and innovation landscape
- 3.9.1 Current technological trends
- 3.9.2 Emerging technologies
- 3.10 Patent landscape
- 3.11 Trade statistics (HS code)
( Note: the trade statistics will be provided for key countries only
- 3.11.1 Major importing countries
- 3.11.2 Major exporting countries
- 3.12 Sustainability and environmental aspects
- 3.12.1 Sustainable practices
- 3.12.2 Waste reduction strategies
- 3.12.3 Energy efficiency in production
- 3.12.4 Eco-friendly initiatives
- 3.13 Carbon Footprint Considerations
- 3.14 Raw material analysis
- 3.14.1 Plant-derived materials
- 3.14.2 Marine-derived materials
- 3.14.3 Biotechnology-derived materials
- 3.14.4 Animal-derived materials
- 3.14.5 Raw material sourcing challenges
- 3.14.6 Sustainability considerations
- 3.15 Extraction & processing technologies
- 3.15.1 Conventional extraction methods
- 3.15.2 Green extraction technologies
- 3.15.3 Biotechnological production
- 3.15.4 Enzymatic extraction
- 3.15.5 Supercritical fluid extraction
- 3.15.6 Ultrasonic-assisted extraction
- 3.15.7 Quality control and testing
- 3.16 Distribution channel analysis
- 3.16.1 Direct sales
- 3.16.2 Distributors/wholesalers
- 3.16.3 Online retail
- 3.16.4 Specialty suppliers
- 3.17 Technological innovations and advancements
- 3.17.1 Novel extraction techniques
- 3.17.2 Advanced delivery systems
- 3.17.3 Encapsulation technologies
- 3.17.4 Biotechnology applications
- 3.17.5 Artificial intelligence in ingredient discovery
Chapter 4 Competitive Landscape, 2024
- 4.1 Introduction
- 4.2 Company market share analysis
- 4.2.1 By region
- 4.2.1.1 North America
- 4.2.1.2 Europe
- 4.2.1.3 Asia Pacific
- 4.2.1.4 LATAM
- 4.2.1.5 MEA
- 4.2.1 By region
- 4.3 Company matrix analysis
- 4.4 Competitive analysis of major market players
- 4.5 Competitive positioning matrix
- 4.6 Key developments
- 4.6.1 Mergers & acquisitions
- 4.6.2 Partnerships & collaborations
- 4.6.3 New product launches
- 4.6.4 Expansion plans
Chapter 5 Market Estimates & Forecast, By Source, 2021 - 2034 (USD Million) (Kilo Tons)
- 5.1 Key trend
- 5.2 Plant-derived
- 5.2.1 Herbs and botanicals
- 5.2.2 Fruits and vegetables
- 5.2.3 Seeds and oils
- 5.2.4 Others
- 5.3 Marine-derived
- 5.3.1 Algae and seaweed
- 5.3.2 Fish and fish by-products
- 5.3.3 Marine microorganisms
- 5.3.4 Others
- 5.4 Biotechnology-derived
- 5.4.1 Fermentation products
- 5.4.2 Engineered peptides
- 5.4.3 Others
- 5.5 Animal-derived
- 5.5.1 Collagen and gelatin
- 5.5.2 Honey and propolis
- 5.5.3 Others
Chapter 6 Market Estimates & Forecast, By Type, 2021 - 2034 (USD Million) (Kilo Tons)
- 6.1 Key trend
- 6.2 Antioxidants
- 6.2.1 Polyphenols
- 6.2.2 Carotenoids
- 6.2.3 Vitamins
- 6.2.4 Others
- 6.3 Peptides and proteins
- 6.3.1 Collagen peptides
- 6.3.2 Signal peptides
- 6.3.3 Carrier peptides
- 6.3.4 Enzyme inhibitor peptides
- 6.3.5 Others
- 6.4 Polysaccharides
- 6.4.1 Hyaluronic acid
- 6.4.2 Alginates
- 6.4.3 Chitosan
- 6.4.4 Others
- 6.5 Lipids and fatty acids
- 6.5.1 Omega-3 fatty acids
- 6.5.2 Ceramides
- 6.5.3 Phospholipids
- 6.5.4 Others
- 6.6 Enzymes
- 6.6.1 Proteases
- 6.6.2 Lipases
- 6.6.3 Others
- 6.7 Vitamins and minerals
- 6.7.1 Vitamin A
- 6.7.2 Vitamin C
- 6.7.3 Vitamin E
- 6.7.4 Others
- 6.8 Others
Chapter 7 Market Estimates & Forecast, By Application, 2021 - 2034 (USD Million) (Kilo Tons)
- 7.1 Key trend
- 7.2 Anti-aging
- 7.3 Skin brightening & lightening.
- 7.4 UV protection
- 7.5 Moisturizing & hydration
- 7.6 Anti-acne
- 7.7 Hair care
- 7.8 Others
Chapter 8 Market Estimates & Forecast, By End Use, 2021 - 2034 (USD Million) (Kilo Tons)
- 8.1 Key trend
- 8.2 Skin care
- 8.2.1 Facial care
- 8.2.2 Body care
- 8.2.3 Sun care
- 8.2.4 Others
- 8.3 Hair care
- 8.3.1 Shampoos & conditioners
- 8.3.2 Hair oils & serums
- 8.3.3 Hair colorants
- 8.3.4 Others
- 8.4 Make-up & color cosmetics
- 8.4.1 Face make-up
- 8.4.2 Eye make-up
- 8.4.3 Lip products
- 8.4.4 Others
- 8.5 Fragrances
- 8.6 Oral Care
- 8.7 Others
Chapter 9 Market Estimates & Forecast, By Function, 2021 -2034 (USD Million) (Kilo Tons)
- 9.1 Key trend
- 9.2 Conventional
- 9.3 Encapsulated
- 9.3.1 Liposomes
- 9.3.2 Niosomes
- 9.3.3 Microemulsions
- 9.3.4 Solid Lipid Nanoparticles
- 9.3.5 Others
Chapter 10 Market Estimates & Forecast, By Region, 2021 - 2034 (USD Million) (Kilo Tons)
- 10.1 Key trends
- 10.2 North America
- 10.2.1 U.S.
- 10.2.2 Canada
- 10.3 Europe
- 10.3.1 Germany
- 10.3.2 UK
- 10.3.3 France
- 10.3.4 Italy
- 10.3.5 Spain
- 10.3.6 Rest of Europe
- 10.4 Asia Pacific
- 10.4.1 China
- 10.4.2 India
- 10.4.3 Japan
- 10.4.4 Australia
- 10.4.5 South Korea
- 10.4.6 Rest of Asia Pacific
- 10.5 Latin America
- 10.5.1 Brazil
- 10.5.2 Mexico
- 10.5.3 Argentina
- 10.5.4 Rest of Latin America
- 10.6 Middle East & Africa
- 10.6.1 Saudi Arabia
- 10.6.2 South Africa
- 10.6.3 UAE
- 10.6.4 Rest of Middle East & Africa
Chapter 11 Company Profiles
- 11.1 Active Concepts LLC
- 11.2 Ashland Global Holdings Inc.
- 11.3 BASF SE
- 11.4 BioSpectrum, Inc.
- 11.5 Clariant AG
- 11.6 Codif Technologie Naturelle
- 11.7 Croda International Plc
- 11.8 Evonik Industries AG
- 11.9 Gattefosse SAS
- 11.10 Givaudan SA
- 11.11 Laboratoires Expanscience
- 11.12 Lipotec S.A.U.
- 11.13 Lonza Group
- 11.14 Lucas Meyer Cosmetics (IFF)
- 11.15 Mibelle Biochemistry
- 11.16 Provital Group
- 11.17 Seppic SA
- 11.18 Silab
- 11.19 Symrise AG
- 11.20 Vytrus Biotech
 全球复杂生物酵素产品市场(按应用、酵素类别、剂型、最终用户和分销管道划分)预测(2026-2032年)
 角鲨烷基乳化剂市场规模、份额和成长分析:按产品类型、配方类型、最终用途、分销管道和地区划分-2026-2033年产业预测
 2026年全球生物基消毒剂市场报告
 生物基泡棉市场分析及预测(至2035年):依类型、产品类型、应用、技术、材料类型、最终用户、製程、功能、安装类型划分
 2026-2034年全球生物基油衍生产品市场规模、份额、趋势和成长分析报告2026年全球生物化学市场报告
 藻类衍生化学品市场机会、成长要素、产业趋势分析及2026年至2035年预测
 生物催化丙烯酰胺(BioACM)市场-全球产业规模、份额、趋势、机会、预测:按应用、地区和竞争格局划分,2021-2031年泡壳包装回收市场:依树脂类型、回收製程、收集管道和应用划分,全球预测(2026-2032年)生物基渗透油市场按产品类型、终端用户产业和分销管道划分-2026-2032年全球预测