


 |
市场调查报告书
商品编码
1766348
蓝氢市场机会、成长动力、产业趋势分析及 2025 - 2034 年预测Blue Hydrogen Market Opportunity, Growth Drivers, Industry Trend Analysis, and Forecast 2025 - 2034 |
||||||
2024年,全球蓝氢市场规模达23亿美元,预计2034年将以10.4%的复合年增长率成长,达到68亿美元。能源多元化和能源安全日益受到重视,这加速了蓝氢的生产,尤其得益于其能够利用现有天然气基础设施大规模生产氢气,同时保持相对较低的碳强度。随着工业领域减排压力日益增大,蓝氢的应用,尤其是在能源密集产业,正蓬勃发展。与氢气设施结合的碳捕获与封存 (CCS) 解决方案,在钢铁、合成氨和炼油等领域实现气候目标方面发挥着至关重要的作用。此外,蓝氢基础设施具有可扩展性,使其成为可行的长期工业脱碳策略。
随着跨境合作的不断发展,国际伙伴关係预计将透过在区域和全球供应链中提供低碳氢化合物燃料,进一步加速市场发展。这些合作投资为推动清洁能源计画奠定了坚实的基础。支持性的政策框架和充足的天然气供应正在推动蓝氢生产的扩张。利用现有的管道和储存系统也为减排难度较高的产业创造了一条经济的脱碳途径。各国政府支持碳捕获和清洁氢能政策,并持续激励全球工业运作中采用这些技术。
| 市场范围 | |
|---|---|
| 起始年份 | 2024 |
| 预测年份 | 2025-2034 |
| 起始值 | 23亿美元 |
| 预测值 | 68亿美元 |
| 复合年增长率 | 10.4% |
预计2025年至2034年,石油炼製领域的复合年增长率将达到8.1%。为减少炼油作业的碳足迹,对低排放氢气的需求仍然强劲。更严格的环境法规正促使下游业者将蓝氢纳入其排放合规策略。随着生产商寻求使用更清洁的替代燃料来实现营运的现代化和麵向未来,这些发展预计将在未来几年内提升该领域的份额。
预计2025年至2034年间,ATR细分市场的复合年增长率将达到24.8%,这主要得益于其与碳捕集技术的出色兼容性以及高效生产高纯度氢气的能力。与传统的重整製程不同,ATR将部分氧化和蒸汽重整结合在一个反应器中,使其更易于与CCS系统整合。这种双功能方法提高了製程效率,使ATR成为大型低碳氢气设施的首选。
2024年,美国蓝氢市场规模达10.2亿美元。北美占了54.4%的份额。这一区域主导地位得益于全球范围内合作伙伴关係的加强和旨在建立高效氢氨出口走廊的基础设施建设。这些国际合作正在帮助美国透过提高生产能力和强化供应链,扩大其在全球氢能经济中的地位。
蓝氢市场的主要参与者包括 BP、Woodside、蒂森克虏伯工业解决方案、庄信万丰、Maire Tecnimont、Saipem、壳牌、SK E&S、TOPSOE、Technip Energies、埃尼、Bechtel Corporation、液化空气集团、埃克森美孚公司、约翰伍德集团、空气产品公司和 Equinor。为了扩大市场份额和加强竞争地位,蓝氢领域的主要参与者正在部署一系列策略性措施。这些措施包括组成全球合资企业和合作伙伴关係,共同开发碳捕获和低排放氢气分配的基础设施。一些公司正在用先进的 CCS 技术改造现有的天然气工厂,以快速、经济高效地扩大生产规模。其他公司则专注于政府合作,以获得监管支持、资金和长期合约。技术创新仍然是核心,人们正在持续进行研发投资,以提高製程效率并降低生产的碳强度。
目录
第一章:方法论与范围
第二章:执行摘要
第三章:行业洞察
- 产业生态系统
- 监管格局
- 产业衝击力
- 成长动力
- 产业陷阱与挑战
- 成长潜力分析
- 波特的分析
- PESTEL分析
第四章:竞争格局
- 介绍
- 公司市占率
- 战略仪表板
- 策略倡议
- 竞争基准测试
- 创新与永续发展格局
第五章:市场规模及预测:依应用,2021 - 2034
- 主要趋势
- 石油炼油厂
- 化学
- 其他的
第六章:市场规模及预测:依技术分类,2021 - 2034 年
- 主要趋势
- 小型磁共振
- ATR
- 部分氧化
第七章:市场规模及预测:依地区,2021 - 2034
- 主要趋势
- 北美洲
- 我们
- 加拿大
- 墨西哥
- 欧洲
- 德国
- 法国
- 英国
- 义大利
- 俄罗斯
- 亚太地区
- 中国
- 印度
- 日本
- 澳洲
- 中东和非洲
- 沙乌地阿拉伯
- 阿曼
- 阿联酋
- 科威特
- 卡达
- 南非
- 拉丁美洲
第八章:公司简介
- Air Products
- Air Liquide
- Bechtel Corporation
- BP
- Eni
- Exxon Mobil Corporation
- Equinor
- John Wood Group
- Johnson Matthey
- MaireTecnimont
- Saipem
- SK E&S
- Shell
- Technip Energies
- TOPSOE
- thyssenkrupp Industrial Solutions
- Woodside
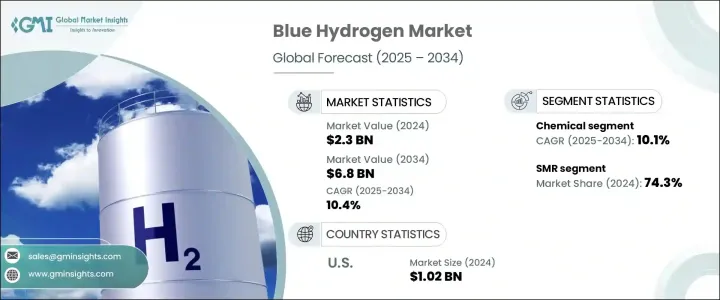
The Global Blue Hydrogen Market was valued at USD 2.3 billion in 2024 and is estimated to grow at a CAGR of 10.4% to reach USD 6.8 billion by 2034. The rising focus on energy diversification and enhanced energy security is accelerating blue hydrogen production, particularly due to its ability to generate hydrogen at scale using existing natural gas infrastructure while keeping carbon intensity relatively low. With mounting pressure on industries to reduce emissions, the use of blue hydrogen-especially in energy-intensive sectors-is gaining momentum. Carbon capture and storage (CCS) solutions integrated with hydrogen facilities are playing a vital role in meeting climate objectives in segments like steel, ammonia, and oil refining. Additionally, blue hydrogen infrastructure is scalable, making it a viable long-term strategy for industrial decarbonization.
As cross-border collaborations grow, international partnerships are expected to further accelerate market development by delivering low-carbon hydrogen fuels across regional and global supply chains. These collaborative investments serve as a strong foundation for advancing clean energy initiatives. Supportive policy frameworks and an abundant supply of natural gas are encouraging the expansion of blue hydrogen production. Utilizing existing pipelines and storage systems also creates an economical pathway to decarbonize sectors where emission reductions are particularly challenging. Governments backing carbon capture and clean hydrogen policies continue to incentivize adoption in industrial operations globally.
| Market Scope | |
|---|---|
| Start Year | 2024 |
| Forecast Year | 2025-2034 |
| Start Value | $2.3 Billion |
| Forecast Value | $6.8 Billion |
| CAGR | 10.4% |
The petroleum refining segment is forecasted to grow at a CAGR of 8.1% from 2025 to 2034. Demand for lower-emission hydrogen to reduce carbon footprints in refining operations remains strong. Stricter environmental regulations are pushing downstream operators to integrate blue hydrogen as part of their emissions compliance strategies. These developments are expected to enhance the segment's share in the coming years as producers look to modernize and future-proof operations using cleaner fuel alternatives.
The ATR segment is projected to grow at a CAGR of 24.8% between 2025 and 2034, primarily due to its exceptional compatibility with carbon capture technologies and its ability to produce high-purity hydrogen efficiently. Unlike conventional reforming processes, ATR combines partial oxidation and steam reforming in a single reactor, making it more adaptable for integration with CCS systems. This dual-function approach enhances process efficiency and makes ATR a preferred choice for large-scale, low-carbon hydrogen production facilities.
United States Blue Hydrogen Market was valued at USD 1.02 billion in 2024. North America accounted for 54.4% of the share in 2024. This regional dominance is underpinned by the growth of global-scale partnerships and infrastructure developments geared toward establishing efficient hydrogen-ammonia export corridors. These international collaborations are helping the U.S. expand its role in the global hydrogen economy by increasing production capabilities and strengthening supply chains.
Leading participants in the Blue Hydrogen Market include BP, Woodside, ThyssenKrupp Industrial Solutions, Johnson Matthey, Maire Tecnimont, Saipem, Shell, SK E&S, TOPSOE, Technip Energies, Eni, Bechtel Corporation, Air Liquide, Exxon Mobil Corporation, John Wood Group, Air Products, and Equinor. To expand market share and reinforce their competitive standing, major players in the blue hydrogen sector are deploying a range of strategic initiatives. These include forming global joint ventures and partnerships to co-develop infrastructure for carbon capture and low-emission hydrogen distribution. Several companies are retrofitting existing natural gas plants with advanced CCS technologies to scale production quickly and cost-effectively. Others are focusing on government collaborations to secure regulatory support, funding, and long-term contracts. Technological innovation also remains central, with continuous R&D investments being made to improve process efficiency and reduce the carbon intensity of production.
Table of Contents
Chapter 1 Methodology & Scope
- 1.1 Research design
- 1.2 Base estimates & calculations
- 1.3 Forecast calculation
- 1.4 Primary research & validation
- 1.4.1 Primary sources
- 1.4.2 Data mining sources
- 1.5 Market definitions
Chapter 2 Executive Summary
- 2.1 Industry synopsis, 2021 - 2034
Chapter 3 Industry Insights
- 3.1 Industry ecosystem
- 3.2 Regulatory landscape
- 3.3 Industry impact forces
- 3.3.1 Growth drivers
- 3.3.2 Industry pitfalls & challenges
- 3.4 Growth potential analysis
- 3.5 Porter's analysis
- 3.5.1 Bargaining power of suppliers
- 3.5.2 Bargaining power of buyers
- 3.5.3 Threat of new entrants
- 3.5.4 Threat of substitutes
- 3.6 PESTEL analysis
Chapter 4 Competitive landscape, 2024
- 4.1 Introduction
- 4.2 Company market share
- 4.3 Strategic dashboard
- 4.4 Strategic initiatives
- 4.5 Competitive benchmarking
- 4.6 Innovation & sustainability landscape
Chapter 5 Market Size and Forecast, By Application, 2021 - 2034 (USD Billion & MT)
- 5.1 Key trends
- 5.2 Petroleum refinery
- 5.3 Chemical
- 5.4 Others
Chapter 6 Market Size and Forecast, By Technology, 2021 - 2034 (USD Billion & MT)
- 6.1 Key trends
- 6.2 SMR
- 6.3 ATR
- 6.4 Partial oxidation
Chapter 7 Market Size and Forecast, By Region, 2021 - 2034 (USD Billion & MT)
- 7.1 Key trends
- 7.2 North America
- 7.2.1 U.S.
- 7.2.2 Canada
- 7.2.3 Mexico
- 7.3 Europe
- 7.3.1 Germany
- 7.3.2 France
- 7.3.3 UK
- 7.3.4 Italy
- 7.3.5 Russia
- 7.4 Asia Pacific
- 7.4.1 China
- 7.4.2 India
- 7.4.3 Japan
- 7.4.4 Australia
- 7.5 Middle East & Africa
- 7.5.1 Saudi Arabia
- 7.5.2 Oman
- 7.5.3 UAE
- 7.5.4 Kuwait
- 7.5.5 Qatar
- 7.5.6 South Africa
- 7.6 Latin America
Chapter 8 Company Profiles
- 8.1 Air Products
- 8.2 Air Liquide
- 8.3 Bechtel Corporation
- 8.4 BP
- 8.5 Eni
- 8.6 Exxon Mobil Corporation
- 8.7 Equinor
- 8.8 John Wood Group
- 8.9 Johnson Matthey
- 8.10 MaireTecnimont
- 8.11 Saipem
- 8.12 SK E&S
- 8.13 Shell
- 8.14 Technip Energies
- 8.15 TOPSOE
- 8.16 thyssenkrupp Industrial Solutions
- 8.17 Woodside
 蓝氢市场:2026-2032年全球预测(依生产技术、供应模式、应用及最终用途产业划分)
 2026年全球蓝氢市场报告2034年全球蓝氢市场机会与策略
 蓝氢市场分析及预测(至2035年):类型、产品类型、技术、组件、应用、最终用户、製程、部署形式、解决方案与设施
 2026-2034年全球蓝氢市场规模、份额、趋势和成长分析报告2026年全球化学蓝氢市场报告蓝氢市场规模、占有率、成长及全球产业分析:依类型、应用和地区划分的洞察与预测(2026-2034)
 蓝色氢气市场-全球产业规模、份额、趋势、机会和预测,依技术、运输方式、应用、地区和竞争格局划分,2020-2030年预测
 蓝氢市场规模、份额和趋势分析报告:按应用、运输方式、技术、地区和细分市场预测,2025-2030 年
 青氢市场,占有率,规模,产业分析报告:各技术,各用途,运输模式别,各地区,2025年~2034年的市场预测