


 |
市场调查报告书
商品编码
1773418
影像增强器市场机会、成长动力、产业趋势分析及 2025 - 2034 年预测Image Intensifier Market Opportunity, Growth Drivers, Industry Trend Analysis, and Forecast 2025 - 2034 |
||||||
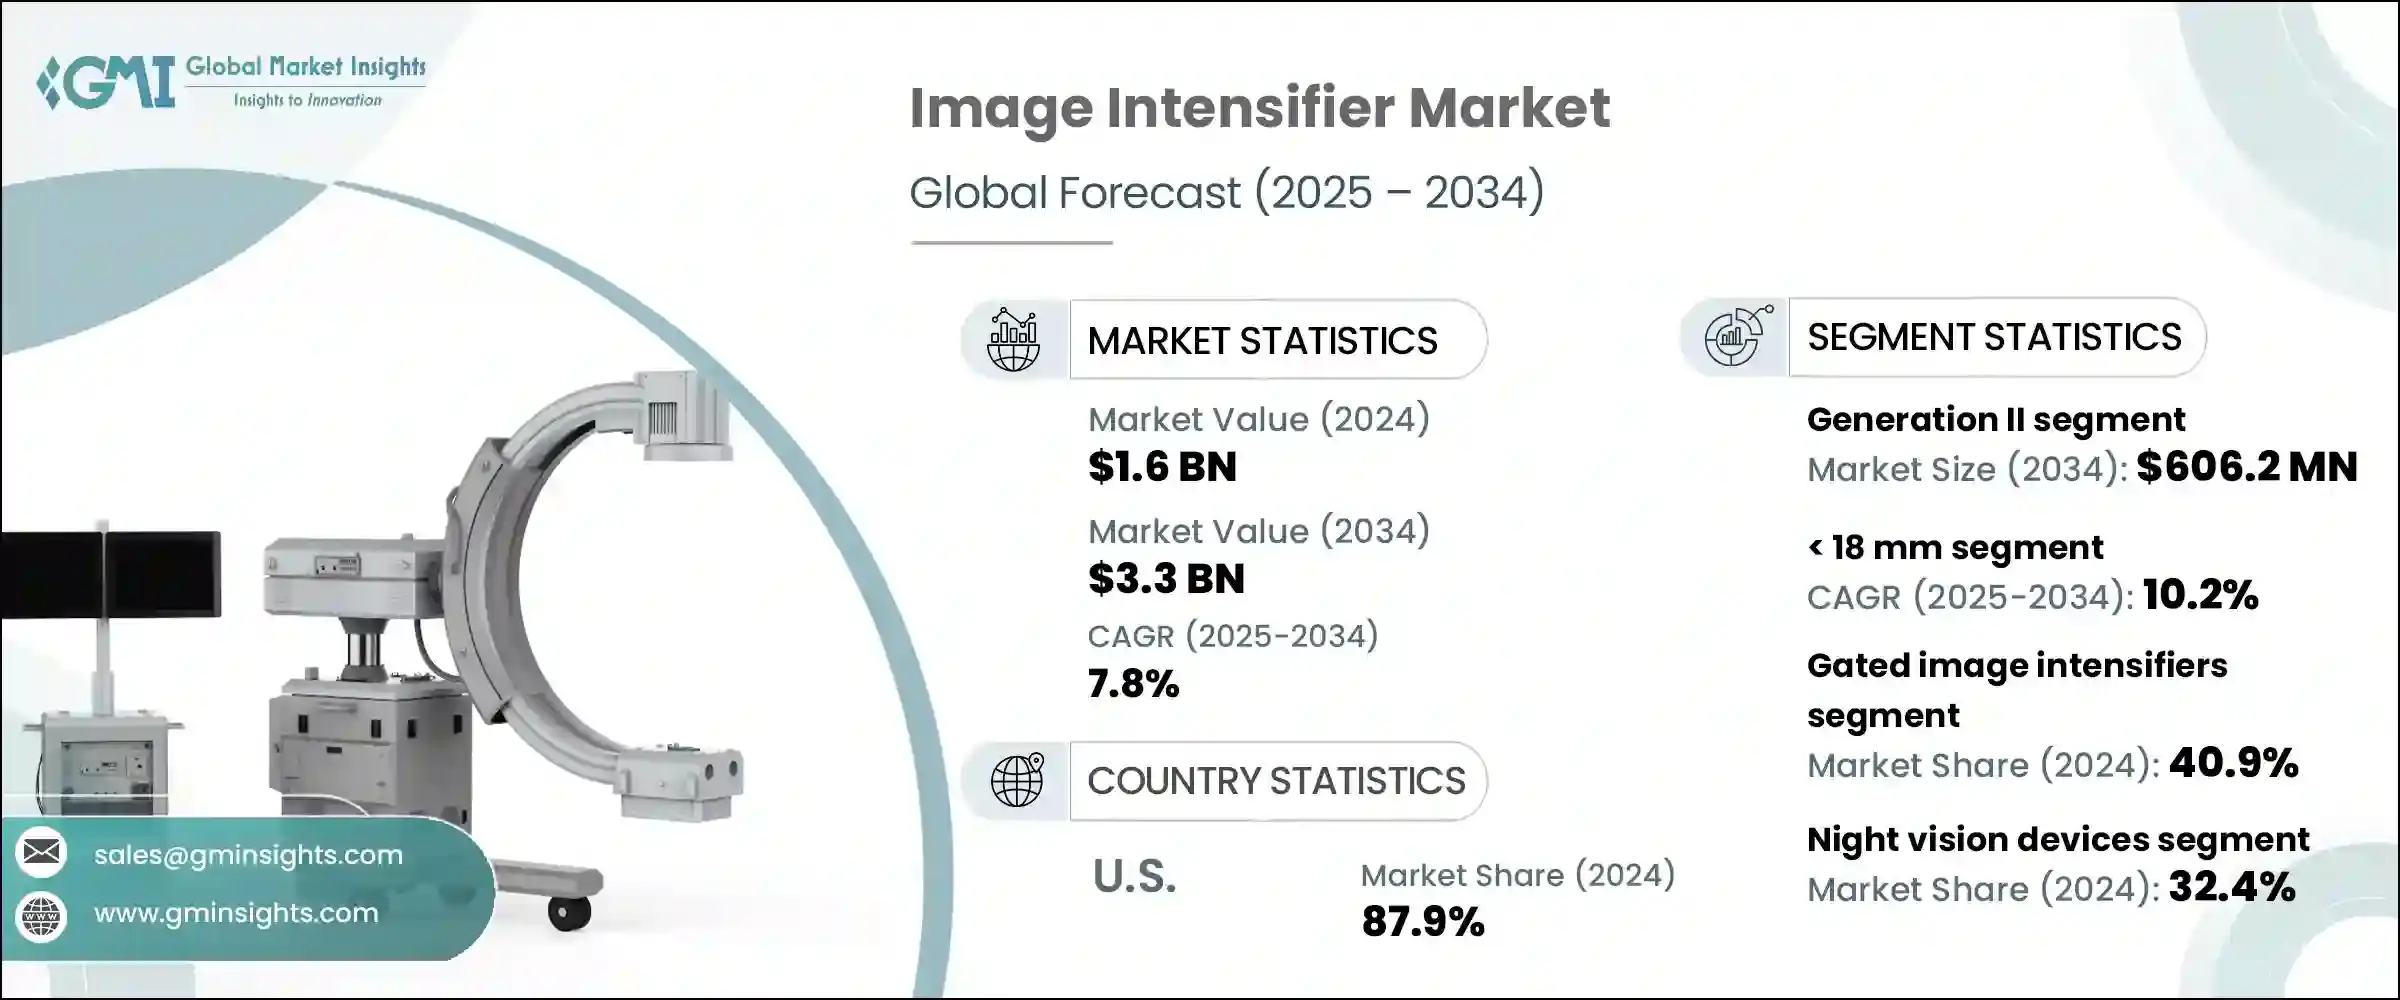
2024年,全球影像增强器市场规模达16亿美元,预计2034年将以7.8%的复合年增长率成长,达到33亿美元。该领域的成长主要得益于其在医学影像和国防相关应用领域的不断普及。由于影像增强器具有强大的即时成像能力、卓越的灵敏度和成本效益,萤光透视装置、介入放射学工具和C臂等医疗系统持续推动对这些设备的需求。由于医疗保健机构优先考虑价格合理的高品质成像,因此对影像增强器的需求持续保持高位。同时,各主要地区的军事和安全部队高度依赖影像增强器,以确保其在监视、侦察和目标捕获任务中的低光操作可靠性。
这些设备在边境监视和夜间行动中持续发挥关键作用,在这些行动中,低光照条件下的可靠可视性至关重要。随着地缘政治紧张局势加剧,各国优先考虑国防能力现代化,利用尖端技术增强战术基础设施的需求也日益迫切。影像增强器使部队能够全天候探测威胁、进行侦察并保持态势感知,确保战备状态和安全。它们能够在充满挑战的环境中提供清晰的即时影像,这对于旨在保护边境和关键资产,并在不断变化的衝突局势中保持战略优势的军事和安全机构来说,是必不可少的。
| 市场范围 | |
|---|---|
| 起始年份 | 2024 |
| 预测年份 | 2025-2034 |
| 起始值 | 16亿美元 |
| 预测值 | 33亿美元 |
| 复合年增长率 | 7.8% |
第三代影像增强器市场预计在2034年将以8.7%的复合年增长率成长。该系列以其先进的灵敏度和更清晰的成像而闻名,广泛应用于国防和医疗保健领域。它们在复杂和低能见度场景下的可靠性能,使其在对影像清晰度和速度要求极高的关键任务中更具吸引力。
预计到2034年,18毫米类别的复合年增长率将达到10.2%,成长最高。这些影像增强器设计紧凑轻巧,是可穿戴和便携式系统的理想选择,包括护目镜、手持式光学设备和头盔式装备。其小巧的尺寸和强大的性能使其非常适合战术和临床环境中的快速反应任务。
预计2034年中国影像增强器市场将以9.8%的复合年增长率成长。这一快速成长得益于政府加大对安防技术和医疗基础设施的投资。在国家鼓励减少进口依赖的政策推动下,影像系统的国产化发展势头强劲。军事采购和医院升级改造的需求将继续增强该地区的市场。
塑造影像增强器市场的主要产业参与者包括Canon、L3Harris、Elbit Systems、Hamamatsu Photonics、Argus、Dantec Dynamics 和 Harder Digital。为了提升市场地位,影像增强器产业的主要参与者正在大力投资研发,以开发更高解析度、使用寿命更长、低光性能更佳的先进技术。各公司正在寻求与医疗设备製造商签订军事合约并建立战略合作伙伴关係,以确保长期供应协议。此外,他们还专注于扩大区域製造中心,尤其是在亚太地区,以满足不断增长的需求并避免供应链中断。为了满足不断发展的国防和医疗应用需求,产品小型化和与穿戴式系统的整合被列为优先事项。
目录
第一章:方法论与范围
第二章:执行摘要
第三章:行业洞察
- 产业生态系统分析
- 供应商格局
- 利润率
- 成本结构
- 每个阶段的增值
- 影响价值链的因素
- 中断
- 产业衝击力
- 成长动力
- 国防和安全应用的持续需求
- 医学影像应用的成长
- 工业和汽车测试的扩展
- 与CMOS和CCD感测器集成
- 向数位成像的技术转变
- 产业陷阱与挑战
- 先进影像增强器设备成本高昂
- 固态影像技术竞争日益激烈
- 市场机会
- 成长动力
- 成长潜力分析
- 监管格局
- 北美洲
- 欧洲
- 亚太地区
- 拉丁美洲
- 中东和非洲
- 波特的分析
- PESTEL分析
- 技术和创新格局
- 当前的技术趋势
- 新兴技术
- 价格趋势
- 历史价格分析(2021-2024)
- 价格趋势驱动因素
- 区域价格差异
- 价格预测(2025-2034年)
- 定价策略
- 新兴商业模式
- 合规性要求
- 永续性措施
- 永续材料评估
- 碳足迹分析
- 循环经济实施
- 永续性认证和标准
- 永续性投资报酬率分析
- 全球消费者情绪分析
- 专利分析
第四章:竞争格局
- 介绍
- 公司市占率分析
- 按地区
- 北美洲
- 欧洲
- 亚太地区
- 市场集中度分析
- 按地区
- 关键参与者的竞争基准
- 财务绩效比较
- 收入
- 利润率
- 研发
- 产品组合比较
- 产品范围广度
- 科技
- 创新
- 地理位置比较
- 全球足迹分析
- 服务网路覆盖
- 各区域市场渗透率
- 竞争定位矩阵
- 领导者
- 挑战者
- 追踪者
- 利基市场参与者
- 战略展望矩阵
- 财务绩效比较
- 2021-2024 年关键发展
- 併购
- 伙伴关係和合作
- 技术进步
- 扩张和投资策略
- 永续发展倡议
- 数位转型倡议
- 新兴/新创企业竞争对手格局
第五章:市场估计与预测:依代数,2021-2034
- 主要趋势
- 第一代
- 第二代
- 第三代
第六章:市场估计与预测:按类型,2021-2034
- 主要趋势
- 门控影像增强器
- 非门控影像增强器
- 自动门控影像增强器
第七章:市场估计与预测:依直径,2021-2034
- 主要趋势
- < 18 毫米
- 18 毫米至 <25 毫米
- 25毫米至<37毫米
- ≥37毫米
第 8 章:市场估计与预测:按应用,2021 年至 2034 年
- 主要趋势
- 夜视设备
- 风镜
- 双筒望远镜
- 单筒望远镜
- 网路摄影系统
- 科学影像
- X射线影像
- 其他的
第九章:市场估计与预测:依最终用途产业,2021-2034 年
- 主要趋势
- 国防和安全
- 工业的
- 医疗的
- 其他的
第十章:市场估计与预测:按地区,2021 年至 2034 年
- 主要趋势
- 北美洲
- 我们
- 加拿大
- 欧洲
- 德国
- 英国
- 法国
- 西班牙
- 义大利
- 荷兰
- 亚太地区
- 中国
- 印度
- 日本
- 澳洲
- 韩国
- 拉丁美洲
- 巴西
- 墨西哥
- 阿根廷
- 中东和非洲
- 沙乌地阿拉伯
- 南非
- 阿联酋
第 11 章:公司简介
- Argus
- Aselsan
- Canon
- Dantec Dynamics
- Elbit Systems
- Hamamatsu Photonics
- Harder Digital
- Katod
- L3Harris Technologies
- Lambert Instruments
- Photek
- Photonis Technologies
- Siemens
The Global Image Intensifier Market was valued at USD 1.6 billion in 2024 and is estimated to grow at a CAGR of 7.8% to reach USD 3.3 billion by 2034. Growth in this sector is primarily fueled by expanding adoption in both medical imaging and defense-related applications. Medical systems such as fluoroscopy units, interventional radiology tools, and C-arms continue to drive demand for these devices, as image intensifiers provide strong real-time imaging capabilities, excellent sensitivity, and cost efficiency. As healthcare providers prioritize high-quality imaging with affordability, demand remains consistently high. Meanwhile, military and security forces across key regions rely heavily on image intensifiers for their low-light operational reliability in surveillance, reconnaissance, and target acquisition tasks.
These devices continue to play a critical role in border surveillance and night-time operations, where reliable visibility in low-light conditions is vital. As geopolitical tensions rise and countries prioritize the modernization of their defense capabilities, there is an increased urgency to enhance tactical infrastructure with cutting-edge technologies. Image intensifiers enable forces to detect threats, conduct reconnaissance, and maintain situational awareness around the clock, ensuring operational readiness and security. Their ability to deliver clear, real-time imagery in challenging environments makes them indispensable for military and security agencies aiming to protect borders, and critical assets, and maintain strategic advantages in evolving conflict scenarios.
| Market Scope | |
|---|---|
| Start Year | 2024 |
| Forecast Year | 2025-2034 |
| Start Value | $1.6 Billion |
| Forecast Value | $3.3 Billion |
| CAGR | 7.8% |
Generation III image intensifiers segment is expected to grow at a CAGR of 8.7% during 2034. Known for their advanced sensitivity and sharper imaging, this generation is widely used in defense and healthcare environments. Their dependable performance in complex and low-visibility scenarios continues to boost their appeal for critical missions where image clarity and speed are non-negotiable.
The 18 mm category segment is expected to see the highest growth at a CAGR of 10.2% through 2034. Designed to be compact and lightweight, these image intensifiers are ideal for wearable and portable systems including goggles, handheld optics, and helmet-mounted gear. Their small size and powerful performance make them extremely suitable for fast-response tasks in both tactical and clinical settings.
China Image Intensifier Market is projected to grow at a CAGR of 9.8% throughout 2034. This rapid rise is due to increased government investments in both security technologies and healthcare infrastructure. Domestic production of imaging systems is gaining strong momentum, backed by national policies encouraging reduced reliance on imports. Demand from both military procurement and hospital upgrades will continue to strengthen the market in this region.
Major industry players shaping the Image Intensifier Market include Canon, L3Harris, Elbit Systems, Hamamatsu Photonics, Argus, Dantec Dynamics, and Harder Digital. To enhance their market position, key players in the image intensifier industry are heavily investing in R&D to develop advanced generation technologies with higher resolution, longer lifespan, and better low-light performance. Companies are pursuing military contracts and strategic partnerships with healthcare equipment manufacturers to secure long-term supply deals. Additionally, they are focusing on expanding regional manufacturing hubs, especially in Asia-Pacific, to meet growing demand and avoid supply chain disruptions. Product miniaturization and integration into wearable systems are being prioritized to cater to evolving defense and medical applications.
Table of Contents
Chapter 1 Methodology and scope
- 1.1 Market scope and definition
- 1.2 Research design
- 1.2.1 Research approach
- 1.2.2 Data collection methods
- 1.3 Data mining sources
- 1.3.1 Global
- 1.3.2 Regional/Country
- 1.4 Base estimates and calculations
- 1.4.1 Base year calculation
- 1.4.2 Key trends for market estimation
- 1.5 Primary research and validation
- 1.5.1 Primary sources
- 1.6 Forecast model
- 1.7 Research assumptions and limitations
Chapter 2 Executive summary
- 2.1 Industry 360° synopsis
- 2.2 Key market trends
- 2.2.1 Product type
- 2.2.2 Wood type
- 2.2.3 Entry type
- 2.2.4 End use industry
- 2.2.5 Regional
- 2.3 TAM Analysis, 2025-2034 (USD Billion)
- 2.4 CXO perspectives: Strategic imperatives
- 2.4.1 Executive decision points
- 2.4.2 Critical success factors
- 2.5 Future outlook and strategic recommendations
Chapter 3 Industry insights
- 3.1 Industry ecosystem analysis
- 3.1.1 Supplier landscape
- 3.1.2 Profit margin
- 3.1.3 Cost structure
- 3.1.4 Value addition at each stage
- 3.1.5 Factor affecting the value chain
- 3.1.6 Disruptions
- 3.2 Industry impact forces
- 3.2.1 Growth drivers
- 3.2.1.1 Sustained demand in defense and security applications
- 3.2.1.2 Growth in medical imaging applications
- 3.2.1.3 Expansion in industrial and automotive testing
- 3.2.1.4 Integration with CMOS and CCD sensors
- 3.2.1.5 Technological shift toward digital imaging
- 3.2.2 Industry pitfalls and challenges
- 3.2.2.1 High cost of advanced image intensifier devices
- 3.2.2.2 Growing competition from solid-state imaging technologies
- 3.2.3 Market opportunities
- 3.2.1 Growth drivers
- 3.3 Growth potential analysis
- 3.4 Regulatory landscape
- 3.4.1 North America
- 3.4.2 Europe
- 3.4.3 Asia Pacific
- 3.4.4 Latin America
- 3.4.5 Middle East & Africa
- 3.5 Porter's analysis
- 3.6 PESTEL analysis
- 3.7 Technology and Innovation landscape
- 3.7.1 Current technological trends
- 3.7.2 Emerging technologies
- 3.8 Price trends
- 3.8.1 Historical price analysis (2021-2024)
- 3.8.2 Price trend drivers
- 3.8.3 Regional price variations
- 3.8.4 Price forecast (2025-2034)
- 3.9 Pricing strategies
- 3.10 Emerging business models
- 3.11 Compliance requirements
- 3.12 Sustainability measures
- 3.12.1 Sustainable materials assessment
- 3.12.2 Carbon footprint analysis
- 3.12.3 Circular economy implementation
- 3.12.4 Sustainability certifications and standards
- 3.12.5 Sustainability ROI analysis
- 3.13 Global consumer sentiment analysis
- 3.14 Patent analysis
Chapter 4 Competitive landscape, 2024
- 4.1 Introduction
- 4.2 Company market share analysis
- 4.2.1 By region
- 4.2.1.1 North America
- 4.2.1.2 Europe
- 4.2.1.3 Asia Pacific
- 4.2.2 Market concentration analysis
- 4.2.1 By region
- 4.3 Competitive benchmarking of key players
- 4.3.1 Financial performance comparison
- 4.3.1.1 Revenue
- 4.3.1.2 Profit margin
- 4.3.1.3 R&d
- 4.3.2 Product portfolio comparison
- 4.3.2.1 Product range breadth
- 4.3.2.2 Technology
- 4.3.2.3 Innovation
- 4.3.3 Geographic presence comparison
- 4.3.3.1 Global footprint analysis
- 4.3.3.2 Service network coverage
- 4.3.3.3 Market penetration by region
- 4.3.4 Competitive positioning matrix
- 4.3.4.1 Leaders
- 4.3.4.2 Challengers
- 4.3.4.3 Followers
- 4.3.4.4 Niche players
- 4.3.5 Strategic outlook matrix
- 4.3.1 Financial performance comparison
- 4.4 Key developments, 2021-2024
- 4.4.1 Mergers and acquisitions
- 4.4.2 Partnerships and collaborations
- 4.4.3 Technological advancements
- 4.4.4 Expansion and investment strategies
- 4.4.5 Sustainability initiatives
- 4.4.6 Digital transformation initiatives
- 4.5 Emerging/ startup competitors landscape
Chapter 5 Market Estimates & Forecast, By Generation,2021-2034 (USD Million & Thousand Units)
- 5.1 Key trends
- 5.2 Generation I
- 5.3 Generation II
- 5.4 Generation III
Chapter 6 Market Estimates & Forecast, By Type, 2021-2034 (USD Million & Thousand Units)
- 6.1 Key trends
- 6.2 Gated image intensifiers
- 6.3 Non-gated image intensifiers
- 6.4 Auto-gated image intensifiers
Chapter 7 Market Estimates & Forecast, By Diameter, 2021-2034 (USD Million & Thousand Units)
- 7.1 Key trends
- 7.2 < 18 mm
- 7.3 18 mm to <25 mm
- 7.4 25 mm to <37 mm
- 7.5 ≥ 37 mm
Chapter 8 Market Estimates & Forecast, By Application, 2021-2034 (USD Million & Thousand Units)
- 8.1 Key trends
- 8.2 Night vision devices
- 8.3 Goggles
- 8.4 Binoculars
- 8.5 Monoculars
- 8.6 Camera systems
- 8.7 Scientific imaging
- 8.8 X-ray imaging
- 8.9 Others
Chapter 9 Market Estimates & Forecast, By End Use Industry, 2021-2034 (USD Million & Thousand Units)
- 9.1 Key trends
- 9.2 Defense & security
- 9.3 Industrial
- 9.4 Medical
- 9.5 Others
Chapter 10 Market Estimates and Forecast, By Region, 2021 – 2034 (USD Million & Thousand Units)
- 10.1 Key trends
- 10.2 North America
- 10.2.1 U.S.
- 10.2.2 Canada
- 10.3 Europe
- 10.3.1 Germany
- 10.3.2 UK
- 10.3.3 France
- 10.3.4 Spain
- 10.3.5 Italy
- 10.3.6 Netherlands
- 10.4 Asia Pacific
- 10.4.1 China
- 10.4.2 India
- 10.4.3 Japan
- 10.4.4 Australia
- 10.4.5 South Korea
- 10.5 Latin America
- 10.5.1 Brazil
- 10.5.2 Mexico
- 10.5.3 Argentina
- 10.6 Middle East and Africa
- 10.6.1 Saudi Arabia
- 10.6.2 South Africa
- 10.6.3 UAE
Chapter 11 Company Profiles
- 11.1 Argus
- 11.2 Aselsan
- 11.3 Canon
- 11.4 Dantec Dynamics
- 11.5 Elbit Systems
- 11.6 Hamamatsu Photonics
- 11.7 Harder Digital
- 11.8 Katod
- 11.9 L3Harris Technologies
- 11.10 Lambert Instruments
- 11.11 Photek
- 11.12 Photonis Technologies
- 11.13 Siemens
 2026年全球影像增强器市场报告
 影像增强器市场规模、份额和成长分析(按直径、应用、垂直产业和地区划分)-2026-2033年产业预测全球影像增强器市场:2033 年的机会与策略
 影像增强器市场:2024-2031年全球产业分析、规模、占有率、成长、趋势、预测