


 |
市场调查报告书
商品编码
1773428
霍尔效应电流感测器市场机会、成长动力、产业趋势分析及 2025 - 2034 年预测Hall-Effect Current Sensor Market Opportunity, Growth Drivers, Industry Trend Analysis, and Forecast 2025 - 2034 |
||||||
2024 年全球霍尔效应电流感测器市场价值为 16 亿美元,预计到 2034 年将以 8.5% 的复合年增长率成长,达到 35.8 亿美元。这一增长主要得益于电动车的普及以及向智慧电网技术的转变。随着能源产业的发展,对精确和即时电流感测的需求也在增加,尤其是随着电源分散和再生能源的整合。霍尔效应电流感测器提供非侵入式、精确的测量,这对于能量流管理、故障检测和整体电网性能监控至关重要。它们能够在交流和直流环境中工作,同时保持电气隔离,这使得它们在太阳能逆变器、电池储存系统、电动车充电站和综合智慧电网应用中不可或缺。
小型多功能消费电子产品的兴起也推动了市场扩张。智慧型手机、穿戴式装置和智慧家庭系统等设备需要微型电流感测器,这些感测器既要提供高精度,又要节省空间。霍尔效应感测器凭藉其固态设计、低功耗和高灵敏度,完美契合了这项需求。透过将这些感测器整合到电源管理电路中,製造商可以透过即时电流监控、过载保护和能量优化来提高设备的安全性和效率——这些功能对于当今的智慧电子产品至关重要。
| 市场范围 | |
|---|---|
| 起始年份 | 2024 |
| 预测年份 | 2025-2034 |
| 起始值 | 16亿美元 |
| 预测值 | 35.8亿美元 |
| 复合年增长率 | 8.5% |
预计到2034年,闭环(或补偿式)霍尔效应电流感测器市场将以9.6%的复合年增长率成长。此类感测器在要求卓越精度、快速响应和稳定性的应用中备受青睐,例如工业马达驱动、机器人自动化、轨道运输系统和再生能源设施。这些感测器通常设计用于测量40A至150A之间的电流,即使在温度波动的情况下也能保持出色的线性度,使其成为高性能环境的理想选择。它们在高功率系统(例如不间断电源、电动车充电基础设施和储能逆变器)中至关重要,因为可靠性和精确控制至关重要。
市场按电流范围细分为 100A、100-500A 和 500A 以上类别。 2024 年,100A 细分市场占据市场主导地位,价值 8.418 亿美元。此范围涵盖中低功率需求的应用,例如电源、照明系统、小型电动车和智慧家电。涉及街道照明和分散式太阳能发电系统的智慧城市计画高度依赖 100A 感测器进行即时电流监控和功率优化。此类感测器提供关键的回馈迴路,可实现调光、运动启动和诊断报告等智慧照明功能,这些功能在城市地区推进基础设施建设时至关重要。
2024年,美国霍尔效应电流感测器市场规模达3.314亿美元。受联邦智慧城市计画和绿色能源倡议的推动,节能基础设施的日益普及推动了该地区的成长。城市地区太阳能照明改造的不断扩展,对用于电力监控、故障检测和能源优化的霍尔效应电流感测器的需求也显着增加。美国能源部的激励措施和州级拨款持续推动太阳能路灯计画的发展,并促进了这些感测器在性能管理中的应用。
霍尔效应电流感测器产业的主要参与者包括迈来芯 (Melexis)、德州仪器公司 (Texas Instruments Incorporated)、Allegro MicroSystems, Inc.、LEM International SA 和英飞凌科技股份公司 (Infineon Technologies AG)。这些公司在创新、产品可靠性以及拓展新兴市场和成熟市场的方面积极竞争。为了巩固市场地位并扩大市场份额,霍尔效应电流感测器市场的领先公司高度重视持续创新,推出灵敏度更高、微型化程度更高、能效更高的先进感测器。
与原始设备製造商和公用事业供应商建立战略合作伙伴关係,使其能够进入电动车、再生能源和智慧基础设施等新兴领域。透过投资智慧电网部署和电动车普及正在加速发展的新兴市场,扩大全球影响力是另一个重要策略。企业也专注于开发针对特定应用需求的客製化解决方案,以提高客户留存率。
目录
第一章:方法论与范围
第二章:执行摘要
第三章:行业洞察
- 产业生态系统分析
- 供应商概况
- 利润率
- 成本结构
- 每个阶段的增值
- 影响价值链的因素
- 中断
- 产业衝击力
- 成长动力
- 电动和混合动力汽车需求不断增长
- 工业自动化和机器人技术的成长
- 再生能源系统的扩展
- 智慧电网和能源监控的普及率不断提高
- 消费性电子产品的小型化和整合化
- 产业陷阱与挑战
- 易受外部磁干扰
- 电流水平非常低时精度有限
- 市场机会
- 成长动力
- 成长潜力分析
- 监管格局
- 北美洲
- 欧洲
- 亚太地区
- 拉丁美洲
- 中东和非洲
- 波特的分析
- PESTEL分析
- 技术和创新格局
- 当前的技术趋势
- 物联网与太阳能照明系统的集成
- 智慧和自适应照明控制的扩展
- 使用高效LED和储能技术
- 新兴技术
- 人工智慧驱动的太阳能灯预测性维护的开发
- 太阳能照明与城市智慧电网基础设施的融合
- 薄膜和钙钛矿太阳能板技术的进步
- 当前的技术趋势
- 新兴商业模式
- 合规性要求
- 永续性措施
- 消费者情绪分析
- 专利和智慧财产权分析
- 地缘政治与贸易动态
第四章:竞争格局
- 介绍
- 公司市占率分析
- 按地区
- 北美洲
- 欧洲
- 亚太地区
- 市场集中度分析
- 按地区
- 关键参与者的竞争基准化分析
- 财务绩效比较
- 收入
- 利润率
- 研发
- 产品组合比较
- 产品范围广度
- 科技
- 创新
- 地理分布比较
- 全球足迹分析
- 服务网路覆盖
- 各地区市场渗透率
- 竞争定位矩阵
- 领导者
- 挑战者
- 追踪者
- 利基市场参与者
- 战略展望矩阵
- 财务绩效比较
- 2021-2024 年关键发展
- 合併与收购
- 伙伴关係与合作
- 技术进步
- 扩张和投资策略
- 永续发展倡议
- 数位转型倡议
- 新兴/新创企业竞争对手格局
第五章:市场估计与预测:按类型,2021 - 2034 年
- 主要趋势
- 开环霍尔效应感测器
- 闭环(补偿)霍尔效应感测器
第六章:市场估计与预测:依目前范围,2021 年至 2034 年
- 主要趋势
- <100 安
- 100–500 安
- >500 安
第七章:市场估计与预测:依最终用途,2021 - 2034 年
- 主要趋势
- 电力设施
- 製造业
- 消费性电子产品
- 再生能源
- 电信
- 铁路
- 航太
- 汽车
- 其他的
第八章:市场估计与预测:按地区,2021 - 2034 年
- 主要趋势
- 北美洲
- 我们
- 加拿大
- 欧洲
- 德国
- 英国
- 法国
- 西班牙
- 义大利
- 荷兰
- 亚太地区
- 中国
- 印度
- 日本
- 澳洲
- 韩国
- 拉丁美洲
- 巴西
- 墨西哥
- 阿根廷
- 中东和非洲
- 沙乌地阿拉伯
- 南非
- 阿联酋
第九章:公司简介
- Allegro MicroSystems, Inc.
- Asahi Kasei Microdevices Corporation
- Infineon Technologies AG
- LEM International SA
- Littelfuse, Inc.
- Magnesensor Technology
- Melexis
- Mornsun Guangzhou Science & Technology Co., Ltd.
- ROHM Co., Ltd.
- Socan Technologies
- TAMURA Corporation
- TDK-Micronas GmbH
- Texas Instruments Incorporated
- Vishay Intertechnology, Inc.
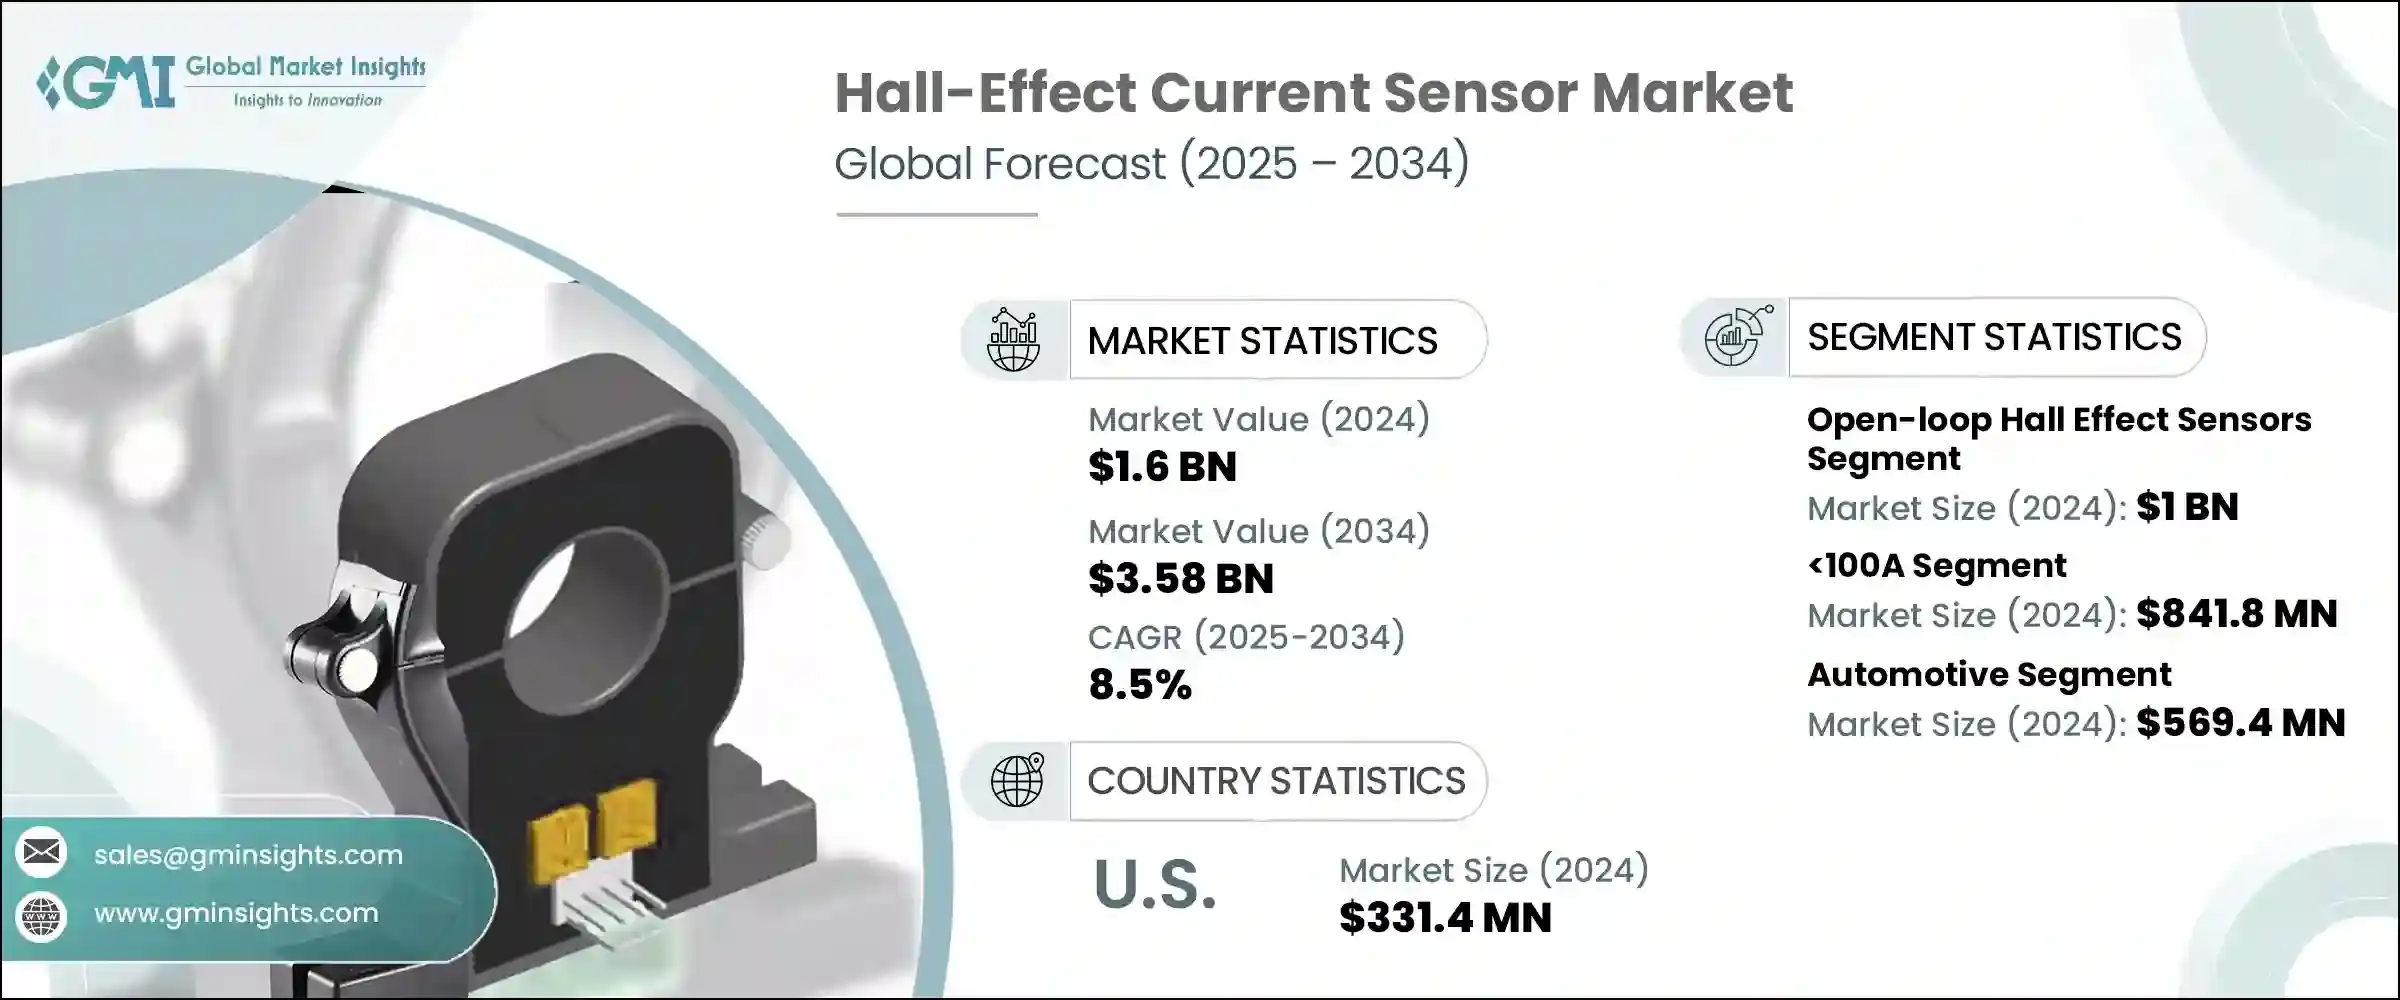
The Global Hall-Effect Current Sensor Market was valued at USD 1.6 billion in 2024 and is estimated to grow at a CAGR of 8.5% to reach USD 3.58 billion by 2034. This growth is largely driven by the rising adoption of electric vehicles, as well as the shift towards smart grid technologies. As the energy sector evolves, the demand for precise and real-time current sensing increases, especially with the decentralization of power sources and integration of renewable energy. Hall-effect current sensors provide non-intrusive, accurate measurements critical for energy flow management, fault detection, and overall grid performance monitoring. Their ability to operate in both AC and DC environments while maintaining electrical isolation makes them indispensable in solar inverters, battery storage systems, electric vehicle charging stations, and comprehensive smart grid applications.
The rise of compact, multifunctional consumer electronics also fuels market expansion. Devices such as smartphones, wearables, and smart home systems require miniaturized current sensors that deliver high accuracy without sacrificing space. Hall-effect sensors fit this need perfectly due to their solid-state design, low power usage, and high sensitivity. By integrating these sensors into power management circuits, manufacturers enhance device safety and efficiency through real-time current monitoring, overload protection, and energy optimization-features essential for today's smarter electronic products.
| Market Scope | |
|---|---|
| Start Year | 2024 |
| Forecast Year | 2025-2034 |
| Start Value | $1.6 billion |
| Forecast Value | $3.58 billion |
| CAGR | 8.5% |
The closed-loop, or compensated, hall-effect current sensor segment is expected to grow at a CAGR of 9.6% through 2034. This category is preferred in applications demanding exceptional accuracy, rapid response, and stability, including industrial motor drives, robotic automation, rail systems, and renewable energy setups. Typically designed to measure currents between 40A and 150A, these sensors maintain excellent linearity even under temperature fluctuations, making them ideal for high-performance environments. They are crucial in high-power systems like uninterruptible power supplies, EV charging infrastructure, and energy storage inverters, where reliability and precise control are vital.
The market is segmented by current range into 100A, 100-500A, and above 500A categories. The 100A segment led the market in 2024, valued at USD 841.8 million. This range covers applications with low to medium power demands, such as power supplies, lighting systems, smaller electric vehicles, and smart appliances. Smart city initiatives involving street lighting and distributed solar power systems heavily rely on 100A sensors for real-time current monitoring and power optimization. Such sensors provide critical feedback loops that enable smart lighting functionalities like dimming, motion activation, and diagnostic reporting, which are essential as urban areas advance their infrastructure.
U.S. Hall-Effect Current Sensor Market was valued at USD 331.4 million in 2024. Growth in this region is supported by the increasing adoption of energy-efficient infrastructure fueled by federal smart city programs and green energy initiatives. The expansion of solar lighting retrofits across urban areas is creating significant demand for hall-effect current sensors used in power monitoring, fault detection, and optimizing energy use. Incentives from the U.S. Department of Energy and state-level grants continue to promote solar street lighting projects, bolstering the adoption of these sensors for performance management.
Key players in the Hall-Effect Current Sensor Industry include Melexis, Texas Instruments Incorporated, Allegro MicroSystems, Inc., LEM International SA, and Infineon Technologies AG. These companies actively compete on innovation, product reliability, and expanding their reach across emerging and established markets. To solidify their position and expand market share, leading companies in the Hall-Effect Current Sensor Market focus heavily on continuous innovation, introducing advanced sensors with improved sensitivity, miniaturization, and energy efficiency.
Strategic partnerships and collaborations with original equipment manufacturers and utility providers allow them to penetrate new sectors such as electric vehicles, renewable energy, and smart infrastructure. Expanding global footprints by investing in emerging markets where smart grid deployment and EV adoption are accelerating is another vital strategy. Companies also emphasize developing customizable solutions tailored to specific application requirements, improving customer retention.
Table of Contents
Chapter 1 Methodology and Scope
- 1.1 Market scope and definitions
- 1.2 Research design
- 1.2.1 Research approach
- 1.2.2 Data collection methods
- 1.3 Data mining sources
- 1.3.1 Global
- 1.3.2 Regional
- 1.4 Base estimates and calculations
- 1.4.1 Base year calculation
- 1.4.2 Key trends for market estimation
- 1.5 Primary research and validation
- 1.5.1 Primary sources
- 1.6 Forecast model
- 1.7 Research assumptions and limitations
Chapter 2 Executive Summary
- 2.1 Industry 3600 synopsis
- 2.2 Key market trends
- 2.3 Type trends
- 2.4 Current range trends
- 2.5 End use trends
- 2.6 Regional
- 2.7 TAM Analysis, 2025-2034 (USD Million)
- 2.8 CXO Perspectives: Strategic imperatives
- 2.8.1 Executive decision points
- 2.8.2 Critical Success Factors
- 2.9 Future Outlook and Strategic Recommendations
Chapter 3 Industry Insights
- 3.1 Industry ecosystem analysis
- 3.1.1 Supplier Landscape
- 3.1.2 Profit Margin
- 3.1.3 Cost structure
- 3.1.4 Value addition at each stage
- 3.1.5 Factor affecting the value chain
- 3.1.6 Disruptions
- 3.2 Industry impact forces
- 3.2.1 Growth drivers
- 3.2.1.1 Rising demand for electric and hybrid vehicles
- 3.2.1.2 Growth in industrial automation and robotics
- 3.2.1.3 Expansion of renewable energy systems
- 3.2.1.4 Increasing adoption of smart grids and energy monitoring
- 3.2.1.5 Miniaturization and integration in consumer electronics
- 3.2.2 Industry pitfalls and challenges
- 3.2.2.1 Susceptibility to external magnetic interference
- 3.2.2.2 Limited accuracy at very low current levels
- 3.2.3 Market opportunities
- 3.2.1 Growth drivers
- 3.3 Growth potential analysis
- 3.4 Regulatory landscape
- 3.4.1 North America
- 3.4.2 Europe
- 3.4.3 Asia Pacific
- 3.4.4 Latin America
- 3.4.5 Middle East & Africa
- 3.5 Porter's analysis
- 3.6 PESTEL analysis
- 3.7 Technology and Innovation landscape
- 3.7.1 Current technological trends
- 3.7.1.1 Integration of IoT with Solar Lighting Systems
- 3.7.1.2 Expansion of Smart and Adaptive Lighting Controls
- 3.7.1.3 Use of High-Efficiency LED and Energy Storage Technologies
- 3.7.2 Emerging technologies
- 3.7.2.1 Development of AI-Driven Predictive Maintenance for Solar Lights
- 3.7.2.2 Integration of Solar Lighting with Urban Smart Grid Infrastructure
- 3.7.2.3 Advancements in Thin-Film and Perovskite Solar Panel Technologies
- 3.7.1 Current technological trends
- 3.8 Emerging Business Models
- 3.9 Compliance Requirements
- 3.10 Sustainability Measures
- 3.11 Consumer Sentiment Analysis
- 3.12 Patent and IP analysis
- 3.13 Geopolitical and trade dynamics
Chapter 4 Competitive Landscape, 2024
- 4.1 Introduction
- 4.2 Company market share analysis
- 4.2.1 By region
- 4.2.1.1 North America
- 4.2.1.2 Europe
- 4.2.1.3 Asia Pacific
- 4.2.2 Market Concentration Analysis
- 4.2.1 By region
- 4.3 Competitive Benchmarking of key Players
- 4.3.1 Financial Performance Comparison
- 4.3.1.1 Revenue
- 4.3.1.2 Profit Margin
- 4.3.1.3 R&D
- 4.3.2 Product Portfolio Comparison
- 4.3.2.1 Product Range Breadth
- 4.3.2.2 Technology
- 4.3.2.3 Innovation
- 4.3.3 Geographic Presence Comparison
- 4.3.3.1 Global Footprint Analysis
- 4.3.3.2 Service Network Coverage
- 4.3.3.3 Market Penetration by Region
- 4.3.4 Competitive Positioning Matrix
- 4.3.4.1 Leaders
- 4.3.4.2 Challengers
- 4.3.4.3 Followers
- 4.3.4.4 Niche Players
- 4.3.5 Strategic outlook matrix
- 4.3.1 Financial Performance Comparison
- 4.4 Key developments, 2021-2024
- 4.4.1 Mergers and Acquisitions
- 4.4.2 Partnerships and Collaborations
- 4.4.3 Technological Advancements
- 4.4.4 Expansion and Investment Strategies
- 4.4.5 Sustainability Initiatives
- 4.4.6 Digital Transformation Initiatives
- 4.5 Emerging/ Startup Competitors Landscape
Chapter 5 Market Estimates and Forecast, By Type, 2021 - 2034 (USD Million & Units)
- 5.1 Key trends
- 5.2 Open-loop hall-effect sensors
- 5.3 Closed-loop (Compensated) hall-effect sensors
Chapter 6 Market Estimates and Forecast, By Current Range, 2021 - 2034 (USD Million & Units)
- 6.1 Key trends
- 6.2 <100 A
- 6.3 100–500 A
- 6.4 >500 A
Chapter 7 Market Estimates and Forecast, By End Use, 2021 - 2034 (USD Million & Units)
- 7.1 Key trends
- 7.2 Power utility
- 7.3 Manufacturing
- 7.4 Consumer electronics
- 7.5 Renewable energy
- 7.6 Telecommunication
- 7.7 Railway
- 7.8 Aerospace
- 7.9 Automotive
- 7.10 Others
Chapter 8 Market Estimates and Forecast, By Region, 2021 - 2034 (USD Million & Units)
- 8.1 Key trends
- 8.2 North America
- 8.2.1 U.S.
- 8.2.2 Canada
- 8.3 Europe
- 8.3.1 Germany
- 8.3.2 UK
- 8.3.3 France
- 8.3.4 Spain
- 8.3.5 Italy
- 8.3.6 Netherlands
- 8.4 Asia Pacific
- 8.4.1 China
- 8.4.2 India
- 8.4.3 Japan
- 8.4.4 Australia
- 8.4.5 South Korea
- 8.5 Latin America
- 8.5.1 Brazil
- 8.5.2 Mexico
- 8.5.3 Argentina
- 8.6 Middle East and Africa
- 8.6.1 Saudi Arabia
- 8.6.2 South Africa
- 8.6.3 UAE
Chapter 9 Company Profiles
- 9.1 Allegro MicroSystems, Inc.
- 9.2 Asahi Kasei Microdevices Corporation
- 9.3 Infineon Technologies AG
- 9.4 LEM International SA
- 9.5 Littelfuse, Inc.
- 9.6 Magnesensor Technology
- 9.7 Melexis
- 9.8 Mornsun Guangzhou Science & Technology Co., Ltd.
- 9.9 ROHM Co., Ltd.
- 9.10 Socan Technologies
- 9.11 TAMURA Corporation
- 9.12 TDK-Micronas GmbH
- 9.13 Texas Instruments Incorporated
- 9.14 Vishay Intertechnology, Inc.
 霍尔效应电流感测器市场按产品类型、输出类型、最终用户和电流范围划分-全球预测,2025-2032年
 霍尔效应感测器市场:2025-2030 年预测
 霍尔效应特斯拉计市场规模及预测 2021 - 2031 年,全球及地区份额、趋势及成长机会分析报告范围:按类型、最终用户及地理划分霍尔效应电流感测器市场(按技术、类型、应用和地区划分),2024 年至 2031 年
 2024-2028 年全球霍尔效应电流感测器市场
 霍尔效应感测器市场 - 按技术(线性、阈值和双极)、按材料(锑化铟、砷化镓、砷化铟)、应用、最终用户和预测,2024 - 2032 年