


 |
市场调查报告书
商品编码
1773457
太阳能封装市场机会、成长动力、产业趋势分析及 2025 - 2034 年预测Solar Encapsulation Market Opportunity, Growth Drivers, Industry Trend Analysis, and Forecast 2025 - 2034 |
||||||
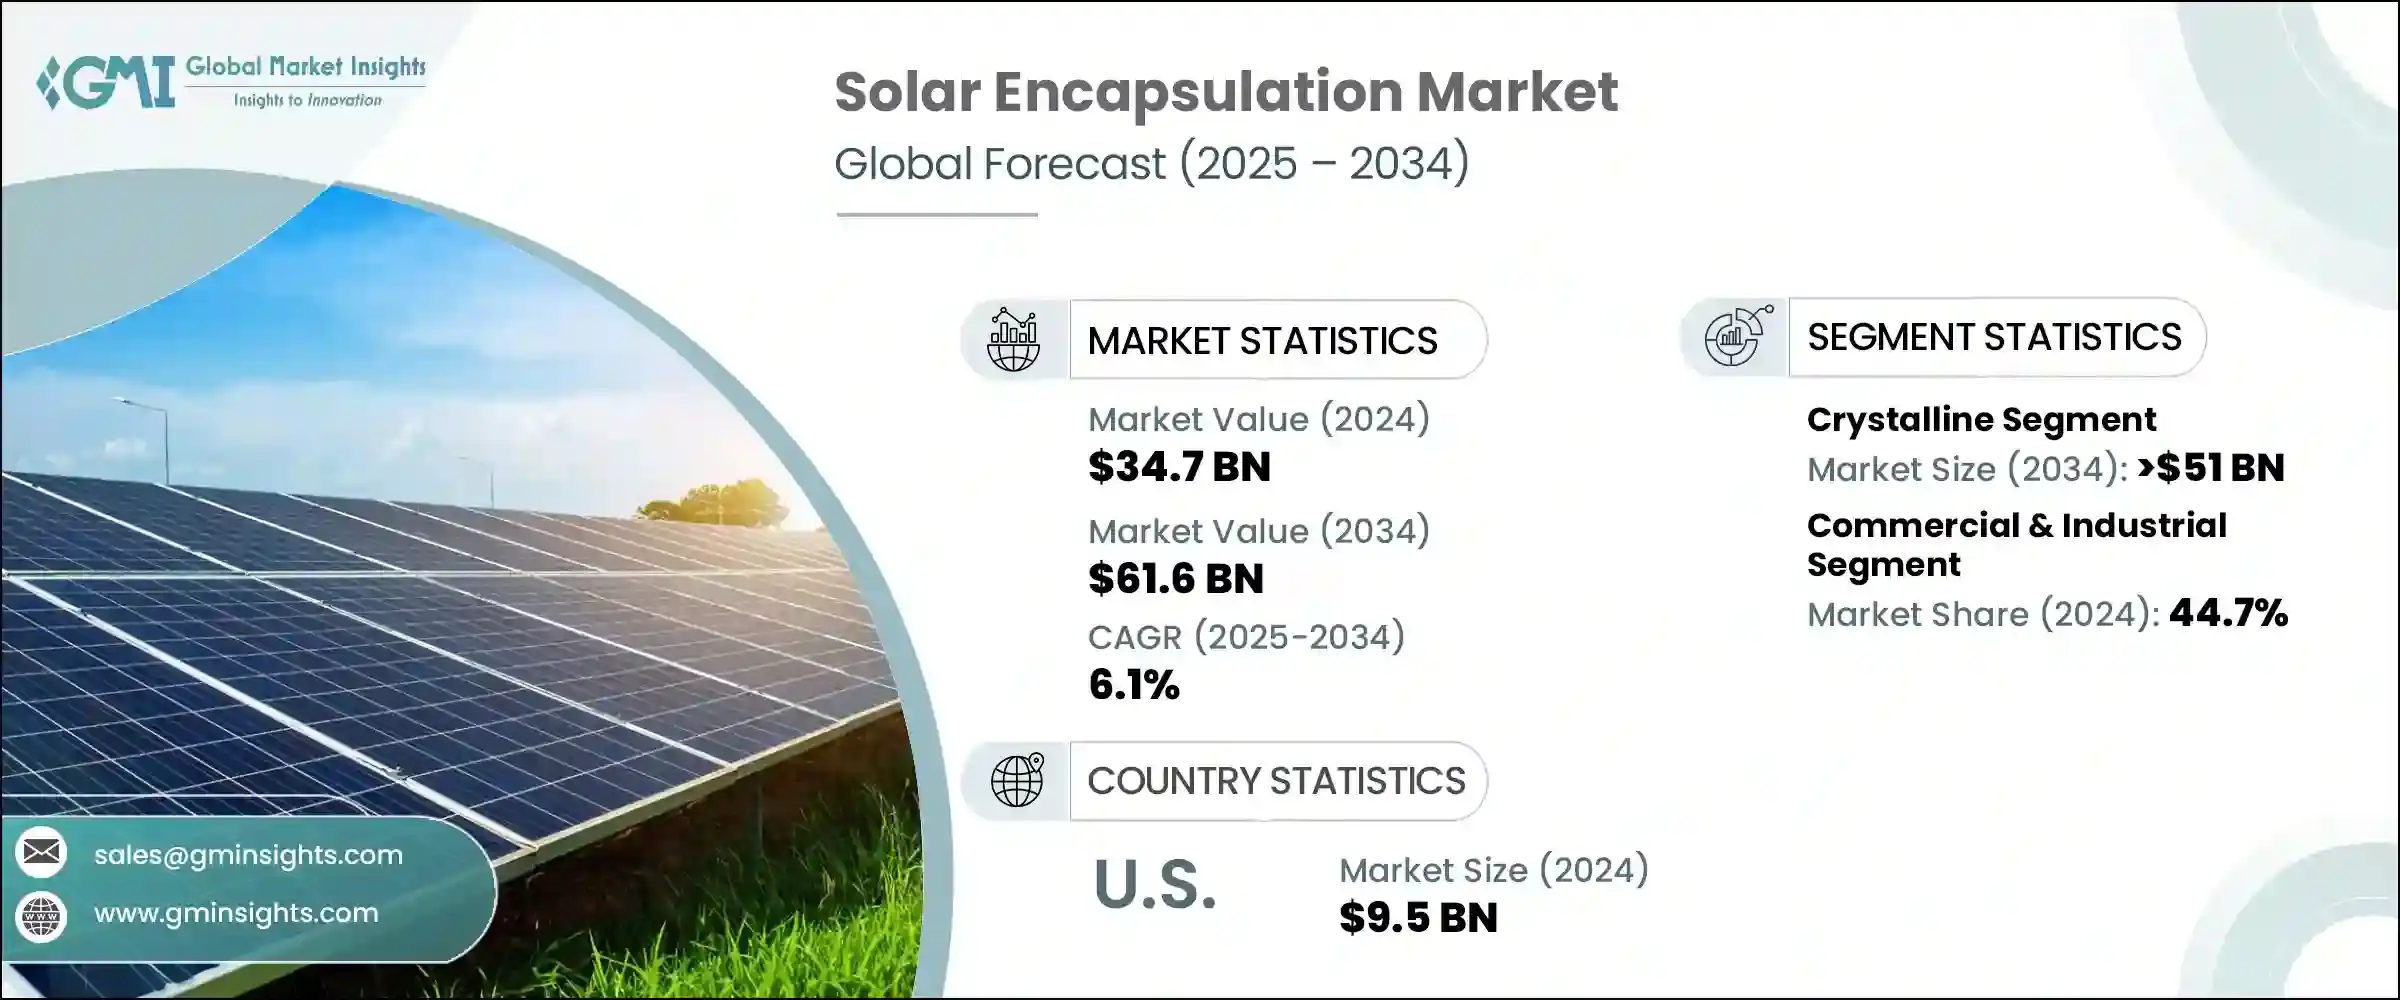
2024年,全球太阳能封装市场规模达347亿美元,预计到2034年将以6.1%的复合年增长率成长,达到616亿美元。这一上升趋势主要得益于全球转向国内太阳能製造,以及政府利好政策的支持。世界各国纷纷推出激励机制,以减少对进口光电模组的依赖,进而促进封装材料等关键材料的本地生产。这些材料在保护太阳能电池免受环境影响、延长电池板寿命和提高整体性能方面发挥着至关重要的作用。随着太阳能在住宅、商业和公用事业规模项目中的应用持续成长,无论是成熟经济体还是新兴太阳能经济体,对可靠、高品质封装材料的需求都日益重要。
製造商正在扩大生产规模以满足激增的需求,尤其是在太阳能电池组件生产快速扩张的市场。已开发国家和发展中国家都在大力投资基础设施,以支持太阳能电池组件的本地生产,并专注于供应链的精简。这种转变正推动封装材料消费的大幅成长,而封装材料是确保组件长期效率和耐用性的关键。越来越多的垂直整合太阳能公司需要可靠的封装材料供应以实现大规模生产,这进一步强化了这一趋势。随着这些公司巩固对价值链(包括原材料采购和组件组装)的控制,它们对稳定一致的封装材料供应的需求预计将增长,从而对未来几年的市场动态产生积极影响。
| 市场范围 | |
|---|---|
| 起始年份 | 2024 |
| 预测年份 | 2025-2034 |
| 起始值 | 347亿美元 |
| 预测值 | 616亿美元 |
| 复合年增长率 | 6.1% |
预计到2034年,晶体硅太阳能板市场将创造超过510亿美元的收入。由于其成本效益高且与标准封装技术相容,这些电池板将继续占据市场主导地位。晶体硅组件通常与EVA基封装材料搭配使用,这种封装材料以实惠的价格提供充足的紫外线防护和耐热性。由于其结构相对简单,且在各种太阳能应用中被广泛采用,使其成为传统层压材料的理想选择,从而进一步支持封装材料市场的成长。
在应用领域,商业和工业领域在2024年占据了全球太阳能封装市场份额的44.7%。该领域的突出表现得益于高性能太阳能组件的日益普及,尤其是在大规模安装中。这些专案通常需要先进的封装系统,能够承受恶劣的工作条件,并保持卓越的长期效率。由于商业太阳能装置面临严格的性能标准,对能够提供更高可靠性、热控制和抗降解性能的创新封装材料的需求日益增长。
从区域来看,北美市场在2024年占了29.8%的份额,其中美国占据主导地位。美国太阳能封装市场的价值在2022年为47亿美元,2023年为76亿美元,2024年为95亿美元。支持这一成长的关键因素是联邦政府致力于发展强大的国内太阳能供应链,并特别重视封装材料製造。旨在加强基于硅基和薄膜技术的太阳能组件生产的国家倡议正在促进高性能封装材料的更广泛应用。预计这些发展将为封装材料领域的老牌企业和新进业者创造强大的市场机会。
该领域的主要公司正在运用多种策略来巩固其市场地位。他们正在扩大产能,投资EVA和POE薄膜的内部生产,并与顶级太阳能模组生产商建立牢固的合作伙伴关係。许多公司也专注于针对区域市场客製化产品,与聚合物供应商进行后向整合,并加强研发力度,以提高材料的耐久性和抗紫外线性能。这有助于确保其封装材料符合不断变化的性能标准,同时保持成本竞争力。
领先的封装材料生产商也注重材料特性的创新,例如透明度和抗PID(电致变性)性能,以提高组件效率。同时,他们正在建造本地化製造中心,以改善物流并缩短交货时间。与垂直整合的组件製造商签订的策略协议正在帮助这些公司提升市场占有率并增强供应链稳定性。他们的努力也扩展到扩大薄膜挤出能力、优化层压技术,并确保符合IEC和BIS等国际认证标准,所有这些都有助于在全球太阳能封装领域保持长期竞争力。
目录
第一章:方法论与范围
第二章:执行摘要
第三章:行业洞察
- 产业生态系统
- 监管格局
- 产业衝击力
- 成长动力
- 产业陷阱与挑战
- 成长潜力分析
- 波特的分析
- PESTEL分析
第四章:竞争格局
- 介绍
- 公司市占率分析
- 战略仪表板
- 策略倡议
- 竞争基准测试
- 创新与技术格局
第五章:市场规模及预测:依面板类型,2021 - 2034
- 主要趋势
- 结晶
- 薄膜
- 其他的
第六章:市场规模及预测:依材料类型,2021 - 2034
- 主要趋势
- 乙烯-醋酸乙烯酯
- 聚醚醚酮
- 珍珠棉
第七章:市场规模及预测:依应用,2021 - 2034
- 主要趋势
- 住宅
- 商业和工业
- 公用事业
第八章:市场规模及预测:依最终用途,2021 - 2034
- 主要趋势
- 建造
- 电子产品
- 其他的
第九章:市场规模及预测:按地区,2021 - 2034
- 主要趋势
- 北美洲
- 我们
- 加拿大
- 墨西哥
- 欧洲
- 奥地利
- 丹麦
- 芬兰
- 法国
- 德国
- 义大利
- 亚太地区
- 中国
- 澳洲
- 印度
- 日本
- 韩国
- 新加坡
- 中东和非洲
- 以色列
- 沙乌地阿拉伯
- 阿联酋
- 约旦
- 阿曼
- 拉丁美洲
- 巴西
- 智利
- 阿根廷
- 秘鲁
第十章:公司简介
- 3M
- Al Technology
- Celanese
- Dow Corning
- DuPont
- Eastman
- First Solar
- Hangzhou First PV Material
- Momentive
- Mitsubishi Chemicals
- RenewSys India
- STR Holdings
- Trosifol
The Global Solar Encapsulation Market was valued at USD 34.7 billion in 2024 and is estimated to grow at a CAGR of 6.1% to reach USD 61.6 billion by 2034. This upward trend is largely driven by the global pivot toward domestic solar manufacturing, supported by favorable government policies. Countries across the globe are introducing incentive-based frameworks to reduce dependency on imported photovoltaic components, thereby bolstering local production of critical materials such as encapsulants. These materials play a vital role in safeguarding solar cells from environmental exposure, prolonging panel life, and enhancing overall performance. As solar adoption continues to gain ground in residential, commercial, and utility-scale projects, the need for reliable, high-quality encapsulation materials is becoming increasingly essential across both established and emerging solar economies.
Manufacturers are scaling up their operations to meet the surging demand, particularly in markets where solar module production is expanding rapidly. Both developed and developing countries are investing heavily in infrastructure that supports the local manufacturing of solar modules, with a strong focus on streamlining the supply chain. This shift is encouraging significant growth in the consumption of encapsulation materials, which are key to ensuring long-term module efficiency and durability. The trend is further reinforced by the growing number of vertically integrated solar companies that require dependable access to encapsulants for large-scale production. As these companies consolidate control over the value chain, including raw material sourcing and module assembly, their demand for stable and consistent encapsulation supply is expected to grow, positively influencing market dynamics over the coming years.
| Market Scope | |
|---|---|
| Start Year | 2024 |
| Forecast Year | 2025-2034 |
| Start Value | $34.7 Billion |
| Forecast Value | $61.6 Billion |
| CAGR | 6.1% |
The crystalline panel segment is anticipated to generate over USD 51 billion in revenue by 2034. These panels continue to dominate the market due to their cost-effectiveness and compatibility with standard encapsulation techniques. Crystalline modules are commonly paired with EVA-based encapsulants, which offer adequate UV protection and thermal resistance at affordable rates. Their relatively simple structure and mainstream adoption across various solar applications make them an ideal fit for conventional lamination materials, further supporting encapsulant market growth.
Within the application landscape, the commercial and industrial sector accounted for 44.7% of the global solar encapsulation market share in 2024. The segment's prominence is attributed to the rising deployment of high-performance solar modules, particularly in large-scale installations. These projects often require advanced encapsulation systems capable of withstanding harsh operating conditions while delivering superior efficiency over time. As commercial solar installations face rigorous performance standards, demand is growing for innovative encapsulants that offer enhanced reliability, thermal control, and resistance to degradation.
In regional terms, the North American market held a 29.8% share in 2024, with the U.S. playing a dominant role. The solar encapsulation market in the United States was valued at USD 4.7 billion in 2022, USD 7.6 billion in 2023, and USD 9.5 billion in 2024. A key factor supporting this growth is the federal commitment to developing a robust domestic solar supply chain, with specific emphasis on encapsulant manufacturing. National initiatives aimed at strengthening the production of solar components across both silicon-based and thin-film technologies are contributing to the broader adoption of high-performance encapsulation materials. These developments are expected to create strong market opportunities for both established players and new entrants in the encapsulant space.
Major companies operating in this sector are leveraging a combination of strategies to secure their market position. They are expanding their production capacities, investing in in-house manufacturing of EVA and POE films, and forming strong partnerships with top-tier solar module producers. Many are also focusing on tailoring products for regional markets, integrating backward with polymer suppliers, and intensifying their research and development efforts to improve material durability and UV resistance. This helps ensure their encapsulants meet evolving performance standards while remaining cost-competitive.
Leading encapsulant producers are also prioritizing innovation in material properties such as transparency and PID resistance to enhance module efficiency. At the same time, they are building localized manufacturing hubs to improve logistics and reduce lead times. Strategic agreements with vertically integrated module manufacturers are helping these companies boost their market presence and improve supply chain stability. Their efforts also extend to scaling up film extrusion capabilities, optimizing lamination technologies, and ensuring compliance with international certification standards such as IEC and BIS, all of which are instrumental in maintaining long-term competitiveness in the global solar encapsulation landscape.
Table of Contents
Chapter 1 Methodology & Scope
- 1.1 Research design
- 1.2 Base estimates & calculations
- 1.3 Forecast calculation
- 1.4 Primary research & validation
- 1.4.1 Primary sources
- 1.4.2 Data mining sources
- 1.5 Market definitions
Chapter 2 Executive Summary
- 2.1 Industry synopsis, 2021 - 2034
Chapter 3 Industry Insights
- 3.1 Industry ecosystem
- 3.2 Regulatory landscape
- 3.3 Industry impact forces
- 3.3.1 Growth drivers
- 3.3.2 Industry pitfalls & challenges
- 3.4 Growth potential analysis
- 3.5 Porter's analysis
- 3.5.1 Bargaining power of suppliers
- 3.5.2 Bargaining power of buyers
- 3.5.3 Threat of new entrants
- 3.5.4 Threat of substitutes
- 3.6 PESTEL analysis
Chapter 4 Competitive landscape, 2025
- 4.1 Introduction
- 4.2 Company market share analysis, 2024
- 4.3 Strategic dashboard
- 4.4 Strategic initiatives
- 4.5 Competitive benchmarking
- 4.6 Innovation & technology landscape
Chapter 5 Market Size and Forecast, By Panel Type, 2021 - 2034 (USD Billion)
- 5.1 Key trends
- 5.2 Crystalline
- 5.3 Thin Film
- 5.4 Others
Chapter 6 Market Size and Forecast, By Material Type, 2021 - 2034 (USD Billion)
- 6.1 Key trends
- 6.2 EVA
- 6.3 POE
- 6.4 EPE
Chapter 7 Market Size and Forecast, By Application, 2021 - 2034 (USD Billion)
- 7.1 Key trends
- 7.2 Residential
- 7.3 Commercial & industrial
- 7.4 Utility
Chapter 8 Market Size and Forecast, By End Use, 2021 - 2034 (USD Billion)
- 8.1 Key trends
- 8.2 Construction
- 8.3 Electronics
- 8.4 Others
Chapter 9 Market Size and Forecast, By Region, 2021 - 2034 (USD Million & MT)
- 9.1 Key trends
- 9.2 North America
- 9.2.1 U.S.
- 9.2.2 Canada
- 9.2.3 Mexico
- 9.3 Europe
- 9.3.1 Austria
- 9.3.2 Denmark
- 9.3.3 Finland
- 9.3.4 France
- 9.3.5 Germany
- 9.3.6 Italy
- 9.4 Asia Pacific
- 9.4.1 China
- 9.4.2 Australia
- 9.4.3 India
- 9.4.4 Japan
- 9.4.5 South Korea
- 9.4.6 Singapore
- 9.5 Middle East and Africa
- 9.5.1 Israel
- 9.5.2 Saudi Arabia
- 9.5.3 UAE
- 9.5.4 Jordan
- 9.5.5 Oman
- 9.6 Latin America
- 9.6.1 Brazil
- 9.6.2 Chile
- 9.6.3 Argentina
- 9.6.4 Peru
Chapter 10 Company Profiles
- 10.1 3M
- 10.2 Al Technology
- 10.3 Celanese
- 10.4 Dow Corning
- 10.5 DuPont
- 10.6 Eastman
- 10.7 First Solar
- 10.8 Hangzhou First PV Material
- 10.9 Momentive
- 10.10 Mitsubishi Chemicals
- 10.11 RenewSys India
- 10.12 STR Holdings
- 10.13 Trosifol
 2026年全球太阳能封装市场报告
 太阳能电池封装市场规模、份额和成长分析(按材料、技术、应用和地区划分)—2026-2033年产业预测
 太阳能电池封装:全球市场份额和排名、总收入和需求预测(2025-2031 年)
 美国光伏封装封装市场规模、份额及趋势分析报告:2025-2033年材料、技术、应用及细分市场预测太阳能电池封装市场规模、份额及趋势分析报告:依材料、技术、应用、地区及细分市场预测,2025-2033年
 太阳能电池封装材的全球市场的评估:类别,面板类别,各用途,各地区,机会,预测(2018年~2032年)太阳能电池封装材的印度市场评估:类别,各面板类型,各用途,各地区,机会,预测(2019年度~2033年度)
 2025 年至 2033 年太阳能封装市场规模、份额、趋势及预测(按材料、技术、应用和地区)
 太阳能封装市场,按材料、技术、应用、国家和地区 - 2024-2032 年行业分析、市场规模、市场份额和预测
 到 2030 年太阳能电池封装市场预测:按材料、技术、应用、最终用户和地区进行全球分析