


 |
市场调查报告书
商品编码
1773478
全光相机市场机会、成长动力、产业趋势分析及 2025 - 2034 年预测Plenoptic Camera Market Opportunity, Growth Drivers, Industry Trend Analysis, and Forecast 2025 - 2034 |
||||||
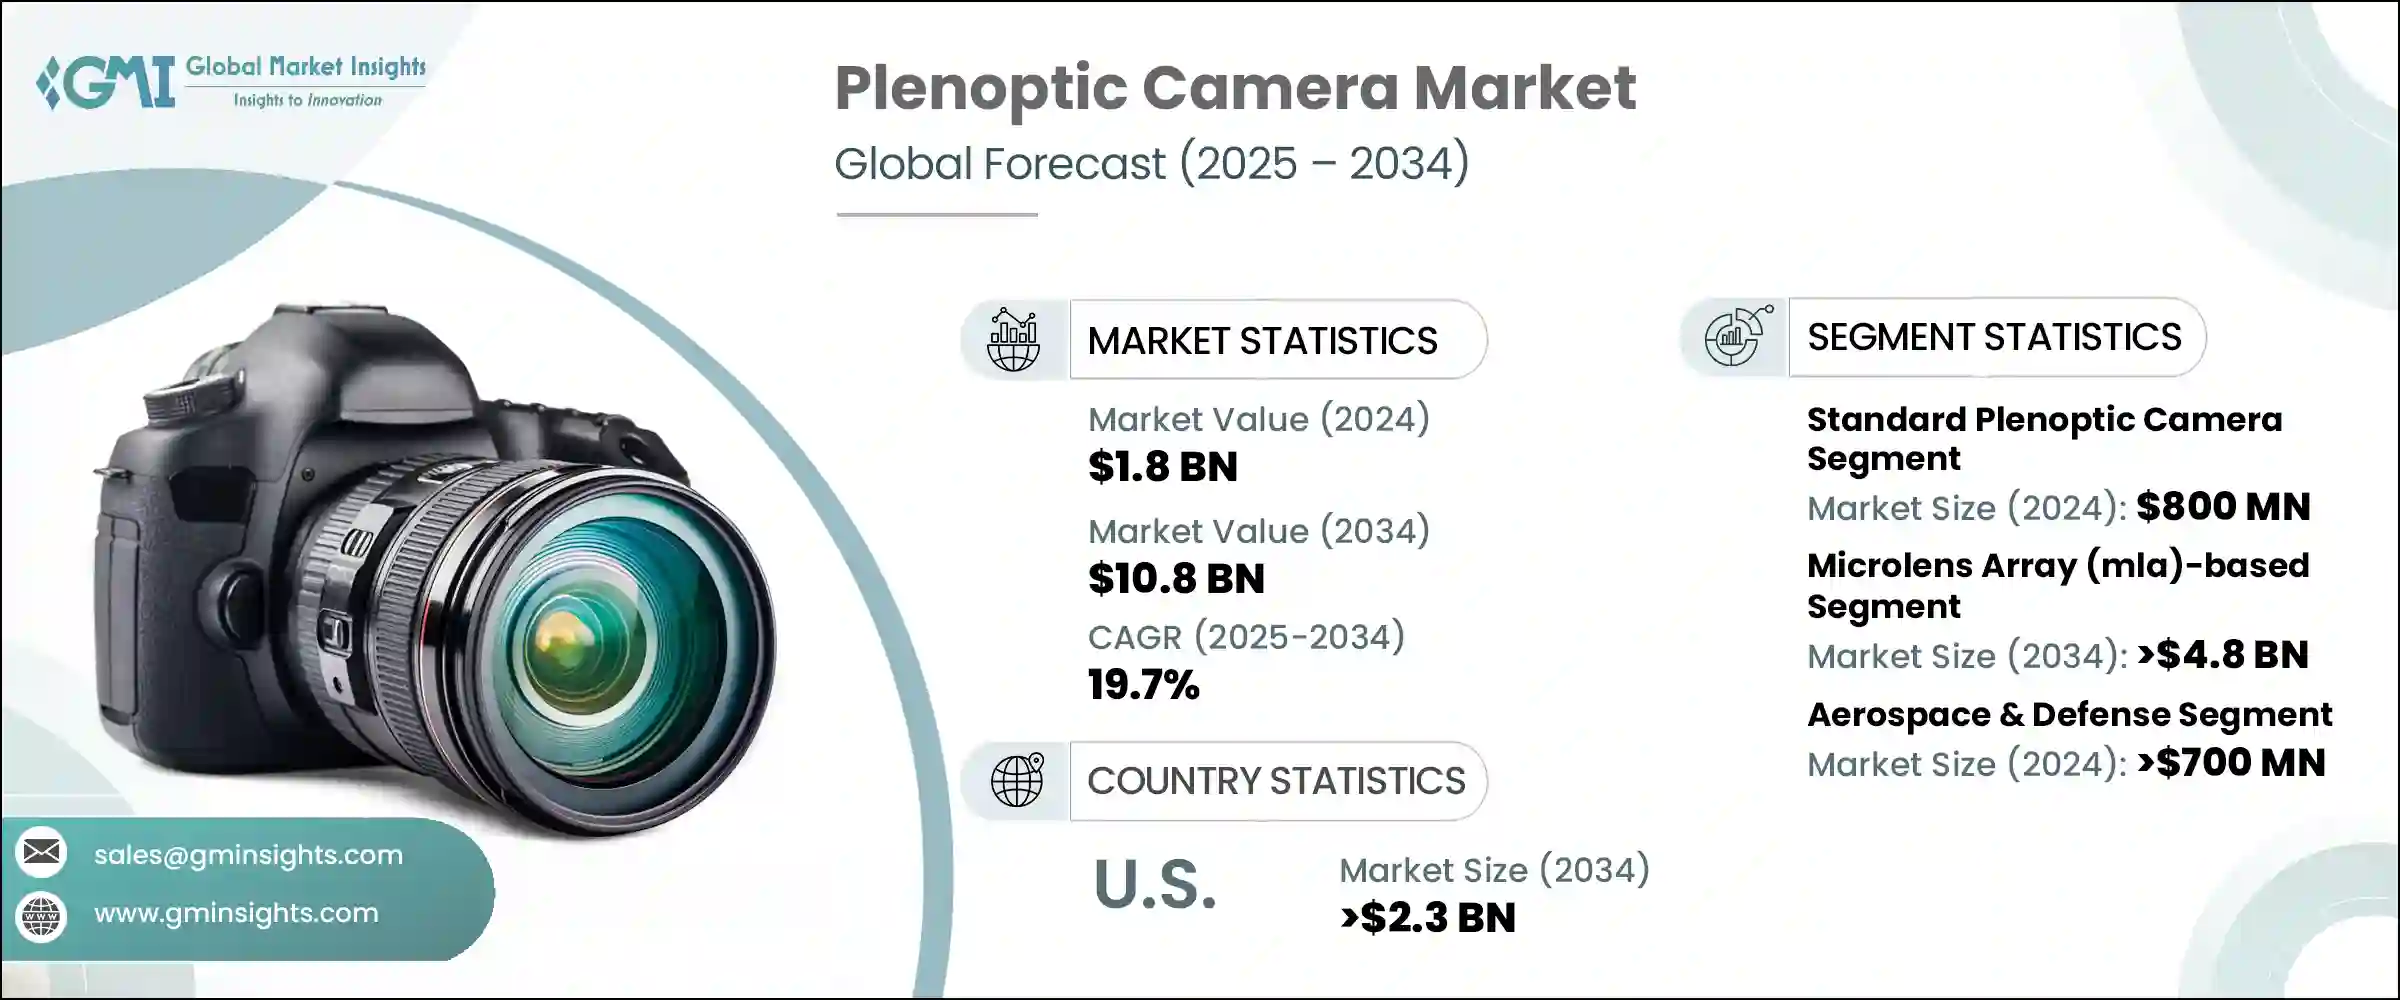
2024年,全球全光相机市场规模达18亿美元,预计2034年将以19.7%的复合年增长率成长,达到108亿美元。成像系统(尤其是微透镜和相机阵列技术)的进步,正在重塑捕捉包含深度空间资讯的高解析度视觉影像的方式。工业自动化、消费性电子、医疗诊断和沈浸式媒体等领域的广泛应用,正在推动市场成长。这些相机为使用者提供独特的功能,例如捕捉后重新对焦和3D成像,使其在AR/VR、机器人和机器视觉等领域具有广泛的应用前景。
随着计算摄影技术的普及,其与智慧型手机和医疗设备的整合也变得越来越普遍。此外,新创公司和科技领导者持续投入研发,不断突破全光成像系统的界限,进一步推动了这项发展势头。川普政府时期引发的关税衝突给依赖进口零件的製造商带来了定价挑战。随着关键零件成本的上涨,美国製造商要么面临利润率下降,要么必须将涨价转嫁给客户。由于缺乏可行的国内替代方案,这些公司面临着优化生产成本或调整采购策略以保持竞争力的压力。
| 市场范围 | |
|---|---|
| 起始年份 | 2024 |
| 预测年份 | 2025-2034 |
| 起始值 | 18亿美元 |
| 预测值 | 108亿美元 |
| 复合年增长率 | 19.7% |
2024年,标准全光相机市场价值达8亿美元。这类相机在主镜头和感测器之间放置一个微透镜阵列,用于记录空间和角度光资料。此配置可产生4D全光资料,使用户能够在拍摄后调整焦距或视角。这些功能使标准全光相机成为研究、创意媒体和摄影的理想选择,因为这些领域对影像深度和后製灵活性至关重要。然而,平衡角度解析度和空间解析度的需求仍然会影响影像清晰度。
预计到2034年,基于微透镜阵列 (MLA) 的相机市场规模将达到48亿美元。这些系统使用放置在主镜头和感测器之间的微透镜阵列来捕捉来自多个方向的光线,将平面二维影像转换为精细的全光影像。这种成像方法支援捕捉后重新对焦和深度映射等功能,这些功能在影片製作、科学研究和虚拟视觉化等领域至关重要。透过 MLA 复製光线路径的能力,为使用者提供丰富的沉浸式观看体验,并增强深度和精确度。
预计到2034年,美国全光相机市场规模将达23亿美元。凭藉其强大的技术格局和创新驱动的生态系统,美国仍将是全球需求的重要贡献者。人们对扩增实境(AR)和虚拟实境(VR)技术的浓厚兴趣持续提升了对能够创造沉浸式和响应式视觉环境的相机的需求。凭藉先进的研究中心和未来成像工具的快速普及,美国预计将在该领域保持主导地位。
影响市场的关键参与者包括佳能公司、Adobe公司、苹果、Raytrix GmbH和Google有限责任公司,它们共同推动创新和技术领先地位。全光相机市场的领先公司正透过优先创新和扩大应用范围来巩固其地位。他们正在加大研发投入,以开发下一代成像解决方案,提供增强深度映射、即时3D渲染和后期编辑功能。与AR/VR、医疗保健和自主系统领域公司的策略合作伙伴关係也日益紧密。这些合作使公司能够根据特定用例自订其全光技术。此外,各公司正专注于软体整合和边缘运算相容性,以提高即时效能。
目录
第一章:方法论与范围
第二章:执行摘要
第三章:行业洞察
- 产业生态系统分析
- 川普政府关税
- 对贸易的影响
- 贸易量中断
- 报復措施
- 对产业的影响
- 供应方影响(原料)
- 主要材料价格波动
- 供应链重组
- 生产成本影响
- 需求面影响(售价)
- 价格传导至终端市场
- 市占率动态
- 消费者反应模式
- 供应方影响(原料)
- 受影响的主要公司
- 策略产业反应
- 供应链重组
- 定价和产品策略
- 政策参与
- 展望与未来考虑
- 对贸易的影响
- 产业衝击力
- 成长动力
- 成像技术的进步
- 沉浸式内容(VR/AR)的需求不断增长
- 在医学影像中的应用日益增多
- 工业应用(机器视觉、机器人)的采用率不断提高
- 融入消费性电子产品
- 产业陷阱与挑战
- 生产成本高
- 消费者对科技的认识与理解有限
- 成长潜力分析
- 监管格局
- 技术格局
- 未来市场趋势
- 差距分析
- 波特的分析
- PESTEL分析
第四章:竞争格局
- 介绍
- 公司市占率分析
- 主要市场参与者的竞争分析
- 竞争定位矩阵
- 策略仪表板
第五章:市场估计与预测:按类型,2021 - 2034 年
- 标准全光相机(例如,lytro illum)
- 聚焦全光相机
- 编码孔径全光相机
- 立体全光相机
第六章:市场估计与预测:按技术,2021 - 2034 年
- 基于微透镜阵列(MLA)
- 多孔径成像
- 全光成像
- 其他的
第七章:市场估计与预测:依最终用途,2021 - 2034 年
- 航太与国防
- 汽车与运输
- 电子和半导体
- 医疗保健与生命科学
- 其他的
第八章:市场估计与预测:按地区,2021 - 2034 年
- 主要趋势
- 北美洲
- 我们
- 加拿大
- 欧洲
- 德国
- 英国
- 法国
- 西班牙
- 义大利
- 荷兰
- 亚太地区
- 中国
- 印度
- 日本
- 澳洲
- 韩国
- 拉丁美洲
- 巴西
- 墨西哥
- 阿根廷
- 中东和非洲
- 沙乌地阿拉伯
- 南非
- 阿联酋
第九章:公司简介
- Adobe Inc.
- Apple Inc.
- Avegant Corporation
- Canon Inc.
- FoVI 3D, Inc.
- Google LLC
- Japan Display Inc.
- OTOY Inc.
- Panasonic Corporation
- Raytrix GmbH (Germany)
- Ricoh Innovations Corporation
- Samsung Electronics Co., Ltd.
- Sony Group Corporation
- Xiaomi Corporation
The Global Plenoptic Camera Market was valued at USD 1.8 billion in 2024 and is estimated to grow at a CAGR of 19.7% to reach USD 10.8 billion by 2034. Advancements in imaging systems, especially in microlens and camera array technologies, are reshaping how high-resolution visuals with deep spatial information are captured. Growing adoption across industrial automation, consumer electronics, medical diagnostics, and immersive media is fueling market growth. These cameras empower users with unique features like post-capture refocusing and 3D imaging, making them attractive for applications in AR/VR, robotics, and machine vision.
As computational photography gains ground, integration into smartphones and medical devices is becoming more common. Additionally, ongoing investments in R&D by startups and tech leaders are pushing the boundaries of plenoptic imaging systems, further driving momentum. The tariff conflict initiated during the Trump administration has created pricing challenges for manufacturers relying on imported components. As the cost of essential parts rises, manufacturers in the U.S. either face reduced margins or must pass price increases to customers. Without viable domestic alternatives, these companies are under pressure to optimize production costs or shift sourcing strategies to remain competitive.
| Market Scope | |
|---|---|
| Start Year | 2024 |
| Forecast Year | 2025-2034 |
| Start Value | $1.8 Billion |
| Forecast Value | $10.8 Billion |
| CAGR | 19.7% |
The standard plenoptic cameras segment was valued at USD 800 million in 2024. These cameras feature a microlens array placed between the main lens and the sensor to record both spatial and angular light data. This configuration produces 4D plenoptic data, enabling users to adjust focus or perspective after capture. These capabilities make standard plenoptic cameras ideal for research, creative media, and photography, where image depth and post-processing flexibility matter. However, the need to balance angular and spatial resolution continues to influence image clarity.
The microlens array (MLA)-based camera segment is poised to reach USD 4.8 billion by 2034. These systems use a microlens array placed between the primary lens and sensor to trap light from multiple directions, transforming flat 2D captures into detailed plenoptic images. This imaging method supports functions like post-capture refocusing and depth mapping, which are essential in fields such as film production, scientific research, and virtual visualization. The ability to replicate light ray pathways through MLA offers users a rich, immersive viewing experience with enhanced depth and precision.
United States Plenoptic Camera Market is expected to reach USD 2.3 billion by 2034. The country remains a vital contributor to global demand thanks to its robust technological landscape and innovation-driven ecosystem. Strong interest in AR and VR technologies continues to elevate the demand for cameras capable of creating immersive and responsive visual environments. With advanced research centers and the rapid adoption of futuristic imaging tools, the U.S. is expected to maintain its dominance in this space.
Key players influencing the market include Canon Inc., Adobe Inc., Apple Inc., Raytrix GmbH, and Google LLC, who collectively drive innovation and technological leadership. Leading companies in the plenoptic camera market are strengthening their foothold by prioritizing innovation and expanding their application scope. They are increasing R&D investments to develop next-generation imaging solutions that offer enhanced depth mapping, real-time 3D rendering, and post-capture editing capabilities. Strategic partnerships with firms in the AR/VR, healthcare, and autonomous systems sectors are also gaining traction. These collaborations allow companies to tailor their plenoptic technologies for specific use cases. Additionally, firms are focusing on software integration and edge computing compatibility to boost real-time performance.
Table of Contents
Chapter 1 Methodology and Scope
- 1.1 Market scope and definitions
- 1.2 Research design
- 1.2.1 Research approach
- 1.2.2 Data collection methods
- 1.3 Base estimates and calculations
- 1.3.1 Base year calculation
- 1.3.2 Key trends for market estimation
- 1.4 Forecast model
- 1.5 Primary research and validation
- 1.5.1 Primary sources
- 1.5.2 Data mining sources
Chapter 2 Executive Summary
- 2.1 Industry 3600 synopsis
Chapter 3 Industry Insights
- 3.1 Industry ecosystem analysis
- 3.2 Trump administration tariffs
- 3.2.1 Impact on trade
- 3.2.1.1 Trade volume disruptions
- 3.2.1.2 Retaliatory measures
- 3.2.2 Impact on the industry
- 3.2.2.1 Supply-side impact (raw materials)
- 3.2.2.1.1 Price volatility in key materials
- 3.2.2.1.2 Supply chain restructuring
- 3.2.2.1.3 Production cost implications
- 3.2.2.2 Demand-side impact (selling price)
- 3.2.2.2.1 Price transmission to end markets
- 3.2.2.2.2 Market share dynamics
- 3.2.2.2.3 Consumer response patterns
- 3.2.2.1 Supply-side impact (raw materials)
- 3.2.3 Key companies impacted
- 3.2.4 Strategic industry responses
- 3.2.4.1 Supply chain reconfiguration
- 3.2.4.2 Pricing and product strategies
- 3.2.4.3 Policy engagement
- 3.2.5 Outlook and future considerations
- 3.2.1 Impact on trade
- 3.3 Industry impact forces
- 3.3.1 Growth drivers
- 3.3.2 Advancements in imaging technology
- 3.3.3 Growing demand for immersive content (VR/AR)
- 3.3.4 Increasing use in medical imaging
- 3.3.5 Rising adoption in industrial applications (machine vision, robotics)
- 3.3.6 Integration into consumer electronics
- 3.3.7 Industry pitfalls and challenges
- 3.3.8 High production costs
- 3.3.9 Limited consumer awareness and understanding of the technology
- 3.4 Growth potential analysis
- 3.5 Regulatory landscape
- 3.6 Technology landscape
- 3.7 Future market trends
- 3.8 Gap analysis
- 3.9 Porter's analysis
- 3.10 PESTEL analysis
Chapter 4 Competitive Landscape, 2024
- 4.1 Introduction
- 4.2 Company market share analysis
- 4.3 Competitive analysis of major market players
- 4.4 Competitive positioning matrix
- 4.5 Strategy dashboard
Chapter 5 Market Estimates and Forecast, By Type, 2021 - 2034 (USD Billion)
- 5.1 Standard plenoptic camera (e.g., lytro illum)
- 5.2 Focused plenoptic camera
- 5.3 Coded aperture plenoptic camera
- 5.4 Stereo plenoptic camera
Chapter 6 Market Estimates and Forecast, By Technology, 2021 - 2034 (USD Billion)
- 6.1 Microlens array (mla)-based
- 6.2 Multi-aperture imaging
- 6.3 Plenoptic imaging
- 6.4 Others
Chapter 7 Market Estimates and Forecast, By End Use, 2021 - 2034 (USD Billion)
- 7.1 Aerospace & defense
- 7.2 Automotive & transportation
- 7.3 Electronics & semiconductors
- 7.4 Healthcare & life sciences
- 7.5 Others
Chapter 8 Market Estimates and Forecast, By Region, 2021 - 2034 (USD Billion)
- 8.1 Key trends
- 8.2 North America
- 8.2.1 U.S.
- 8.2.2 Canada
- 8.3 Europe
- 8.3.1 Germany
- 8.3.2 UK
- 8.3.3 France
- 8.3.4 Spain
- 8.3.5 Italy
- 8.3.6 Netherlands
- 8.4 Asia Pacific
- 8.4.1 China
- 8.4.2 India
- 8.4.3 Japan
- 8.4.4 Australia
- 8.4.5 South Korea
- 8.5 Latin America
- 8.5.1 Brazil
- 8.5.2 Mexico
- 8.5.3 Argentina
- 8.6 Middle East and Africa
- 8.6.1 Saudi Arabia
- 8.6.2 South Africa
- 8.6.3 UAE
Chapter 9 Company Profiles
- 9.1 Adobe Inc.
- 9.2 Apple Inc.
- 9.3 Avegant Corporation
- 9.4 Canon Inc.
- 9.5 FoVI 3D, Inc.
- 9.6 Google LLC
- 9.7 Japan Display Inc.
- 9.8 OTOY Inc.
- 9.9 Panasonic Corporation
- 9.10 Raytrix GmbH (Germany)
- 9.11 Ricoh Innovations Corporation
- 9.12 Samsung Electronics Co., Ltd.
- 9.13 Sony Group Corporation
- 9.14 Xiaomi Corporation


