


 |
市场调查报告书
商品编码
1797729
GaN 充电器市场机会、成长动力、产业趋势分析及 2025 - 2034 年预测GaN-powered Chargers Market Opportunity, Growth Drivers, Industry Trend Analysis, and Forecast 2025 - 2034 |
||||||
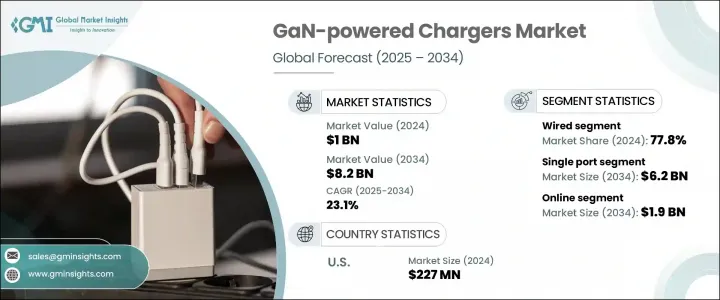
2024年,全球氮化镓充电器市场规模达10亿美元,预计2034年将以23.1%的复合年增长率成长,达到82亿美元。这一快速增长的动力源于家庭和各行各业智慧型设备的日益融合,以及电动车和自动化工业系统等行业日益增长的需求。随着全球数位互联互通的不断加深,越来越多的消费者和企业依赖高耗电电子设备,这反过来又加速了对紧凑、节能、高速充电方案的需求。
基于GaN的充电器因其紧凑的设计、更快的功率输出和更高的热效率而日益普及。这些特性符合当前人们对更小、充电更快、功耗更低的设备的技术需求。随着全球电气化进程的推进,尤其是在交通运输和製造业,向GaN供电系统的转变趋势日益明显。
| 市场范围 | |
|---|---|
| 起始年份 | 2024 |
| 预测年份 | 2025-2034 |
| 起始值 | 10亿美元 |
| 预测值 | 82亿美元 |
| 复合年增长率 | 23.1% |
它们能够提供紧凑的架构和高效的能量转换,使其成为不断发展的电动车基础设施和智慧工业环境的首选。随着工业和交通系统日益向电气化转型,对能够最大限度减少能量损耗和占用更少空间的高性能充电解决方案的需求也日益增长。 GaN 充电设备非常适合这种转变,因为它们能够实现更快的充电週期、减少热量积聚,并能够无缝整合到优先考虑空间优化和节能的下一代设计中。
2024年,有线充电市场占了77.8%的市占率。该领域因其高效、兼容多种快充协议以及高可靠性而备受青睐,尤其是在以工作为中心和混合充电环境中。用户仍然依赖有线充电,因为它速度快、一致性高,尤其是在专业和旅行场景中。 USB-C PD等通用充电协定的广泛接受也支持了有线解决方案的主导地位。建议製造商优先考虑有线GaN充电器设计的创新,特别是整合多协议支持,以满足追求高性能和注重成本的买家的需求。
单埠 GaN 充电器市场预计到 2034 年将达到 62 亿美元,这得益于其在追求简洁便携性的个人群体中的强大吸引力。这类充电器尤其受到学生、通勤者和追求快速行动充电的极简主义用户的青睐。其紧凑的尺寸和与旗舰电子设备的兼容性使其成为满足日常需求的实用之选。此外,USB-C 供电标准的日益普及,透过简化电力传输并优化尺寸,将继续支持市场成长。製造商正在积极推出功率范围为 30W 至 65W 的袖珍 GaN 型号,瞄准寻求节省空间和高效充电方案的用户。
北美GaN充电器市场占24.9%的市场份额,预计2025年至2034年的复合年增长率将达到24%。这一成长趋势主要源自于消费者对高效能充电器日益增长的期望,以及节能电子解决方案的日益普及。该地区对紧凑型、高热效率和高速充电设备的青睐,正在推动GaN技术的发展。消费者的偏好正在从笨重、充电速度慢的产品转向更时尚、更先进、更符合永续发展实践和效能需求的解决方案。
塑造GaN供电充电器市场的主要产业参与者包括Baseus Technology、RAVPower、Anker Innovations、Belkin International和Aukey International。这些公司正在积极投资研究、创新和产品多样化,以巩固其在竞争格局中的地位。为了加强其市场影响力,领先的公司正专注于一系列策略倡议。一项关键策略是持续创新,尤其是在开发紧凑型、高功率、支援多协议的GaN充电器方面,以满足消费者和工业领域不断变化的需求。他们正在利用策略合作伙伴关係和OEM合作来扩大全球分销并渗透新兴市场。此外,企业正在投资垂直整合,以提高供应链效率并降低生产成本。一些品牌优先考虑创造环保且散热高效的设计,以符合全球能源标准和永续技术趋势。这些积极主动的策略正在帮助市场领导者确保长期成长和持久的竞争优势。
目录
第一章:方法论
- 市场范围和定义
- 研究设计
- 研究方法
- 资料收集方法
- 资料探勘来源
- 全球的
- 地区/国家
- 基础估算与计算
- 基准年计算
- 市场评估的主要趋势
- 初步研究和验证
- 主要来源
- 预测模型
- 研究假设和局限性
第二章:执行摘要
第三章:行业洞察
- 产业生态系统分析
- 供应商格局
- 利润率分析
- 成本结构
- 每个阶段的增值
- 影响价值链的因素
- 中断
- 产业衝击力
- 成长动力
- 智慧型设备和消费性电子产品的普及
- 电动车和工业应用的采用率不断提高
- USB-C 和 PD 充电标准的采用率不断上升
- 成长动力
3.2.1.4. 5G基础设施和物联网生态系统的扩展
- 远端工作和行动装置使用量激增
- 产业陷阱与挑战
- GaN组件和製造成本高昂
- 与旧设备的兼容性限制
- 市场机会
- 对紧凑型、高效能充电器的需求不断增长
- 电动汽车和便携式电动汽车配件的成长
- GaN n 在工业和医疗电子中的集成
- 通用多埠充电站的开发
- 成长潜力分析
- 监管格局
- 北美洲
- 欧洲
- 亚太地区
- 拉丁美洲
- 中东和非洲
- 波特的分析
- PESTEL分析
- 科技与创新格局
- 当前的技术趋势
- 新兴技术
- 价格趋势
- 按地区
- 按产品
- 定价策略
- 新兴商业模式
- 合规性要求
- 专利和智慧财产权分析
- 地缘政治与贸易动态
第四章:竞争格局
- 介绍
- 公司市占率分析
- 按地区
- 北美洲
- 欧洲
- 亚太地区
- 拉丁美洲
- 中东和非洲
- 按地区
- 关键参与者的竞争基准
- 财务绩效比较
- 收入
- 利润率
- 研发
- 产品组合比较
- 产品范围广度
- 科技
- 创新
- 地理位置比较
- 全球足迹分析
- 服务网路覆盖
- 各地区市场渗透率
- 竞争定位矩阵
- 领导者
- 挑战者
- 追踪者
- 利基市场参与者
- 战略展望矩阵
- 财务绩效比较
- 2021-2024 年关键发展
- 併购
- 伙伴关係和合作
- 技术进步
- 扩张和投资策略
- 永续发展倡议
- 数位转型倡议
- 新兴/新创企业竞争对手格局
第五章:市场估计与预测:按类型,2021 - 2034 年
- 主要趋势
- 有线
- 无线的
第六章:市场估计与预测:依产品类型,2021 - 2034 年
- 主要趋势
- 壁式充电器
- 桌面充电器
- 旅行适配器
- 其他的
第七章:市场估计与预测:按港口数量,2021 - 2034 年
- 主要趋势
- 单埠
- 多埠
第八章:市场估计与预测:按发电量,2021 - 2034
- 主要趋势
- 高达 30 瓦
- 31瓦至65瓦
- 66瓦至100瓦
- 101瓦至200瓦
- 200W以上
第九章:市场估计与预测:按港口类型,2021 - 2034 年
- 主要趋势
- USB C 型
- USB A 型
- 混合埠
第 10 章:市场估计与预测:按设备相容性,2021 年至 2034 年
- 主要趋势
- 智慧型手机
- 平板电脑
- 笔记型电脑
- 智慧手錶和穿戴式装置
- 随身游戏机
- 相机和无人机
- 其他的
第 11 章:市场估计与预测:按销售管道,2021 年至 2034 年
- 主要趋势
- 在线的
- 离线
第 12 章:市场估计与预测:依最终用途,2021 年至 2034 年
- 主要趋势
- 个人消费者
- 企业和公司
- 政府和国防
- 其他的
第 13 章:市场估计与预测:按地区,2021 年至 2034 年
- 主要趋势
- 北美洲
- 我们
- 加拿大
- 欧洲
- 德国
- 英国
- 法国
- 义大利
- 西班牙
- 荷兰
- 亚太地区
- 中国
- 印度
- 日本
- 澳洲
- 韩国
- 拉丁美洲
- 巴西
- 墨西哥
- 阿根廷
- MEA
- 南非
- 沙乌地阿拉伯
- 阿联酋
第 14 章:公司简介
- Global Key Players
- Regional Key Players
- 利基市场参与者/颠覆者
- DSD技术
- iWalk电子
- OmniCharge
- Zendure
The Global GaN-powered Chargers Market was valued at USD 1 billion in 2024 and is estimated to grow at a CAGR of 23.1% to reach USD 8.2 billion by 2034. This rapid growth is being fueled by the increasing integration of smart devices across households and industries, along with growing demand from sectors such as electric vehicles and automated industrial systems. As global digital connectivity deepens, more consumers and businesses are relying on power-hungry electronics, which in turn accelerates the need for compact, energy-efficient, and high-speed charging options.
GaN-based chargers are gaining popularity for their compact designs, faster power delivery, and improved thermal efficiency. These features align with current technological demands for devices that are smaller, charge faster, and waste less power. As electrification efforts expand globally, especially in transportation and manufacturing, the shift toward GaN-powered systems is becoming more apparent.
| Market Scope | |
|---|---|
| Start Year | 2024 |
| Forecast Year | 2025-2034 |
| Start Value | $1 Billion |
| Forecast Value | $8.2 Billion |
| CAGR | 23.1% |
Their ability to offer compact architecture while delivering efficient energy conversion is making them a preferred choice in evolving EV infrastructure and smart industrial settings. As industries and transportation systems increasingly transition toward electrification, the demand for high-performance charging solutions that minimize energy loss and occupy less space is surging. GaN-powered chargers are ideally suited for this shift, as they enable faster charging cycles, reduce thermal buildup, and integrate seamlessly into next-generation designs that prioritize space optimization and energy savings.
The wired segment held a 77.8% share in 2024. This segment is favored for its efficiency, compatibility with various fast-charging protocols, and high reliability, particularly in work-centric and hybrid environments. Users continue to rely on wired charging for its speed and consistency, especially in professional and travel scenarios. The dominance of wired solutions is also supported by the broad acceptance of universal charging protocols like USB-C PD. Manufacturers are advised to prioritize innovations in wired GaN charger design, especially by integrating multi-protocol support to meet the demands of both high-performance and cost-conscious buyers.
The single-port GaN charger segment is expected to reach USD 6.2 billion by 2034, supported by its strong appeal among individuals seeking simplicity and portability. These chargers are especially popular with students, commuters, and minimalist users who require quick, on-the-go charging. Their compact size and compatibility with flagship electronic devices make them a practical choice for everyday needs. Moreover, the growing uptake of the USB-C Power Delivery standard continues to support market growth by simplifying power transfer while optimizing size. Manufacturers are actively launching pocket-sized GaN models in the 30W to 65W power range, targeting users looking for space-saving and efficient charging options.
North America GaN-powered Chargers Market held 24.9% share and is forecast to grow at a CAGR of 24% from 2025 to 2034. This upward trend is primarily driven by growing consumer expectations for high-performance chargers and the increasing adoption of energy-conscious electronic solutions. The region's embrace of compact, thermally efficient, and high-speed charging devices is pushing GaN technology forward. Consumer preferences are shifting away from bulky, slow-charging products to sleeker, more advanced solutions that align with sustainable practices and performance needs.
Major industry players shaping the GaN-powered charger market include Baseus Technology, RAVPower, Anker Innovations, Belkin International, and Aukey International. These companies are actively investing in research, innovation, and product diversification to solidify their positions within the competitive landscape. To strengthen their market presence, leading companies are focusing on a range of strategic initiatives. A key tactic involves continuous innovation, especially in developing compact, high-wattage GaN chargers with multi-protocol support that cater to the evolving needs of both consumer and industrial segments. Strategic partnerships and OEM collaborations are being leveraged to expand global distribution and penetrate emerging markets. Additionally, firms are investing in vertical integration to improve supply chain efficiency and reduce production costs. Some brands are prioritizing the creation of environmentally friendly and thermally efficient designs, aligning with global energy standards and sustainable technology trends. These proactive strategies are helping market leaders secure long-term growth and a resilient competitive advantage.
Table of Contents
Chapter 1 Methodology
- 1.1 Market scope and definition
- 1.2 Research design
- 1.2.1 Research approach
- 1.2.2 Data collection methods
- 1.3 Data mining sources
- 1.3.1 Global
- 1.3.2 Regional/Country
- 1.4 Base estimates and calculations
- 1.4.1 Base year calculation
- 1.4.2 Key trends for market estimation
- 1.5 Primary research and validation
- 1.5.1 Primary sources
- 1.6 Forecast model
- 1.7 Research assumptions and limitations
Chapter 2 Executive Summary
- 2.1 Industry 3600 synopsis, 2021 - 2034
- 2.2 Key market trends
- 2.2.1 Type trends
- 2.2.2 Product type trends
- 2.2.3 Number of ports trends
- 2.2.4 Power output trends
- 2.2.5 Port type trends
- 2.2.6 Device compatibility trends
- 2.2.7 Sales channel trends
- 2.2.8 End use trends
- 2.2.9 Regional trends
- 2.3 TAM Analysis, 2025-2034
- 2.4 CXO perspectives: Strategic imperatives
- 2.4.1 Executive decision points
- 2.4.2 Critical success factors
- 2.5 Future outlook and strategic recommendations
Chapter 3 Industry Insights
- 3.1 Industry ecosystem analysis
- 3.1.1 Supplier landscape
- 3.1.2 Profit margin analysis
- 3.1.3 Cost structure
- 3.1.4 Value addition at each stage
- 3.1.5 Factor affecting the value chain
- 3.1.6 Disruptions
- 3.2 Industry impact forces
- 3.2.1 Growth drivers
- 3.2.1.1 Proliferation of smart devices and consumer electronics
- 3.2.1.2 Increased adoption in electric vehicles and industrial applications
- 3.2.1.3 Rising adoption of USB-C and PD charging standards
- 3.2.1 Growth drivers
3.2.1.4. Expansion of 5G infrastructure and IoT ecosystems
- 3.2.1.5 Surge in remote work and mobile device usage
- 3.2.2 Industry pitfalls and challenges
- 3.2.2.1 High costs associated with GaN components and manufacturing
- 3.2.2.2 Compatibility limitations with legacy devices
- 3.2.3 Market opportunities
- 3.2.3.1 Rising demand for compact, high-efficiency chargers
- 3.2.3.2 Growth in electric mobility and portable EV accessories
- 3.2.3.3 Integration of GaN n in industrial and medical electronics
- 3.2.3.4 Development of universal multi-port charging stations
- 3.3 Growth potential analysis
- 3.4 Regulatory landscape
- 3.4.1 North America
- 3.4.2 Europe
- 3.4.3 Asia Pacific
- 3.4.4 Latin America
- 3.4.5 Middle East & Africa
- 3.5 Porter's analysis
- 3.6 PESTEL analysis
- 3.7 Technology and Innovation landscape
- 3.7.1 Current technological trends
- 3.7.2 Emerging technologies
- 3.8 Price trends
- 3.8.1 By region
- 3.8.2 By product
- 3.9 Pricing strategies
- 3.10 Emerging business models
- 3.11 Compliance requirements
- 3.12 Patent and IP analysis
- 3.13 Geopolitical and trade dynamics
Chapter 4 Competitive Landscape, 2024
- 4.1 Introduction
- 4.2 Company market share analysis
- 4.2.1 By region
- 4.2.1.1 North America
- 4.2.1.2 Europe
- 4.2.1.3 Asia Pacific
- 4.2.1.4 Latin America
- 4.2.1.5 Middle East & Africa
- 4.2.1 By region
- 4.3 Competitive benchmarking of key players
- 4.3.1 Financial performance comparison
- 4.3.1.1 Revenue
- 4.3.1.2 Profit margin
- 4.3.1.3 R&D
- 4.3.2 Product portfolio comparison
- 4.3.2.1 Product range breadth
- 4.3.2.2 Technology
- 4.3.2.3 Innovation
- 4.3.3 Geographic presence comparison
- 4.3.3.1 Global footprint analysis
- 4.3.3.2 Service network coverage
- 4.3.3.3 Market penetration by region
- 4.3.4 Competitive positioning matrix
- 4.3.4.1 Leaders
- 4.3.4.2 Challengers
- 4.3.4.3 Followers
- 4.3.4.4 Niche players
- 4.3.5 Strategic outlook matrix
- 4.3.1 Financial performance comparison
- 4.4 Key developments, 2021-2024
- 4.4.1 Mergers and acquisitions
- 4.4.2 Partnerships and collaborations
- 4.4.3 Technological advancements
- 4.4.4 Expansion and investment strategies
- 4.4.5 Sustainability initiatives
- 4.4.6 Digital transformation initiatives
- 4.5 Emerging/ startup competitors landscape
Chapter 5 Market Estimates and Forecast, By Type, 2021 - 2034 (USD Million & Thousand Units)
- 5.1 Key trends
- 5.2 Wired
- 5.3 Wireless
Chapter 6 Market Estimates and Forecast, By Product Type, 2021 - 2034 (USD Million & Thousand Units)
- 6.1 Key trends
- 6.2 Wall chargers
- 6.3 Desktop chargers
- 6.4 Travel adapters
- 6.5 Others
Chapter 7 Market Estimates and Forecast, By Number of Ports, 2021 - 2034 (USD Million & Thousand Units)
- 7.1 Key trends
- 7.2 Single port
- 7.3 Multi port
Chapter 8 Market Estimates and Forecast, By Power Output, 2021 - 2034 (USD Million & Thousand Units)
- 8.1 Key trends
- 8.2 Up to 30w
- 8.3 31w to 65w
- 8.4 66w to 100w
- 8.5 101w to 200w
- 8.6 Above 200w
Chapter 9 Market Estimates and Forecast, By Port Type, 2021 - 2034 (USD Million & Thousand Units)
- 9.1 Key trends
- 9.2 USB type-C
- 9.3 USB type-A
- 9.4 Mixed port
Chapter 10 Market Estimates and Forecast, By Device Compatibility, 2021 - 2034 (USD Million & Thousand Units)
- 10.1 Key trends
- 10.2 Smartphones
- 10.3 Tablets
- 10.4 Laptops
- 10.5 Smartwatches & wearables
- 10.6 Portable game consoles
- 10.7 Cameras & drones
- 10.8 Others
Chapter 11 Market Estimates and Forecast, By Sales Channel, 2021 - 2034 (USD Million & Thousand Units)
- 11.1 Key trends
- 11.2 Online
- 11.3 Offline
Chapter 12 Market Estimates and Forecast, By End Use, 2021 - 2034 (USD Million & Thousand Units)
- 12.1 Key trends
- 12.2 Individual consumers
- 12.3 Enterprises & corporates
- 12.4 Government & defense
- 12.5 Others
Chapter 13 Market Estimates & Forecast, By Region, 2021 - 2034 (USD Million & Thousand Units)
- 13.1 Key trends
- 13.2 North America
- 13.2.1 U.S.
- 13.2.2 Canada
- 13.3 Europe
- 13.3.1 Germany
- 13.3.2 UK
- 13.3.3 France
- 13.3.4 Italy
- 13.3.5 Spain
- 13.3.6 Netherlands
- 13.4 Asia Pacific
- 13.4.1 China
- 13.4.2 India
- 13.4.3 Japan
- 13.4.4 Australia
- 13.4.5 South Korea
- 13.5 Latin America
- 13.5.1 Brazil
- 13.5.2 Mexico
- 13.5.3 Argentina
- 13.6 MEA
- 13.6.1 South Africa
- 13.6.2 Saudi Arabia
- 13.6.3 UAE
Chapter 14 Company Profiles
- 14.1 Global Key Players
- 14.1.1 Anker Innovations
- 14.1.2 Aukey International
- 14.1.3 Baseus Technology
- 14.1.4 Belkin International
- 14.1.5 RAVPower
- 14.2 Regional Key Players
- 14.2.1 North America
- 14.2.1.1 Apple
- 14.2.1.2 Energizer
- 14.2.1.3 Spigen
- 14.2.1.4 Satechi
- 14.2.2 Europe
- 14.2.2.1 Philips
- 14.2.2.2 VOLTME
- 14.2.2.3 Hama GmbH & Co KG
- 14.2.3 APAC
- 14.2.3.1 Samsung Electronics
- 14.2.3.2 Xiaomi
- 14.2.3.3 UGREEN Group
- 14.2.3.4 Pisen Electronics
- 14.2.3.5 Momax Technology
- 14.2.3.6 Zonsan Electronics
- 14.2.1 North America
- 14.3 Niche Players / Disruptors
- 14.3.1 DSD Tech
- 14.3.2 iWalk Electronics
- 14.3.3 OmniCharge
- 14.3.4 Zendure
 2026年全球便携式直流快速充电器市场报告
 2035年无线充电器市场氮化镓(GaN)分析与预测:按类型、产品类型、服务、技术、组件、应用、设备、最终用户、功能和安装类型划分氮化镓充电器市场分析及预测(至2035年):依类型、产品类型、技术、组件、应用、设备、最终用户、功能及安装类型划分2026年全球USB墙式充电器市场报告2026年全球有线充电市场报告
 氮化镓充电器市场 - 全球产业规模、份额、趋势、机会及预测(按功率、应用、最终用户、地区和竞争格局划分,2021-2031)
 氮化镓(GaN)电动车充电器市场机会、成长驱动因素、产业趋势分析及预测(2025-2034年)
 可携式直流快速充电器:全球市场份额和排名、总收入和需求预测(2025-2031 年)
 氮化镓(GaN)充电器:全球市场
 65W GaN 充电器市场(按连接器连接埠、连接埠类型、应用和分销管道)—2025 年至 2030 年全球预测