


 |
市场调查报告书
商品编码
1797770
电子设备维修服务市场机会、成长动力、产业趋势分析及 2025 - 2034 年预测Electronic Equipment Repair Services Market Opportunity, Growth Drivers, Industry Trend Analysis, and Forecast 2025 - 2034 |
||||||
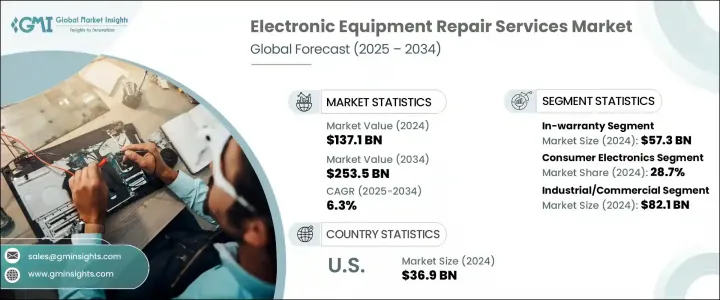
2024 年全球电子设备维修服务市场规模达 1,371 亿美元,预计到 2034 年将以 6.3% 的复合年增长率成长,达到 2,535 亿美元。推动这一市场成长的主要因素包括:对永续性和电子垃圾的担忧、新电子产品成本的上涨,以及工业和医疗设备使用的日益增长。由于电子垃圾中含有有害物质且回收系统效率低下,其环境问题日益严重,维修服务已成为关键的解决方案。此外,随着设备更换成本的不断上升,消费者和企业都在寻求维修服务,将其作为购买新产品的经济实惠的替代方案。智慧型手机、笔记型电脑和工业电子产品等高阶设备通常价格不菲,因此维修成为延长这些产品使用寿命的更可行、更经济的选择。
随着消费性电子产品的普及以及工业和医疗设备应用的不断扩大,维修服务的需求也不断增长。消费者也越来越关注环境永续性,这导致他们更倾向于维修而非更换。在这种不断变化的环境下,企业正在透过提供可靠、实惠且高效的维修服务来适应客户需求,以维护客户群并实现永续发展目标。
| 市场范围 | |
|---|---|
| 起始年份 | 2024 |
| 预测年份 | 2025-2034 |
| 起始值 | 1371亿美元 |
| 预测值 | 2535亿美元 |
| 复合年增长率 | 6.3% |
就服务类型而言,市场分为保固期内和保固期外服务。保固期内服务市场规模在2024年达到573亿美元,受益于製造商支援的维修服务,这些维修服务需求可预测,并降低了消费者的自付费用。製造商通常提供12至24个月的保固期,以涵盖材料和工艺缺陷,这巩固了原始设备製造商(OEM)在该领域的主导地位。为了满足日益增长的保固期内服务需求,维修服务提供者必须专注于获得经批准的服务协议,并利用技术驱动的诊断技术来最大限度地缩短维修时间并改善服务交付。
2024年,消费性电子产品领域占了28.7%的市场。智慧型手机、笔记型电脑和其他个人设备的快速成长推动了维修服务的需求。随着消费者越来越注重性价比,维修服务正成为越来越受欢迎的设备更换替代方案,尤其是在电子产品市场快速发展的背景下。
2024年,美国电子设备维修服务市场产值达369亿美元,得益于强大的工业基础设施和高消费性电子产品普及率。美国消费者行为正在发生变化,根据美国消费者技术协会的数据,超过45%的美国消费者选择维修而非更换。随着消费者面临设备价格上涨以及环保意识增强,预计这一趋势将持续下去。旨在抢占美国市场份额的服务供应商需要专注于扩展其授权服务中心网路、提升诊断能力并支持环保实践。
全球电子设备维修服务市场的领导者包括罗克韦尔自动化公司、荷兰皇家飞利浦公司、柯蒂斯-莱特公司、Encompass供应链解决方案公司和福斯公共有限公司等公司。为了巩固其在电子设备维修服务市场的地位,领先企业正致力于扩展服务网路并增强服务产品。一项关键策略是深化与原始设备製造商的合作伙伴关係,以确保获得授权维修服务和认证,这对于保固期内的维修至关重要。此外,企业正在投资先进的诊断工具和技术,以简化维修流程并最大限度地减少停机时间,从而确保更快地为客户提供週转服务。企业也专注于永续发展,采用环保做法,例如使用环保材料和减少电子垃圾。另一项重要策略是开发数位平台,使客户能够轻鬆获得维修服务,从而进一步提高便利性和客户满意度。最后,服务提供者希望透过提供基于客户特定需求的客製化服务来脱颖而出,尤其是在个人化维修解决方案需求日益增长的背景下。
目录
第一章:方法论与范围
第二章:执行摘要
第三章:行业洞察
- 产业生态系统分析
- 供应商格局
- 利润率
- 成本结构
- 每个阶段的增值
- 影响价值链的因素
- 中断
- 衝击力
- 成长动力
- 新电子产品成本上涨
- 永续性和电子垃圾问题
- 消费性电子产品的扩张
- 增加工业和医疗设备的使用
- 第三方维修供应商的成长
- 产业陷阱与挑战
- 技术快速淘汰
- 对OEM零件和工具的存取受限
- 成长动力
- 成长潜力分析
- 监管格局
- 北美洲
- 欧洲
- 亚太地区
- 拉丁美洲
- 中东和非洲
- 波特的分析
- PESTEL分析
- 技术和创新格局
- 当前的技术趋势
- 新兴技术
- 新兴商业模式
- 合规性要求
- 消费者情绪分析
- 专利和智慧财产权分析
- 地缘政治与贸易动态
第四章:竞争格局
- 介绍
- 公司市占率分析
- 按地区
- 市场集中度分析
- 关键参与者的竞争基准
- 财务绩效比较
- 收入
- 利润率
- 研发
- 产品组合比较
- 产品范围广度
- 科技
- 创新
- 地理位置比较
- 全球足迹分析
- 服务网路覆盖
- 各地区市场渗透率
- 竞争定位矩阵
- 领导者
- 挑战者
- 追踪者
- 利基市场参与者
- 战略展望矩阵
- 财务绩效比较
- 2021-2024 年关键发展
- 併购
- 伙伴关係和合作
- 技术进步
- 扩张和投资策略
- 数位转型倡议
- 新兴/新创企业竞争对手格局
第五章:市场估计与预测:依服务类型,2021-2034 年
- 主要趋势
- 保固期内
- 超出保固期
第六章:市场估计与预测:依产品类型,2021-2034
- 主要趋势
- 消费性电子产品
- 智慧型手机和行动电话
- 电视机
- 笔记型电脑
- 平板电脑
- 其他的
- 家用电器
- 冰箱
- 空调
- 微波炉
- 洗衣机
- 其他的
- 医疗设备
- 医疗监视器
- 实验室设备
- 牙医诊所设备
- 呼吸器
- CT扫描仪
- 其他的
- 工业设备
- 电动机和发电机
- 电压表
- 可程式逻辑控制器(PLC)
- 雷射设备
- 其他的
- 其他的
第七章:市场估计与预测:依销售管道,2021-2034 年
- 主要趋势
- 授权服务中心
- 第三方维修店
- 其他的
第八章:市场估计与预测:依最终用途,2021-2034
- 主要趋势
- 工业/商业
- 住宅
第九章:市场估计与预测:按地区,2021-2034
- 主要趋势
- 北美洲
- 我们
- 加拿大
- 欧洲
- 英国
- 德国
- 法国
- 义大利
- 西班牙
- 荷兰
- 亚太地区
- 中国
- 印度
- 日本
- 韩国
- 澳洲
- 拉丁美洲
- 巴西
- 墨西哥
- 阿根廷
- MEA
- 南非
- 沙乌地阿拉伯
- 阿联酋
第十章:公司简介
- Global Key Players
- Regional Key Players
- 颠覆者/利基市场参与者
- iCracked公司
- 福斯电子
The Global Electronic Equipment Repair Services Market was valued at USD 137.1 billion in 2024 and is estimated to grow at a CAGR of 6.3% to reach USD 253.5 billion by 2034. This market growth is driven by concerns surrounding sustainability and e-waste, rising costs of new electronics, and the growing use of industrial and medical devices. With electronic waste becoming an increasing environmental concern due to the harmful substances it contains and the inefficiency of recycling systems, repair services have become a critical solution. Additionally, as the cost of replacing devices continues to rise, consumers and businesses alike are seeking repair services as a cost-effective alternative to purchasing new products. High-end devices like smartphones, laptops, and industrial electronics often come with a hefty price tag, making repairs a more viable and economical option for extending the life of these products.
The demand for repair services is growing in line with the increasing penetration of consumer electronics and the expanding use of industrial and medical devices. Consumers are also becoming more focused on environmental sustainability, contributing to the preference for repairs instead of replacements. In this changing landscape, businesses are adapting to customer needs by offering reliable, affordable, and efficient repair services to maintain their customer base and meet sustainability goals.
| Market Scope | |
|---|---|
| Start Year | 2024 |
| Forecast Year | 2025-2034 |
| Start Value | $137.1 Billion |
| Forecast Value | $253.5 Billion |
| CAGR | 6.3% |
In terms of service types, the market is divided into in-warranty and out-of-warranty services. The in-warranty segment, which was valued at USD 57.3 billion in 2024, benefits from manufacturer-backed repairs that offer predictable demand and lower out-of-pocket costs for consumers. Manufacturers typically offer warranties of 12 to 24 months to cover defects in materials and workmanship, which supports the dominance of original equipment manufacturers (OEMs) in this segment. To tap into the growing demand for in-warranty services, repair providers must focus on obtaining approved service agreements and leveraging technology-driven diagnostics to minimize repair times and improve service delivery.
The consumer electronics segment accounted for a 28.7% share in 2024. The rapid growth in the use of smartphones, laptops, and other personal devices is driving the demand for repair services. As consumers become more focused on cost-effective options, repair services are becoming an increasingly popular alternative to device replacement, especially given the rapidly evolving nature of the electronics market.
U.S. Electronic Equipment Repair Services Market generated USD 36.9 billion in 2024, benefiting from a strong industrial infrastructure and high consumer electronics penetration. Consumer behavior in the U.S. is shifting, with more than 45% of U.S. consumers opting for repairs rather than replacements, according to the Consumer Technology Association. This trend is expected to continue as consumers face rising device prices and become more environmentally conscious. Service providers aiming to capture market share in the U.S. need to focus on expanding their authorized service center networks, improving diagnostic capabilities, and supporting environmentally friendly practices.
The top players in the Global Electronic Equipment Repair Services Market include companies like Rockwell Automation Inc., Koninklijke Philips N.V., Curtiss-Wright Corporation, Encompass Supply Chain Solutions, and Forth Corporation Public Company Limited. To strengthen their position in the electronic equipment repair services market, leading companies are focusing on expanding their service networks and enhancing their service offerings. A key strategy involves deepening partnerships with OEMs to ensure authorized repair services and certifications, which are essential for warranty-backed repairs. Additionally, businesses are investing in advanced diagnostic tools and technologies to streamline repair processes and minimize downtime, ensuring a faster turnaround for customers. Companies are also focusing on sustainability by incorporating environmentally friendly practices such as using eco-friendly materials and reducing e-waste. Another important strategy is the development of digital platforms that enable easy customer access to repair services, further enhancing convenience and customer satisfaction. Lastly, service providers are looking to differentiate themselves by offering customized services, based on the specific needs of the customers, especially as the demand for personalized repair solutions increases.
Table of Contents
Chapter 1 Methodology & Scope
- 1.1 Market scope and definition
- 1.2 Research design
- 1.2.1 Research approach
- 1.2.2 Data collection methods
- 1.3 Data mining sources
- 1.3.1 Global
- 1.3.2 Regional/Country
- 1.4 Base estimates and calculations
- 1.4.1 Base year calculation
- 1.4.2 Key trends for market estimation
- 1.5 Primary research and validation
- 1.5.1 Primary sources
- 1.6 Forecast model
- 1.7 Research assumptions and limitations
Chapter 2 Executive Summary
- 2.1 Industry 360° synopsis
- 2.2 Key market trends
- 2.2.1 Product type trends
- 2.2.2 Service type trends
- 2.2.3 Product type trends
- 2.2.4 Sales channel trends
- 2.2.5 End use trends
- 2.2.6 Regional trends
- 2.3 TAM Analysis, 2025-2034 (USD Billion)
- 2.4 CXO perspectives: Strategic imperatives
- 2.4.1 Executive decision points
- 2.4.2 Critical success factors
- 2.5 Future Outlook and strategic recommendations
Chapter 3 Industry Insights
- 3.1 Industry ecosystem analysis
- 3.1.1 Supplier landscape
- 3.1.2 Profit margin
- 3.1.3 Cost structure
- 3.1.4 Value addition at each stage
- 3.1.5 Factor affecting the value chain
- 3.1.6 Disruptions
- 3.2 Impact forces
- 3.2.1 Growth drivers
- 3.2.1.1 Rising cost of new electronics
- 3.2.1.2 Sustainability and e-waste concerns
- 3.2.1.3 Expansion of consumer electronics
- 3.2.1.4 Increasing industrial and medical device usage
- 3.2.1.5 Growth of third-party repair providers
- 3.2.2 Industry pitfalls & challenges
- 3.2.2.1 Rapid technological obsolescence
- 3.2.2.2 Limited access to OEM parts and tools
- 3.2.1 Growth drivers
- 3.3 Growth potential analysis
- 3.4 Regulatory landscape
- 3.4.1 North America
- 3.4.2 Europe
- 3.4.3 Asia Pacific
- 3.4.4 Latin America
- 3.4.5 Middle East & Africa
- 3.5 Porter's analysis
- 3.6 PESTEL analysis
- 3.7 Technology and innovation landscape
- 3.7.1 Current technological trends
- 3.7.2 Emerging technologies
- 3.8 Emerging business models
- 3.9 Compliance requirements
- 3.10 Consumer sentiment analysis
- 3.11 Patent and IP analysis
- 3.12 Geopolitical and trade dynamics
Chapter 4 Competitive Landscape, 2024
- 4.1 Introduction
- 4.2 Company market share analysis
- 4.2.1 By region
- 4.2.1.1 North America
- 4.2.1.2 Europe
- 4.2.1.3 Asia Pacific
- 4.2.1.4 Latin America
- 4.2.1.5 MEA
- 4.2.2 Market concentration analysis
- 4.2.1 By region
- 4.3 Competitive benchmarking of key players
- 4.3.1 Financial performance comparison
- 4.3.1.1 Revenue
- 4.3.1.2 Profit margin
- 4.3.1.3 R&D
- 4.3.2 Product portfolio comparison
- 4.3.2.1 Product range breadth
- 4.3.2.2 Technology
- 4.3.2.3 Innovation
- 4.3.3 Geographic presence comparison
- 4.3.3.1 Global footprint analysis
- 4.3.3.2 Service network coverage
- 4.3.3.3 Market penetration by region
- 4.3.4 Competitive positioning matrix
- 4.3.4.1 Leaders
- 4.3.4.2 Challengers
- 4.3.4.3 Followers
- 4.3.4.4 Niche players
- 4.3.5 Strategic outlook matrix
- 4.3.1 Financial performance comparison
- 4.4 Key developments, 2021-2024
- 4.4.1 Mergers and acquisitions
- 4.4.2 Partnerships and collaborations
- 4.4.3 Technological advancements
- 4.4.4 Expansion and investment strategies
- 4.4.5 Digital Transformation Initiatives
- 4.5 Emerging/ Startup Competitors Landscape
Chapter 5 Market Estimates & Forecast, By Service Type, 2021-2034 (USD Million)
- 5.1 Key trends
- 5.2 In-warranty
- 5.3 Out-of-warranty
Chapter 6 Market Estimates & Forecast, By Product Type, 2021-2034 (USD Million)
- 6.1 Key trends
- 6.2 Consumer electronics
- 6.2.1 Smartphones & mobile phones
- 6.2.2 Televisions
- 6.2.3 Notebooks & laptops
- 6.2.4 Tablets
- 6.2.5 Others
- 6.3 Home Appliances
- 6.3.1 Refrigerators
- 6.3.2 Air conditioners
- 6.3.3 Microwaves
- 6.3.4 Washing machines
- 6.3.5 Others
- 6.4 Medical equipment
- 6.4.1 Medical monitors
- 6.4.2 Lab equipment
- 6.4.3 Dental clinic equipment
- 6.4.4 Ventilators
- 6.4.5 CT scanners
- 6.4.6 Others
- 6.5 Industrial equipment
- 6.5.1 Motors & generators
- 6.5.2 Voltmeters
- 6.5.3 Programmable Logic Controllers (PLC)
- 6.5.4 Laser equipment
- 6.5.5 Others
- 6.6 Others
Chapter 7 Market Estimates & Forecast, By Sales Channel, 2021-2034 (USD Million)
- 7.1 Key trends
- 7.2 Authorized service centers
- 7.3 Third-party repair shops
- 7.4 Others
Chapter 8 Market Estimates & Forecast, By End Use, 2021-2034 (USD Million)
- 8.1 Key trends
- 8.2 Industrial/Commercial
- 8.3 Residential
Chapter 9 Market Estimates & Forecast, By Region, 2021-2034 (USD Million)
- 9.1 Key trends
- 9.2 North America
- 9.2.1 U.S.
- 9.2.2 Canada
- 9.3 Europe
- 9.3.1 UK
- 9.3.2 Germany
- 9.3.3 France
- 9.3.4 Italy
- 9.3.5 Spain
- 9.3.6 Netherlands
- 9.4 Asia Pacific
- 9.4.1 China
- 9.4.2 India
- 9.4.3 Japan
- 9.4.4 South Korea
- 9.4.5 Australia
- 9.5 Latin America
- 9.5.1 Brazil
- 9.5.2 Mexico
- 9.5.3 Argentina
- 9.6 MEA
- 9.6.1 South Africa
- 9.6.2 Saudi Arabia
- 9.6.3 UAE
Chapter 10 Company Profiles
- 10.1 Global Key Players
- 10.1.1 Koninklijke Philips N.V.
- 10.1.2 Rockwell Automation Inc.
- 10.1.3 Curtiss-Wright Corporation
- 10.1.4 Bose Corporation
- 10.1.5 Quest International, Inc.
- 10.2 Regional Key Players
- 10.2.1 North America
- 10.2.1.1 PSI Repair Services, Inc.
- 10.2.1.2 Altra Service Professionals
- 10.2.1.3 Encompass Supply Chain Solutions
- 10.2.1.4 ASAP electronic repairs
- 10.2.2 Europe
- 10.2.2.1 AML Instruments Limited
- 10.2.2.2 Greasley Electronics LTD
- 10.2.2.3 IER Industrial Electronic Repairs LTD
- 10.2.2.4 Multicare Electronics Ltd.
- 10.2.2.5 Real Electronics 2 Ltd.
- 10.2.2.6 Repair World Direct
- 10.2.2.7 Screamer Electronic Services
- 10.2.2.8 JTD Electronics Ltd
- 10.2.3 Asia Pacific
- 10.2.3.1 Urtronics India
- 10.2.3.2 INDufit MACHINEs
- 10.2.1 North America
- 10.3 Disruptors / Niche Players
- 10.3.1 iCracked, Inc.
- 10.3.2 Forth Electronics


