


 |
市场调查报告书
商品编码
1797827
船用引擎监控系统市场机会、成长动力、产业趋势分析及 2025 - 2034 年预测Marine Engine Monitoring System Market Opportunity, Growth Drivers, Industry Trend Analysis, and Forecast 2025 - 2034 |
||||||
2024 年全球船用引擎监控系统市场价值为 11 亿美元,预计到 2034 年将以 6.1% 的复合年增长率增长至 19.6 亿美元。随着排放标准的收紧和船用引擎技术的日益先进,监控系统已从基本的维护工具转变为优化营运的重要平台。这些系统现在依靠即时资料、数位连接和预测能力来提高燃油效率、安全性和法规遵循。物联网整合、基于人工智慧的分析和智慧感测器网路等技术正在重塑营运商管理船队绩效的方式。该产业也从推动海事数位化的公私合作计画中获得发展动力,同时由OEM主导的努力旨在创建针对智慧海事营运的高级培训生态系统。对数据驱动洞察的需求持续加速整个航运业采用智慧引擎监控工具。
疫情过后,远端诊断和监控技术的应用速度加快,因为限制措施促使船舶营运商采用基于云端的工具来维持营运的连续性。预测性和基于状态的监控功能正在成为大型商用船队的标配,能够及早发现燃油效率低下、气缸过度磨损或润滑故障等问题。这些系统有助于最大限度地减少停机时间,并符合全球永续发展目标。
| 市场范围 | |
|---|---|
| 起始年份 | 2024 |
| 预测年份 | 2025-2034 |
| 起始值 | 11亿美元 |
| 预测值 | 19.6亿美元 |
| 复合年增长率 | 6.1% |
2024年,硬体领域占据63%的市场份额,预计到2034年将以5%的复合年增长率成长。该领域包括控制单元、感测器、资料记录器和通讯模组等关键组件,这些组件有助于实现船上资料的无缝收集和系统整合。新船建造和改装活动的兴起正在推动对硬体安装的需求,尤其是在遵守排放法规和预测性维护能力变得越来越重要的情况下。西门子、ABB和瓦锡兰等领先的原始设备製造商正在将先进的感测器技术直接嵌入到推进和辅助系统中,以实现全面的性能监控。
5,000-10,000 匹马力功率段在 2024 年占据 37% 的市场份额,预计到 2034 年将以 6% 的复合年增长率增长。此功率段内的船舶(通常是中型油轮、近海支援船和货船)由于营运时间延长和监管要求严格,需要可靠的监控。此功率段的监控系统提供详细的分析、预测洞察和 AI 诊断,支援预防性维护、船队优化以及遵守不断变化的环境标准。瞄准此功率段的原始设备製造商 (OEM) 正越来越多地将预测工具整合到其服务产品中。
美国船舶引擎监控系统市场占83%的市场份额,2024年市场规模达3.455亿美元。该国的领先地位得益于其庞大的商用和国防舰船队、排放监管压力以及数位海事技术的广泛应用。对边缘运算、基于人工智慧的引擎诊断和互联繫统的投资正在帮助公共和私人船舶营运商提升绩效。获得政府合约和强大的技术基础设施使美国的原始设备製造商和整合商能够透过高端智慧系统满足国内需求。由于该地区先进的工程能力,MEMS和透过生物燃料电池进行现场监控等技术正在获得更广泛的应用。
积极塑造全球船舶引擎监控系统市场的关键参与者包括卡特彼勒、瓦锡兰、康明斯、西门子、ABB、康斯伯格海事和曼恩能源解决方案。在船舶引擎监控系统市场竞争的公司专注于扩展数位化能力、开发智慧组件并增强全球服务覆盖范围。许多公司正在将人工智慧、物联网和云端连接整合到引擎监控解决方案中,以提供进阶诊断、自动报告和即时洞察。与航运业者的合作使这些公司能够共同开发客製化解决方案,从而提高营运效率。一些公司也专注于混合动力推进系统,利用监控工具来优化燃油消耗和排放。对培训平台和售后服务生态系统的投资有助于确保客户留存。
目录
第一章:方法论
- 市场范围和定义
- 研究设计
- 研究方法
- 资料收集方法
- 资料探勘来源
- 全球的
- 地区/国家
- 基础估算与计算
- 基准年计算
- 市场评估的主要趋势
- 初步研究和验证
- 主要来源
- 预测模型
- 研究假设和局限性
第二章:执行摘要
第三章:行业洞察
- 产业生态系统分析
- 供应商格局
- 利润率分析
- 成本结构
- 每个阶段的增值
- 影响价值链的因素
- 中断
- 产业衝击力
- 成长动力
- 节能船舶营运的需求增加
- 国际海事组织 (IMO) 法规导致合规需求激增
- 远端诊断和基于物联网的解决方案的部署增加
- 海上贸易成长与船队扩张
- 产业陷阱与挑战
- MEMS系统初始投资成本高
- 缺乏熟练的海事技术人员来部署系统
- 市场机会
- MEMS 在混合动力和电力推进系统中的扩展
- 自主和远端操作船舶项目激增
- 智慧港口和互联航道的投资不断增加
- 造船厂采用数位孪生技术
- 成长动力
- 成长潜力分析
- 监管格局
- 北美洲
- 欧洲
- 亚太地区
- 拉丁美洲
- 中东和非洲
- 波特的分析
- PESTEL分析
- 技术和创新格局
- 当前的技术趋势
- 新兴技术
- 价格趋势
- 按地区
- 按产品
- 成本細項分析
- 专利分析
- 永续性和环境方面
- 永续实践
- 减少废弃物的策略
- 生产中的能源效率
- 环保倡议
- 碳足迹考量
第四章:竞争格局
- 介绍
- 公司市占率分析
- 北美洲
- 欧洲
- 亚太地区
- 拉丁美洲
- MEA
- 主要市场参与者的竞争分析
- 竞争定位矩阵
- 战略展望矩阵
- 关键进展
- 併购
- 伙伴关係与合作
- 新产品发布
- 扩张计划和资金
第五章:市场估计与预测:按组件,2021 - 2034 年
- 主要趋势
- 硬体
- 感应器
- 控制单元
- 展示
- 控制器
- 其他的
- 软体
- 数据分析软体
- 预测性维护软体
- 其他的
- 服务
第六章:市场估计与预测:按功率,2021 - 2034 年
- 主要趋势
- 1,000 匹马力
- 1,000-5,000 马力
- 5,001-10,000 马力
- 10,000 生命值及以上
第七章:市场估计与预测:依部署模式,2021 - 2034 年
- 主要趋势
- 现场监控
- 远端监控
第八章:市场估计与预测:按推进方式,2021 - 2034 年
- 主要趋势
- 柴油引擎
- 瓦斯涡轮机
- 其他的
第九章:市场估计与预测:按应用,2021 - 2034
- 主要趋势
- 效能监控
- 燃油效率优化
- 维护诊断
- 安全和法规遵从性
第十章:市场估计与预测:依最终用途,2021 - 2034 年
- 商用船舶
- 货船
- 油轮
- 货柜船
- 海军舰艇
- 客船
- 游轮
- 渡轮
- 其他的
第 11 章:市场估计与预测:按地区,2021 年至 2034 年
- 主要趋势
- 北美洲
- 我们
- 加拿大
- 欧洲
- 英国
- 法国
- 义大利
- 西班牙
- 俄罗斯
- 北欧人
- 亚太地区
- 中国
- 印度
- 日本
- 澳洲
- 韩国
- 菲律宾
- 越南
- 印尼
- 拉丁美洲
- 巴西
- 墨西哥
- 阿根廷
- MEA
- 南非
- 沙乌地阿拉伯
- 阿联酋
- 埃及
第十二章:公司简介
- ABB
- AST
- Caterpillar
- CMR
- Cummins
- Emerson Electric
- General Electric
- Hyundai Heavy Industries
- Jason Marine
- Kongsberg Maritime
- MAN Energy Solutions
- Mitsubishi Heavy Industries
- MTU Friedrichshafen
- NORIS
- Rolls-Royce
- Scania
- Siemens
- Volvo Penta
- Wartsila
- Yanmar
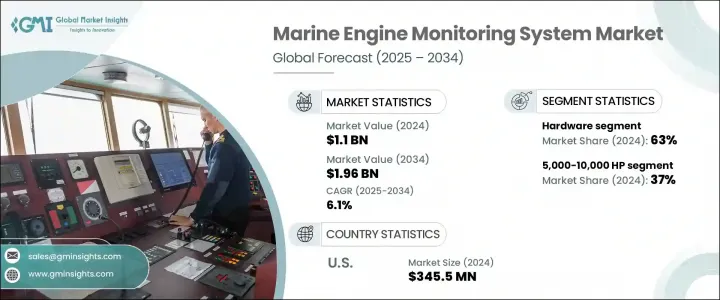
The Global Marine Engine Monitoring System Market was valued at USD 1.1 billion in 2024 and is estimated to grow at a CAGR of 6.1% to reach USD 1.96 billion by 2034. As emission standards tighten and marine engine technologies become more advanced, monitoring systems have transitioned from basic maintenance tools to essential platforms for optimizing operations. These systems now rely on real-time data, digital connectivity, and predictive capabilities to deliver enhanced fuel efficiency, safety, and regulatory compliance. Technologies like IoT integration, AI-based analytics, and intelligent sensor networks are reshaping how operators manage fleet performance. The industry is also gaining momentum from public-private initiatives pushing digitalization in maritime, alongside OEM-led efforts to create advanced training ecosystems tailored for smart maritime operations. The demand for data-driven insights continues to accelerate the adoption of intelligent engine monitoring tools across the shipping industry.
Remote diagnostics and monitoring saw faster adoption following the pandemic, as restrictions prompted marine operators to adopt cloud-based tools to maintain operational continuity. Predictive and condition-based monitoring features are becoming standard across larger commercial fleets, enabling early detection of issues such as fuel inefficiency, excessive cylinder wear, or lubrication faults. These systems help minimize downtime and align with global sustainability goals.
| Market Scope | |
|---|---|
| Start Year | 2024 |
| Forecast Year | 2025-2034 |
| Start Value | $1.1 Billion |
| Forecast Value | $1.96 Billion |
| CAGR | 6.1% |
In 2024, the hardware segment held 63% share and is forecasted to grow at a CAGR of 5% through 2034. This segment includes key components such as control units, sensors, data loggers, and communication modules that facilitate seamless data collection and system integration onboard. The rise in new vessel construction and retrofitting activities is boosting demand for hardware installations, especially as compliance with emission regulations and predictive maintenance capabilities becomes more critical. Leading OEMs like Siemens, ABB, and Wartsila are embedding advanced sensor technologies directly into propulsion and auxiliary systems to enable comprehensive performance monitoring.
The 5,000-10,000 HP power range segment held 37% share in 2024 and is projected to grow at a CAGR of 6% through 2034. Vessels within this range-typically medium-sized tankers, offshore support ships, and cargo carriers-require robust monitoring due to extended operational hours and strict regulatory requirements. Monitoring systems for this power range offer detailed analytics, predictive insights, and AI-enabled diagnostics that support preventive maintenance, fleet optimization, and compliance with evolving environmental standards. OEMs targeting this range are increasingly integrating predictive tools into their service offerings.
United States Marine Engine Monitoring System Market held 83% share and earned USD 345.5 million in 2024. The country's leadership position is supported by a sizable fleet of commercial and defense vessels, regulatory pressure on emissions, and widespread use of digital maritime technologies. Investments in edge computing, AI-based engine diagnostics, and connected systems are helping both public and private marine operators streamline performance. Access to government contracts and strong tech infrastructure allows US-based OEMs and integrators to meet domestic demand with high-end, smart systems. Technologies like MEMS and on-site monitoring via biofuel cells are finding broader applications thanks to the advanced engineering capabilities of the region.
Key players actively shaping the Global Marine Engine Monitoring System Market include Caterpillar, Wartsila, Cummins, Siemens, ABB, Kongsberg Maritime, and MAN Energy Solutions. Companies competing in the marine engine monitoring system market are focused on expanding digital capabilities, developing smart components, and enhancing global service reach. Many are integrating AI, IoT, and cloud connectivity into engine monitoring solutions to offer advanced diagnostics, automated reporting, and real-time insights. Partnerships with shipping operators allow these firms to co-develop customized solutions that improve operational efficiency. Some companies are also focusing on hybrid propulsion systems, leveraging monitoring tools to optimize fuel consumption and emissions. Investments in training platforms and aftersales service ecosystems help ensure customer retention.
Table of Contents
Chapter 1 Methodology
- 1.1 Market scope and definition
- 1.2 Research design
- 1.2.1 Research approach
- 1.2.2 Data collection methods
- 1.3 Data mining sources
- 1.3.1 Global
- 1.3.2 Regional/Country
- 1.4 Base estimates and calculations
- 1.4.1 Base year calculation
- 1.4.2 Key trends for market estimation
- 1.5 Primary research and validation
- 1.5.1 Primary sources
- 1.6 Forecast model
- 1.7 Research assumptions and limitations
Chapter 2 Executive Summary
- 2.1 Industry 360° synopsis, 2021 - 2034
- 2.2 Key market trends
- 2.2.1 Regional
- 2.2.2 Component
- 2.2.3 Power
- 2.2.4 Deployment mode
- 2.2.5 Propulsion
- 2.2.6 Application
- 2.2.7 End Use
- 2.3 TAM Analysis, 2025-2034
- 2.4 CXO perspectives: Strategic imperatives
- 2.4.1 Executive decision points
- 2.4.2 Critical success factors
- 2.5 Future outlook and strategic recommendations
Chapter 3 Industry Insights
- 3.1 Industry ecosystem analysis
- 3.1.1 Supplier landscape
- 3.1.2 Profit margin analysis
- 3.1.3 Cost structure
- 3.1.4 Value addition at each stage
- 3.1.5 Factor affecting the value chain
- 3.1.6 Disruptions
- 3.2 Industry impact forces
- 3.2.1 Growth drivers
- 3.2.1.1 Increase in demand for fuel-efficient vessel operations
- 3.2.1.2 Surge in compliance needs due to IMO regulations
- 3.2.1.3 Rise in deployment of remote diagnostics and IoT-based solutions
- 3.2.1.4 Rising maritime trade & vessel fleet expansion
- 3.2.2 Industry pitfalls and challenges
- 3.2.2.1 High initial investment cost for MEMS systems
- 3.2.2.2 Shortage of skilled maritime technicians for system deployment
- 3.2.3 Market opportunities
- 3.2.3.1 Expansion of MEMS in hybrid and electric propulsion systems
- 3.2.3.2 Surge in autonomous and remotely operated vessel projects
- 3.2.3.3 Rising investments in smart ports and connected shipping lanes
- 3.2.3.4 Adoption of digital twin technologies in shipyards
- 3.2.1 Growth drivers
- 3.3 Growth potential analysis
- 3.4 Regulatory landscape
- 3.4.1 North America
- 3.4.2 Europe
- 3.4.3 Asia Pacific
- 3.4.4 Latin America
- 3.4.5 Middle East & Africa
- 3.5 Porter's analysis
- 3.6 PESTEL analysis
- 3.7 Technology and Innovation landscape
- 3.7.1 Current technological trends
- 3.7.2 Emerging technologies
- 3.8 Price trends
- 3.8.1 By region
- 3.8.2 By product
- 3.9 Cost breakdown analysis
- 3.10 Patent analysis
- 3.11 Sustainability and environmental aspects
- 3.11.1 Sustainable practices
- 3.11.2 Waste reduction strategies
- 3.11.3 Energy efficiency in production
- 3.11.4 Eco-friendly Initiatives
- 3.12 Carbon footprint considerations
Chapter 4 Competitive Landscape, 2024
- 4.1 Introduction
- 4.2 Company market share analysis
- 4.2.1 North America
- 4.2.2 Europe
- 4.2.3 Asia Pacific
- 4.2.4 LATAM
- 4.2.5 MEA
- 4.3 Competitive analysis of major market players
- 4.4 Competitive positioning matrix
- 4.5 Strategic outlook matrix
- 4.6 Key developments
- 4.6.1 Mergers & acquisitions
- 4.6.2 Partnerships & collaborations
- 4.6.3 New Product Launches
- 4.6.4 Expansion Plans and funding
Chapter 5 Market Estimates & Forecast, By Component, 2021 - 2034 ($Bn, Units)
- 5.1 Key trends
- 5.2 Hardware
- 5.2.1 Sensors
- 5.2.2 Control units
- 5.2.3 Display
- 5.2.4 Controllers
- 5.2.5 Others
- 5.3 Software
- 5.3.1 Data analytics software
- 5.3.2 Predictive maintenance software
- 5.3.3 Others
- 5.4 Services
Chapter 6 Market Estimates & Forecast, By Power, 2021 - 2034 ($Bn, Units)
- 6.1 Key trends
- 6.2 1,000 HP
- 6.3 1,000-5,000 HP
- 6.4 5,001-10,000 HP
- 6.5 10,000 HP and above
Chapter 7 Market Estimates & Forecast, By Deployment Mode, 2021 - 2034 ($Bn)
- 7.1 Key trends
- 7.2 On-site monitoring
- 7.3 Remote monitoring
Chapter 8 Market Estimates & Forecast, By Propulsion, 2021 - 2034 ($Bn, Units)
- 8.1 Key trends
- 8.2 Diesel
- 8.3 Gas turbines
- 8.4 Others
Chapter 9 Market Estimates & Forecast, By Application, 2021 - 2034 ($Bn)
- 9.1 Key trends
- 9.2 Performance monitoring
- 9.3 Fuel efficiency optimization
- 9.4 Maintenance diagnosis
- 9.5 Safety and regulatory compliance
Chapter 10 Market Estimates & Forecast, By End Use, 2021 - 2034 ($Bn, Units)
- 10.1 Commercial vessels
- 10.1.1 Cargo ships
- 10.1.2 Tankers
- 10.1.3 Container ships
- 10.2 Naval vessels
- 10.3 Passenger vessels
- 10.3.1 Cruise ships
- 10.3.2 Ferries
- 10.4 Others
Chapter 11 Market Estimates & Forecast, By Region, 2021 - 2034 ($Bn, units)
- 11.1 Key trends
- 11.2 North America
- 11.2.1 U.S.
- 11.2.2 Canada
- 11.3 Europe
- 11.3.1 UK
- 11.3.2 France
- 11.3.3 Italy
- 11.3.4 Spain
- 11.3.5 Russia
- 11.3.6 Nordics
- 11.4 Asia Pacific
- 11.4.1 China
- 11.4.2 India
- 11.4.3 Japan
- 11.4.4 Australia
- 11.4.5 South Korea
- 11.4.6 Philippines
- 11.4.7 Vietnam
- 11.4.8 Indonesia
- 11.5 Latin America
- 11.5.1 Brazil
- 11.5.2 Mexico
- 11.5.3 Argentina
- 11.6 MEA
- 11.6.1 South Africa
- 11.6.2 Saudi Arabia
- 11.6.3 UAE
- 11.6.4 Egypt
Chapter 12 Company Profiles
- 12.1 ABB
- 12.2 AST
- 12.3 Caterpillar
- 12.4 CMR
- 12.5 Cummins
- 12.6 Emerson Electric
- 12.7 General Electric
- 12.8 Hyundai Heavy Industries
- 12.9 Jason Marine
- 12.10 Kongsberg Maritime
- 12.11 MAN Energy Solutions
- 12.12 Mitsubishi Heavy Industries
- 12.13 MTU Friedrichshafen
- 12.14 NORIS
- 12.15 Rolls-Royce
- 12.16 Scania
- 12.17 Siemens
- 12.18 Volvo Penta
- 12.19 Wartsila
- 12.20 Yanmar


