


 |
市场调查报告书
商品编码
1801883
海水水产养殖市场机会、成长动力、产业趋势分析及 2025 - 2034 年预测Saltwater Aquaculture Market Opportunity, Growth Drivers, Industry Trend Analysis, and Forecast 2025 - 2034 |
||||||
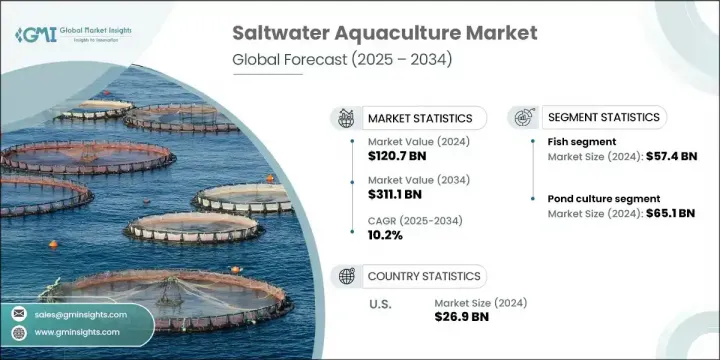
2024年,全球海水水产养殖市场规模达1,207亿美元,预计到2034年将以10.2%的复合年增长率成长,达到3,111亿美元。这一增长得益于政府的大力支持和旨在促进可持续海洋食品体系发展的渐进式政策调整。各国正将海水水产养殖列为更广泛的粮食安全和气候调适战略的优先事项,力求将其打造为面向未来粮食生产的关键支柱。离岸箱网养殖、循环水养殖系统(RAS)和综合多营养级水产养殖(IMTA)等技术的持续创新,拓展了市场的能力。这些系统正在提高产量,最大限度地减少环境足迹,并开闢出通往曾经被认为不适合海水养殖的海域的途径。
在联邦机构的支持下,生产者如今受益于专注于饲料替代品、孵化场开发和区域规划改进的研究。这些进步正在将传统营运模式转变为精准水产养殖模式,从而实现可扩展且可持续的生产。然而,儘管取得了进展,水产养殖业者仍然面临与环境保护和分区规划相关的复杂监管挑战。这些联邦、州和地方的层层监管虽然对保护生态系统至关重要,但往往会延长许可审批时间并增加营运成本,尤其对于新进业者而言。
| 市场范围 | |
|---|---|
| 起始年份 | 2024 |
| 预测年份 | 2025-2034 |
| 起始值 | 1207亿美元 |
| 预测值 | 3111亿美元 |
| 复合年增长率 | 10.2% |
2024年,鱼类市场产值达574亿美元,预计到2034年将以9.7%的复合年增长率成长。鲈鱼、鲔鱼和鲑鱼等鱼类凭藉其营养价值、烹饪适应性和广泛供应,继续主导消费市场。与软体动物和甲壳类动物相比,许多鱼类拥有更高的饲料转换率,从而降低了生产成本,并最大限度地提高了养殖户的收益。业内专家将鱼类养殖的主导地位归因于疾病控制、孵化场效率和离岸网箱系统等技术进步的坚实基础。鱼类产品,尤其是罗非鱼和鲑鱼,也因高效的冷链和广泛接受的认证协议而获得了全球关注,使其成为全球交易量最大的水产养殖产品之一。
2024年,池塘养殖领域产值达651亿美元,占54%,成为海水水产养殖的主要方式。与离岸网箱或循环水系统(RAS)等高科技系统相比,池塘养殖的资本投入较低,使其成为新兴经济体和中小型养殖户的首选。池塘养殖方式更容易水质控制和投餵安排,在缺乏先进水产养殖技术的地区更为实用。政府支持的水产养殖计画通常青睐池塘系统,因为其可扩展性、成本效益高,并且能够支持包括鱼类、软体动物和甲壳类动物在内的多种物种。这种适应性使生产者能够应对环境变化和不断变化的市场需求。
2024年,美国海水水产养殖市场规模达2,69亿美元,预计到2034年将以9.2%的复合年增长率成长。美国市场的成长动力源自于政府资助的研究、消费者对永续养殖海鲜日益增长的需求,以及水产养殖技术的稳定创新。在更有效率的饲料系统和疾病管理工具的支持下,海藻、贝类和鲈鱼等品种的养殖也正在蓬勃发展,市场也因此受益。展望未来,美国预计将进一步倾向离岸养殖、陆基循环系统以及高端增值海鲜的开发。
全球海水水产养殖市场的领先公司包括 Marine Harvest ASA (Mowi)、Yalelo Zambia、Cooke Aquaculture Inc.、Nippon Suisan Kaisha, Ltd.、Cermaq Group AS、Grieg Seafood ASA、P/F Bakkafrost、PHARMAQ (Zoetis)、Grieg Seafood ASA、P/F Bakkafrost、PHARMAQ (Zoetis)、LeIm. Ltda.、Innovasea、Nueva Pescanova 和 Aller Aqua。海水水产养殖市场的产业领导者正在采取多管齐下的策略来巩固其全球影响力。公司优先投资下一代水产养殖技术,如人工智慧监控、RAS 和离岸养殖,以提高产量并减少生态影响。策略性收购和区域扩张也在进行中,以挖掘新的消费者群体并加强供应链控制。公司正在透过从孵化场到收穫再到零售的垂直整合营运来增强价值主张,从而可以改善品质保证和成本管理。
目录
第一章:方法论与范围
第二章:执行摘要
第三章:行业洞察
- 产业生态系统分析
- 供应商格局
- 利润率
- 每个阶段的增值
- 影响价值链的因素
- 中断
- 产业影响力量
- 成长动力
- 产业陷阱与挑战
- 机会
- 成长潜力分析
- 未来市场趋势
- 技术和创新格局
- 当前的技术趋势
- 新兴技术
- 价格趋势
- 按地区和产品类型
- 监理框架
- 标准和认证
- 环境法规
- 进出口法规
- 波特的分析
- PESTEL分析
- 消费者行为分析
- 购买模式
- 偏好分析
- 消费者行为的区域差异
- 电子商务对购买决策的影响
第四章:竞争格局
- 介绍
- 公司市占率分析
- 按地区
- 公司矩阵分析
- 主要市场参与者的竞争分析
- 竞争定位矩阵
- 关键进展
- 併购
- 伙伴关係与合作
- 新产品发布
- 扩张计划
第五章:市场估计与预测:依养殖种类,2021 - 2034 年
- 主要趋势
- 鱼
- 甲壳类动物
- 软体动物
- 海藻
- 水生植物
- 其他(青蛙、鳗鱼等)
第六章:市场估计与预测:按文化系统,2021 - 2034 年
- 主要趋势
- 网栏养殖
- 池塘养殖
- 浮式网箱养殖
- 循环水养殖系统(RAS)
- 综合多营养水产养殖(IMTA)
- 其他的
第七章:市场估计与预测:依环境,2021 - 2034 年
- 主要趋势
- 海水
- 咸水
- 混合水系统
第八章:市场估计与预测:依最终用途,2021 - 2034 年
- 主要趋势
- 食品服务
- 零售
- 药品和营养保健品
- 化妆品和个人护理
- 其他的
第九章:市场估计与预测:按配销通路,2021 - 2034 年
- 主要趋势
- 直销
- 间接销售
第十章:市场估计与预测:按地区,2021 - 2034 年
- 主要趋势
- 北美洲
- 我们
- 加拿大
- 欧洲
- 德国
- 英国
- 法国
- 义大利
- 西班牙
- 荷兰
- 亚太地区
- 中国
- 印度
- 日本
- 韩国
- 澳洲
- 拉丁美洲
- 巴西
- 墨西哥
- 阿根廷
- MEA
- 阿联酋
- 沙乌地阿拉伯
- 南非
第 11 章:公司简介
- Aller Aqua
- Cermaq Group AS
- Cooke Aquaculture Inc.
- GeneSeas Aquacultura Ltda.
- Grieg Seafood ASA
- Huon Aquaculture Group Ltd.
- Innovasea
- Leroy Seafood Group ASA
- Marine Harvest ASA (Mowi)
- Nippon Suisan Kaisha, Ltd.
- Nueva Pescanova
- P/F Bakkafrost
- PHARMAQ (Zoetis)
- SalMar ASA
- Yalelo Zambia
The Global Saltwater Aquaculture Market was valued at USD 120.7 billion in 2024 and is estimated to grow at a CAGR of 10.2% to reach USD 311.1 billion by 2034. This growth is being fueled by strong government support and progressive policy alignment aimed at boosting sustainable marine food systems. Countries are prioritizing marine aquaculture as part of broader food security and climate adaptation strategies, helping to establish it as a critical pillar in future-ready food production. Continued innovation across technologies such as offshore cage farming, recirculating aquaculture systems (RAS), and integrated multi-trophic aquaculture (IMTA) has expanded the market's capabilities. These systems are increasing yields, minimizing environmental footprint, and unlocking access to areas once deemed unsuitable for marine farming.
With the support of federal agencies, producers now benefit from research focused on feed alternatives, hatchery development, and improved zone planning. These advances are transforming traditional operations into precision aquaculture models, allowing for scalable yet sustainable production. However, despite the progress, aquaculture operators still contend with complex regulatory challenges tied to environmental protection and zoning. These layers of federal, state, and local regulation-while critical to preserving ecosystems-often extend permitting timelines and raise operational costs, especially for new entrants.
| Market Scope | |
|---|---|
| Start Year | 2024 |
| Forecast Year | 2025-2034 |
| Start Value | $120.7 Billion |
| Forecast Value | $311.1 Billion |
| CAGR | 10.2% |
In 2024, the fish segment generated USD 57.4 billion and is forecasted to grow at a CAGR of 9.7% through 2034. Species such as sea bass, tuna, and salmon continue to dominate consumer markets thanks to their nutritional value, culinary adaptability, and widespread availability. Compared to mollusks and crustaceans, many fish species offer better feed conversion ratios, reducing production costs and maximizing returns for farmers. Industry experts have attributed fish farming's dominance to a strong foundation of technological improvements in disease control, hatchery efficiency, and offshore cage systems. Fish products, particularly tilapia and salmon, have also gained global traction due to efficient cold chains and widely accepted certification protocols, making them among the top-traded aquaculture goods worldwide.
The pond culture segment generated USD 65.1 billion and a 54% share in 2024, emerged as the top method for saltwater aquaculture production. The lower capital investment compared to high-tech systems such as offshore cages or RAS makes it a preferred approach in emerging economies and among small-to-medium-scale producers. Pond setups allow for simpler water quality control and feeding schedules, making them more practical in areas lacking access to advanced aquaculture technologies. Government-supported aquaculture initiatives often favor pond systems for their scalability, cost-effectiveness, and ability to support diverse species including finfish, mollusks, and crustaceans. This adaptability allows producers to react to both environmental changes and shifting market demands.
United States Saltwater Aquaculture Market was valued at USD 26.9 billion in 2024 and is anticipated to grow at a CAGR of 9.2% through 2034. Growth in the US market is being driven by a combination of government-funded research, increasing consumer demand for sustainably farmed seafood, and steady innovation in aquaculture technologies. The market is also benefiting from expansion into species like seaweed, shellfish, and sea bass, supported by more efficient feed systems and disease management tools. Looking ahead, the US is expected to lean further into offshore production, land-based recirculating systems, and development of premium value-added seafood products.
Leading companies in the Global Saltwater Aquaculture Market include Marine Harvest ASA (Mowi), Yalelo Zambia, Cooke Aquaculture Inc., Nippon Suisan Kaisha, Ltd., Cermaq Group AS, Grieg Seafood ASA, P/F Bakkafrost, PHARMAQ (Zoetis), Leroy Seafood Group ASA, SalMar ASA, Huon Aquaculture Group Ltd., GeneSeas Aquacultura Ltda., Innovasea, Nueva Pescanova, and Aller Aqua. Industry leaders in the saltwater aquaculture market are adopting multi-pronged strategies to solidify their global footprint. Companies are prioritizing investment in next-generation aquaculture technologies like AI-powered monitoring, RAS, and offshore farming to boost yield and reduce ecological impact. Strategic acquisitions and regional expansions are also underway to tap into new consumer bases and strengthen supply chain control. Firms are enhancing value propositions through vertically integrated operations-from hatchery to harvest to retail-which allows for improved quality assurance and cost management.
Table of Contents
Chapter 1 Methodology & Scope
- 1.1 Market scope and definition
- 1.2 Research design
- 1.2.1 Research approach
- 1.2.2 Data collection methods
- 1.3 Data mining sources
- 1.3.1 Global
- 1.3.2 Regional/Country
- 1.4 Base estimates and calculations
- 1.4.1 Base year calculation
- 1.4.2 Key trends for market estimation
- 1.5 Primary research and validation
- 1.5.1 Primary sources
- 1.6 Forecast model
- 1.7 Research assumptions and limitations
Chapter 2 Executive Summary
- 2.1 Industry 3600 synopsis
- 2.2 Key market trends
- 2.2.1 Species cultured
- 2.2.2 Culture systems
- 2.2.3 Environment
- 2.2.4 End use
- 2.2.5 Distribution channel
- 2.2.6 Regional
- 2.3 CXO perspective: Strategic imperatives
- 2.3.1 Key decision points for industry executives
- 2.3.2 Critical success factors for market players
- 2.4 Future outlook and strategic recommendations
Chapter 3 Industry Insights
- 3.1 Industry ecosystem analysis
- 3.1.1 Supplier landscape
- 3.1.2 Profit margin
- 3.1.3 Value addition at each stage
- 3.1.4 Factor affecting the value chain
- 3.1.5 Disruptions
- 3.2 Industry Impact forces
- 3.2.1 Growth drivers
- 3.2.2 Industry pitfalls & challenges
- 3.2.3 Opportunities
- 3.3 Growth potential analysis
- 3.4 Future market trends
- 3.5 Technology and innovation landscape
- 3.5.1 Current technological trends
- 3.5.2 Emerging technologies
- 3.6 Price trends
- 3.6.1 By region and product type
- 3.7 Regulatory framework
- 3.7.1 Standards and certifications
- 3.7.2 Environmental regulations
- 3.7.3 Import export regulations
- 3.8 Porter’s analysis
- 3.9 PESTEL analysis
- 3.10 Consumer behavior analysis
- 3.10.1 Purchasing patterns
- 3.10.2 Preference analysis
- 3.10.3 Regional variations in consumer behavior
- 3.10.4 Impact of e-commerce on buying decisions
Chapter 4 Competitive Landscape, 2024
- 4.1 Introduction
- 4.2 Company market share analysis
- 4.2.1 By region
- 4.2.1.1 North America
- 4.2.1.2 Europe
- 4.2.1.3 Asia Pacific
- 4.2.1.4 Latin America
- 4.2.1.5 Middle East and Africa
- 4.2.1 By region
- 4.3 Company matrix analysis
- 4.4 Competitive analysis of major market players
- 4.5 Competitive positioning matrix
- 4.6 Key developments
- 4.6.1 Mergers & acquisitions
- 4.6.2 Partnerships & collaborations
- 4.6.3 New Product Launches
- 4.6.4 Expansion Plans
Chapter 5 Market Estimates & Forecast, By Species Cultured, 2021 - 2034 (USD Billion) (Million Tons)
- 5.1 Key trends
- 5.2 Fish
- 5.3 Crustaceans
- 5.4 Mollusks
- 5.5 Seaweed
- 5.6 Aquatic plants
- 5.7 Others (Frogs, Eels, etc.)
Chapter 6 Market Estimates & Forecast, By Culture Systems, 2021 - 2034 (USD Billion) (Million Tons)
- 6.1 Key trends
- 6.2 Pen culture
- 6.3 Pond culture
- 6.4 Floating cage culture
- 6.5 Recirculating aquaculture systems (RAS)
- 6.6 Integrated multi-trophic aquaculture (IMTA)
- 6.7 Others
Chapter 7 Market Estimates & Forecast, By Environment, 2021 - 2034 (USD Billion) (Million Tons)
- 7.1 Key trends
- 7.2 Marine water
- 7.3 Brackish water
- 7.4 Mixed water systems
Chapter 8 Market Estimates & Forecast, By End Use, 2021 - 2034, (USD Billion) (Million Tons)
- 8.1 Key trends
- 8.2 Food Services
- 8.3 Retail
- 8.4 Pharmaceutical and nutraceuticals
- 8.5 Cosmetics and personal care
- 8.6 Others
Chapter 9 Market Estimates & Forecast, By Distribution Channel, 2021 - 2034, (USD Billion) (Million Tons)
- 9.1 Key trends
- 9.2 Direct sales
- 9.3 Indirect sales
Chapter 10 Market Estimates & Forecast, By Region, 2021 - 2034, (USD Billion) (Million Tons)
- 10.1 Key trends
- 10.2 North America
- 10.2.1 U.S.
- 10.2.2 Canada
- 10.3 Europe
- 10.3.1 Germany
- 10.3.2 U.K.
- 10.3.3 France
- 10.3.4 Italy
- 10.3.5 Spain
- 10.3.6 Netherlands
- 10.4 Asia Pacific
- 10.4.1 China
- 10.4.2 India
- 10.4.3 Japan
- 10.4.4 South Korea
- 10.4.5 Australia
- 10.5 Latin America
- 10.5.1 Brazil
- 10.5.2 Mexico
- 10.5.3 Argentina
- 10.6 MEA
- 10.6.1 UAE
- 10.6.2 Saudi Arabia
- 10.6.3 South Africa
Chapter 11 Company Profiles (Business Overview, Financial Data, Product Landscape, Strategic Outlook, SWOT Analysis)
- 11.1 Aller Aqua
- 11.2 Cermaq Group AS
- 11.3 Cooke Aquaculture Inc.
- 11.4 GeneSeas Aquacultura Ltda.
- 11.5 Grieg Seafood ASA
- 11.6 Huon Aquaculture Group Ltd.
- 11.7 Innovasea
- 11.8 Leroy Seafood Group ASA
- 11.9 Marine Harvest ASA (Mowi)
- 11.10 Nippon Suisan Kaisha, Ltd.
- 11.11 Nueva Pescanova
- 11.12 P/F Bakkafrost
- 11.13 PHARMAQ (Zoetis)
- 11.14 SalMar ASA
- 11.15 Yalelo Zambia
 海藻包装市场-2026-2031年预测
 水产养殖肥料市场规模、份额和成长分析(按肥料类型、施用方法、水产养殖系统、营养成分、目标和地区划分)—2026-2033年产业预测
 鲑鱼饲料市场:按类型、成分类型、应用和地区划分
 水产养殖市场-全球产业规模、份额、趋势、机会及预测,依环境、鱼类种类、地区及竞争格局划分,2020-2030年预测石斑鱼市场:按类型、用途、捕捞方法和地区划分
 水产养殖:全球市场份额和排名、总收入和需求预测(2025-2031 年)
 鲑鱼饲料市场分析与预测(至2034年):类型、产品、技术、成分、应用、形式、材料类型、製程、最终用户、解决方案
 2032 年海藻包装市场预测:按来源、包装类型、应用、最终用户和地区分類的全球分析全球海藻食用包装市场:未来预测(至 2032 年)—按产地、包装类型、分销管道、应用和地区分析海洋养殖市场-全球产业规模、份额、趋势、机会及预测(按产品类型、养殖系统、地区和竞争情况划分,2020-2030 年预测)