


 |
市场调查报告书
商品编码
1801936
电脑视觉系统市场机会、成长动力、产业趋势分析及 2025 - 2034 年预测Computer Vision Systems Market Opportunity, Growth Drivers, Industry Trend Analysis, and Forecast 2025 - 2034 |
||||||
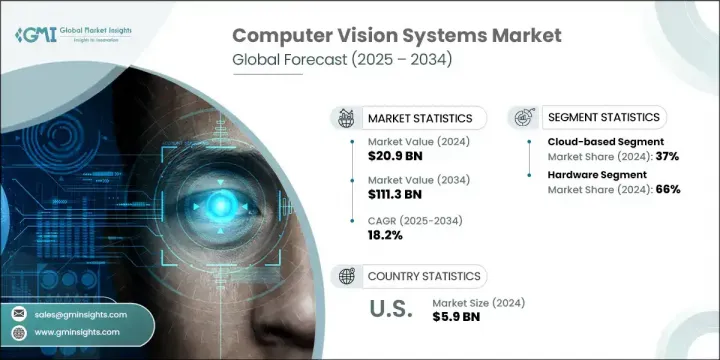
2024年,全球电脑视觉系统市场规模达209亿美元,预计到2034年将以18.2%的复合年增长率成长,达到1113亿美元。人工智慧、深度学习和感测器技术的快速发展,推动着电脑视觉应用在多个领域的扩展。製造业、汽车业和零售业等行业正大力采用视觉系统来提升自动化水平、加强品质控制并提升安全性。医疗保健产业正在利用这些技术进行诊断和病患监护,而安防产业则受益于即时威胁识别技术。
城市基础设施管理和精准农业也正在利用这些系统来简化营运。在能源和电子领域,电脑视觉有助于优化监控和设备互动。如今,先进的演算法能够提高影像清晰度,将低解析度资料转换为高解析度输出,这为自主导航和医疗诊断等高精度应用开闢了可能性。
| 市场范围 | |
|---|---|
| 起始年份 | 2024 |
| 预测年份 | 2025-2034 |
| 起始值 | 209亿美元 |
| 预测值 | 1113亿美元 |
| 复合年增长率 | 18.2% |
工业 4.0 和智慧环境的兴起持续加速了对智慧视觉系统的需求。随着云端运算、边缘处理和物联网技术的整合,企业能够实现即时资料分析和可扩展性。改进的机器学习模型也提升了这些系统的可靠性和性能。
基于云端的电脑视觉平台在2024年占据了37%的市场份额,预计在2025年至2034年期间的复合年增长率将达到19%。它们的受欢迎程度源于其可扩展性、成本效益以及无需繁重的本地基础设施即可部署复杂处理任务的能力。企业正在利用云端来大规模处理视觉资料,整合先进的学习模型,并以精简的方式在不同环境中部署视觉工具。
硬体领域占据了66%的市场份额,预计到2034年将以18%的复合年增长率成长。高性能摄影机、处理器、记忆体、储存和显示单元等硬体组件是视觉系统核心功能的关键,它们正在为工业製造、汽车技术和医疗诊断等各个领域进行客製化。人工智慧与专用硬体的结合正在推动脸部辨识、自动侦测和视觉追踪等任务的发展。
2024年,美国电脑视觉系统市场占90%的市场份额,贡献了59亿美元的市场规模。美国拥有强大的科技生态系统,并在多个高成长领域中率先采用。从自动驾驶出行、智慧生产线到医学影像和监控等应用的激增,刺激了市场需求。广泛的数位转型和先进的电信基础设施进一步支援了云端和边缘部署模式。此外,零售业正在利用视觉系统进行即时库存追踪和个人化用户互动,从而加强了各企业的自动化措施。
塑造全球电脑视觉系统市场的领导者包括Google、英特尔、Teledyne、NVIDIA、亚马逊网路服务、微软和IBM。电脑视觉系统市场的主要参与者专注于创新、生态系统合作和策略扩张,以获得竞争优势。各公司正将资金投入研发,以提升人工智慧驱动的视觉能力,尤其是在自主系统和即时分析领域。策略性收购正在进行,以增强特定领域的专业知识并加速产品开发。扩展云端基础设施和推出边缘相容的视觉平台,正在帮助参与者接触到具有不同可扩展性需求的客户。针对医疗保健、零售、汽车和製造等关键垂直行业客製化解决方案是另一个核心策略。
目录
第一章:方法论
- 市场范围和定义
- 研究设计
- 研究方法
- 资料收集方法
- 资料探勘来源
- 全球的
- 地区/国家
- 基础估算与计算
- 基准年计算
- 市场评估的主要趋势
- 初步研究和验证
- 主要来源
- 预测模型
- 研究假设和局限性
第二章:执行摘要
第三章:行业洞察
- 市场引进与发展
- 电脑视觉技术的历史发展
- 当前市场格局
- 未来展望与新兴趋势
- 供应商格局
- 原料和零件供应商
- 硬体製造商
- 软体开发者
- 系统整合商
- 最终用户
- 利润率分析
- 技术与创新格局
- 深度学习与神经网络
- 3D电脑视觉
- 用于电脑视觉的边缘人工智慧
- 扩增实境集成
- 显示技术中的电脑视觉
- 用于视觉应用的神经形态计算
- 量子计算对电脑视觉的影响
- 用于训练的合成资料生成
- 显示行业特定的电脑视觉应用
- 显示器自动光学检测 (AOI)
- 显示器製造上的缺陷检测
- 颜色校准和品质控制
- 智慧显示互动技术
- 用于微型 LED 和 OLED 製造的电脑视觉
- 显示器生产的线上製程监控
- 面板均匀性评估系统
- 柔性显示器的自动视觉检测
- 产业生态系统分析
- 供应商矩阵
- 配销通路分析
- 策略伙伴关係和合作
- 产业协会和联盟
- 研究和学术机构
- 专利分析
- 各地区专利申请及授权情况
- 显示相关电脑视觉领域的关键专利
- 专利趋势分析
- 专利诉讼情势
- 显示视觉系统的新兴专利领域
- 重要新闻和倡议
- 监管格局
- 资料保护法规
- 电脑视觉产业标准
- 区域监管机构
- 不同垂直行业的合规要求
- 未来监管发展
- 案例研究
- 显示器製造中的电脑视觉
- 电子产业品质控制应用
- 智慧零售实施成功案例
- 电脑视觉的医疗保健应用
- 车载显示整合案例
- 投资和融资格局
- 创投
- 私募股权融资
- 企业投资与併购活动
- 政府和公共资金
- 各地区投资趋势
- 成本结构分析
- 硬体组件成本
- 软体开发和授权成本
- 实施和整合成本
- 维护和支援成本
- 总拥有成本分析
- 未来技术路线图
- 短期发展(1-2年)
- 中期发展(3-5年)
- 长期发展(5年以上)
- 科技融合机会
- 业界最佳实践
- 开发和实施方法
- 品质保证和测试框架
- 资料管理和隐私实践
- ROI 优化策略
- 市场进入策略
- 新产品开发
- 策略伙伴关係和联盟
- 併购
- 区域扩张策略
- 永续性和 ESG 分析
- 电脑视觉科技对环境的影响
- 社会影响和伦理考虑
- 治理与合规框架
- 永续发展目标协调
- 衝击力
- 成长动力
- 品质检验和自动化需求不断成长
- 人工智慧和机器学习技术的日益融合
- 智慧製造应用日益增多
- 深度学习演算法的进步
- 边缘运算设备的激增
- 非接触式解决方案的需求不断增长
- 产业陷阱与挑战
- 实施成本高
- 技术复杂性与整合挑战
- 资料隐私和安全问题
- 各行业标准化程度有限
- 运算资源需求
- 市场机会
- 与边缘运算和物联网的集成
- 显示器製造的新兴应用
- 零售和医疗保健行业的成长
- 亚太地区扩张
- 感测器技术的进步
- 跨行业应用和解决方案
- 市场挑战
- 准确性和可靠性问题
- 熟练劳动力短缺
- 监理和合规挑战
- 影响绩效的环境因素
- 可扩展性和部署挑战
- 成长动力
- 成长潜力分析
- 波特的分析
- PESTEL分析
第四章:竞争格局
- 市占率分析
- 主要参与者的全球市场份额
- 区域市占率分布
- 市场参与者层级分析
- 竞争基准测试
- 产品组合分析
- 商业策略分析
- 研发投入对比
- 技术能力评估
- 策略倡议
- 新产品发布和创新
- 併购
- 伙伴关係和合作
- 扩张策略
- 竞争仪錶板
- 市场定位矩阵
- 效能比较矩阵
- 战略发展热图
- 关键参与者的 SWOT 分析
- 优点和缺点分析
- 机会与威胁分析
- 竞争定位矩阵
- 领导者
- 挑战者
- 创新者
- 新兴企业
- 供应商格局
- 分销商和通路合作伙伴名单
- 关键购买标准
- 定价模型和策略
- 显示产业特定的竞争分析
- 显示器製造的电脑视觉解决方案
- 品质控制系统供应商
- 智慧显示技术竞争对手
第五章:市场估计与预测:依部署模式,2021-2034 年
- 主要趋势
- 基于云端
- 公共云端
- 私有云端
- 混合云端
- 本地
- 企业部署
- 产业部署
- 基于边缘
- 边缘运算设备
- 物联网整合系统
- 智慧相机和感光元件
第六章:市场估计与预测:依组件,2021-2034
- 主要趋势
- 硬体
- 相机和影像感测器
- 工业相机
- 智慧型相机
- 3D相机
- 红外线摄影机
- 处理器和计算单元
- CPU
- GPU
- FPGA
- ASIC
- 边缘AI处理器
- 记忆体和储存
- 显示单位
- 其他的
- 相机和影像感测器
- 软体
- 电脑视觉平台
- 深度学习框架
- 影像处理软体
- 分析软体
- 客製化应用程式
- 服务
- 专业服务
- 咨询服务
- 整合与实施
- 培训与支援
- 託管服务
- 基于云端的服务
- 本地服务
- 专业服务
第七章:市场估计与预测:按应用,2021-2034
- 主要趋势
- 脸部辨识
- 安全和监控
- 存取控制
- 情绪识别
- 行销和客户分析
- 影像分类
- 产品分类
- 内容审核
- 医学影像分析
- 行业分类
- 物体侦测
- 零售库存管理
- 製造缺陷检测
- 安全应用程式
- 自主系统
- 对象追踪
- 监控和安全
- 体育分析
- 零售客户追踪
- 生产过程监控
- 光学字元辨识 (OCR)
- 文件数位化
- 车牌识别
- 製造业中的文本识别
- 零售应用
- 影像分割
- 医学影像分割
- 工业应用
- 零售应用
- 自动驾驶汽车
- 自动光学检测
- 显示面板侦测
- PCB侦测
- 半导体检测
- 消费性电子产品品质控制
- 3D视觉与深度感知
- 扩增实境应用
- 机器人和自动化
- 智慧製造
- 汽车应用
- 手势识别
- 消费性电子产品
- 汽车人机介面
- 医疗保健应用
- 智慧家庭控制
- 其他的
第八章:市场估计与预测:依产业垂直,2021-2034
- 主要趋势
- 製造业
- 电子和半导体
- 显示器製造
- PCB组装
- 半导体生产
- 消费性电子产品
- 汽车
- 航太和国防
- 製药
- 食品和饮料
- 其他的
- 电子和半导体
- 卫生保健
- 医学影像和诊断
- 病人监护
- 手术援助
- 医疗保健管理
- 其他的
- 零售
- 库存管理
- 客户分析
- 自助结帐系统
- 数位看板和智慧显示器
- 其他的
- 汽车
- 高级驾驶辅助系统 (ADAS)
- 自动驾驶汽车
- 车内监控
- 智慧驾驶舱显示器
- 其他的
- 安全和监控
- 公安
- 零售安全
- 工业安全
- 住宅安全
- 其他的
- 农业
- 作物监测
- 牲畜管理
- 精准农业
- 其他的
- 智慧城市
- 交通管理
- 公安
- 基础设施监控
- 能源管理
- 其他的
- 消费性电子产品
- 智慧型手机和平板电脑
- 智慧电视和显示器
- AR/VR设备
- 智慧家庭设备
- 其他的
- 能源和公用事业
- 电网监控
- 再生能源系统
- 基础设施检查
- 其他的
- 其他的
第九章:市场估计与预测:按地区,2021-2034
- 主要趋势
- 北美洲
- 我们
- 加拿大
- 欧洲
- 英国
- 德国
- 法国
- 义大利
- 西班牙
- 俄罗斯
- 北欧人
- 亚太地区
- 中国
- 印度
- 日本
- 韩国
- 澳新银行
- 东南亚
- 拉丁美洲
- 巴西
- 墨西哥
- 阿根廷
- MEA
- 南非
- 沙乌地阿拉伯
- 阿联酋
第十章:公司简介
- Global Technology Leaders
- NVIDIA
- Intel
- Microsoft
- IBM
- Qualcomm
- Sony
- Industrial Vision and Automation Specialists
- Cognex
- Keyence
- Basler
- Omron
- Teledyne
- AI and Vision Software Innovators
- Clarifai
- Matterport
- Visionatics
- SmartCow
- ZH-AOI
- Semiconductor and Component Suppliers
- MediaTek
- Himax
- Renesas Electronics
- AUO Display Plus (ADP)
- Edge Computing and Embedded Vision Companies
- Aetina
- Advantech
- AAEON
- Neousys
The Global Computer Vision Systems Market was valued at USD 20.9 billion in 2024 and is estimated to grow at a CAGR of 18.2% to reach USD 111.3 billion by 2034. Rapid advances in artificial intelligence, deep learning, and sensor technologies are fueling the expansion of computer vision applications across multiple sectors. Industries such as manufacturing, automotive, and retail are seeing strong adoption of vision systems to improve automation, enhance quality control, and boost safety. Healthcare is utilizing these technologies for diagnostics and patient monitoring, while security is benefiting from real-time threat recognition.
Urban infrastructure management and precision agriculture are also tapping into these systems to streamline operations. In energy and electronics, computer vision helps optimize monitoring and device interactivity. Advanced algorithms now enhance image clarity, transforming low-resolution data into high-resolution outputs, which opens up possibilities for applications that demand high precision, including autonomous navigation and medical diagnostics.
| Market Scope | |
|---|---|
| Start Year | 2024 |
| Forecast Year | 2025-2034 |
| Start Value | $20.9 Billion |
| Forecast Value | $111.3 Billion |
| CAGR | 18.2% |
The rise of Industry 4.0 and smart environments continues to accelerate demand for intelligent visual systems. With the integration of cloud computing, edge processing, and IoT technologies, real-time data analysis and scalability have become accessible to enterprises. Improved machine learning models are also increasing the reliability and performance of these systems.
The cloud-based computer vision platforms held 37% share in 2024 and is anticipated to grow at a CAGR of 19% between 2025 and 2034. Their popularity stems from scalability, cost efficiency, and the ability to deploy complex processing tasks without heavy local infrastructure. Businesses are leveraging the cloud to process visual data at scale, incorporate advanced learning models, and deploy vision tools across diverse environments in a streamlined way.
The hardware segment held 66% share and is expected to grow at a CAGR of 18% through 2034. Essential to the core function of vision systems, hardware components like high-performance cameras, processors, memory, storage, and display units are being customized for various sectors including industrial manufacturing, automotive technologies, and healthcare diagnostics. The combination of artificial intelligence with dedicated hardware is advancing tasks such as facial recognition, automated inspection, and visual tracking.
US Computer Vision Systems Market held 90% share in 2024, contributing USD 5.9 billion. The country benefits from a robust tech ecosystem and early adoption across several high-growth sectors. A surge in applications ranging from autonomous mobility and smart production lines to medical imaging and surveillance has boosted demand. Widespread digital transformation and sophisticated telecom infrastructure further support cloud and edge deployment models. Additionally, the retail space is leveraging vision systems for real-time inventory tracking and personalized user interactions, intensifying automation initiatives across businesses.
The leading players shaping the Global Computer Vision Systems Market include Google, Intel, Teledyne, NVIDIA, Amazon Web Services, Microsoft, and IBM. Major players in the computer vision systems market are focusing on innovation, ecosystem partnerships, and strategic expansion to gain a competitive edge. Companies are channeling investment into research and development to advance AI-driven vision capabilities, particularly for autonomous systems and real-time analytics. Strategic acquisitions are being made to strengthen domain-specific expertise and accelerate product development. Expanding cloud infrastructure and launching edge-compatible vision platforms are helping players reach clients with varying scalability needs. Customization of solutions for key verticals like healthcare, retail, automotive, and manufacturing is another core tactic.
Table of Contents
Chapter 1 Methodology
- 1.1 Market scope and definition
- 1.2 Research design
- 1.2.1 Research approach
- 1.2.2 Data collection methods
- 1.3 Data mining sources
- 1.3.1 Global
- 1.3.2 Regional/Country
- 1.4 Base estimates and calculations
- 1.4.1 Base year calculation
- 1.4.2 Key trends for market estimation
- 1.5 Primary research and validation
- 1.5.1 Primary sources
- 1.6 Forecast model
- 1.7 Research assumptions and limitations
Chapter 2 Executive Summary
- 2.1 Industry 360° synopsis, 2021 - 2034
- 2.2 Key market trends
- 2.2.1 Regional
- 2.2.2 Deployment Mode
- 2.2.3 Component
- 2.2.4 Application
- 2.2.5 Industry vertical
- 2.3 TAM Analysis, 2025-2034
- 2.4 CXO perspectives: Strategic imperatives
- 2.4.1 Executive decision points
- 2.4.2 Critical success factors
- 2.5 Future outlook and strategic recommendations
Chapter 3 Industry Insights
- 3.1 Market introduction and evolution
- 3.1.1 Historical development of computer vision technology
- 3.1.2 Current market landscape
- 3.1.3 Future outlook and emerging trends
- 3.2 Supplier landscape
- 3.2.1 Raw material and component suppliers
- 3.2.2 Hardware manufacturers
- 3.2.3 Software developers
- 3.2.4 System integrators
- 3.2.5 End users
- 3.3 Profit margin analysis
- 3.4 Technology & innovation landscape
- 3.4.1 Deep learning and neural networks
- 3.4.2 3D computer vision
- 3.4.3 Edge AI for computer vision
- 3.4.4 Augmented reality integration
- 3.4.5 Computer vision in display technology
- 3.4.6 Neuromorphic computing for vision applications
- 3.4.7 Quantum computing implications for computer vision
- 3.4.8 Synthetic data generation for training
- 3.5 Display industry-specific computer vision applications
- 3.5.1 Automated optical inspection (AOI) for displays
- 3.5.2 Defect detection in display manufacturing
- 3.5.3 Color calibration and quality control
- 3.5.4 Smart display interaction technologies
- 3.5.5 Computer vision for micro LED and OLED manufacturing
- 3.5.6 In-line process monitoring for display production
- 3.5.7 Panel uniformity assessment systems
- 3.5.8 Automated visual inspection for flexible displays
- 3.6 Industry ecosystem analysis
- 3.6.1 Vendor matrix
- 3.6.2 Distribution channel analysis
- 3.6.3 Strategic partnerships and collaborations
- 3.6.4 Industry associations and consortiums
- 3.6.5 Research and academic institutions
- 3.7 Patent analysis
- 3.7.1 Patent applications and grants by region
- 3.7.2 Key patents in display-related computer vision
- 3.7.3 Patent trend analysis
- 3.7.4 Patent litigation landscape
- 3.7.5 Emerging patent areas in display vision systems
- 3.8 Key news & initiatives
- 3.9 Regulatory landscape
- 3.9.1 Data protection regulations
- 3.9.2 Industry standards for computer vision
- 3.9.3 Regional regulatory landscape
- 3.9.4 Compliance requirements for different verticals
- 3.9.5 Future regulatory developments
- 3.10 Case studies
- 3.10.1 Computer vision in display manufacturing
- 3.10.2 Quality control applications in electronics industry
- 3.10.3 Smart retail implementation success stories
- 3.10.4 Healthcare applications of computer vision
- 3.10.5 Automotive display integration cases
- 3.11 Investment and funding landscape
- 3.11.1 Venture capital investments
- 3.11.2 Private equity funding
- 3.11.3 Corporate investments and M&A activity
- 3.11.4 Government and public funding
- 3.11.5 Investment trends by region
- 3.12 Cost structure analysis
- 3.12.1 Hardware component costs
- 3.12.2 Software development and licensing costs
- 3.12.3 Implementation and integration costs
- 3.12.4 Maintenance and support costs
- 3.12.5 Total cost of ownership analysis
- 3.13 Future technology roadmap
- 3.13.1 Short-term developments (1-2 Years)
- 3.13.2 Medium-term developments (3-5 Years)
- 3.13.3 Long-term developments (5+ Years)
- 3.13.4 Technology convergence opportunities
- 3.14 Industry best practices
- 3.14.1 Development and implementation methodologies
- 3.14.2 Quality assurance and testing frameworks
- 3.14.3 Data management and privacy practices
- 3.14.4 ROI optimization strategies
- 3.15 Market entry strategies
- 3.15.1 New product development
- 3.15.2 Strategic partnerships and alliances
- 3.15.3 Mergers and acquisitions
- 3.15.4 Regional expansion strategies
- 3.16 Sustainability and ESG analysis
- 3.16.1 Environmental impact of computer vision technologies
- 3.16.2 Social implications and ethical considerations
- 3.16.3 Governance and compliance frameworks
- 3.16.4 Sustainable development goals alignment
- 3.17 Impact forces
- 3.17.1 Growth drivers
- 3.17.1.1 Rising demand for quality inspection and automation
- 3.17.1.2 Growing integration of AI and ML technologies
- 3.17.1.3 Increasing applications in smart manufacturing
- 3.17.1.4 Advancements in deep learning algorithms
- 3.17.1.5 Proliferation of edge computing devices
- 3.17.1.6 Growing demand for contactless solutions
- 3.17.2 Industry pitfalls & challenges
- 3.17.2.1 High implementation costs
- 3.17.2.2 Technical complexity and integration challenges
- 3.17.2.3 Data privacy and security concerns
- 3.17.2.4 Limited standardization across industries
- 3.17.2.5 Computational resource requirements
- 3.17.3 Market opportunities
- 3.17.3.1 Integration with edge computing and IoT
- 3.17.3.2 Emerging applications in display manufacturing
- 3.17.3.3 Growth in retail and healthcare sectors
- 3.17.3.4 Expansion in APAC region
- 3.17.3.5 Advancements in sensor technologies
- 3.17.3.6 Cross-industry applications and solutions
- 3.17.4 Market Challenges
- 3.17.4.1 Accuracy and reliability issues
- 3.17.4.2 Skilled workforce shortage
- 3.17.4.3 Regulatory and compliance challenges
- 3.17.4.4 Environmental factors affecting performance
- 3.17.4.5 Scalability and deployment challenges
- 3.17.1 Growth drivers
- 3.18 Growth potential analysis
- 3.19 Porter’s analysis
- 3.20 PESTEL analysis
Chapter 4 Competitive Landscape, 2024
- 4.1 Market share analysis
- 4.1.1 Global market share by key players
- 4.1.2 Regional market share distribution
- 4.1.3 Tier analysis of market players
- 4.2 Competitive benchmarking
- 4.2.1 Product portfolio analysis
- 4.2.2 Business strategy analysis
- 4.2.3 R&D investment comparison
- 4.2.4 Technological capabilities assessment
- 4.3 Strategic initiatives
- 4.3.1 New product launches and innovations
- 4.3.2 Mergers and acquisitions
- 4.3.3 Partnerships and collaborations
- 4.3.4 Expansion strategies
- 4.4 Competitive dashboard
- 4.4.1 Market positioning matrix
- 4.4.2 Performance comparison matrix
- 4.4.3 Strategic developments heatmap
- 4.5 SWOT analysis of key players
- 4.5.1 Strengths and weaknesses analysis
- 4.5.2 Opportunities and threats analysis
- 4.6 Competitive positioning matrix
- 4.6.1 Leaders
- 4.6.2 Challengers
- 4.6.3 Innovators
- 4.6.4 Emerging players
- 4.7 Vendor landscape
- 4.7.1 List of distributors and channel partners
- 4.7.2 Key buying criteria
- 4.7.3 Pricing models and strategies
- 4.8 Display industry-specific competitive analysis
- 4.8.1 Computer vision solutions for display manufacturing
- 4.8.2 Quality control systems providers
- 4.8.3 Smart display technology competitors
Chapter 5 Market Estimates & Forecast, By Deployment Mode, 2021-2034 ($Bn)
- 5.1 Key trends
- 5.2 Cloud-based
- 5.2.1 Public cloud
- 5.2.2 Private cloud
- 5.2.3 Hybrid cloud
- 5.3 On-premises
- 5.3.1 Enterprise deployment
- 5.3.2 Industrial deployment
- 5.4 Edge-based
- 5.4.1 Edge computing devices
- 5.4.2 IoT-integrated systems
- 5.4.3 Smart cameras and sensors
Chapter 6 Market Estimates & Forecast, By Component, 2021-2034 ($Bn)
- 6.1 Key trends
- 6.2 Hardware
- 6.2.1 Cameras And Image Sensors
- 6.2.1.1 Industrial Cameras
- 6.2.1.2 Smart Cameras
- 6.2.1.3 3D Cameras
- 6.2.1.4 Infrared Cameras
- 6.2.2 Processors And Computing Units
- 6.2.2.1 CPUs
- 6.2.2.2 GPUs
- 6.2.2.3 FPGAs
- 6.2.2.4 ASICs
- 6.2.2.5 Edge AI Processors
- 6.2.3 Memory And Storage
- 6.2.4 Display Units
- 6.2.5 Others
- 6.2.1 Cameras And Image Sensors
- 6.3 Software
- 6.3.1 Computer Vision Platforms
- 6.3.2 Deep Learning Frameworks
- 6.3.3 Image Processing Software
- 6.3.4 Analytics Software
- 6.3.5 Custom Applications
- 6.4 Services
- 6.4.1 Professional Services
- 6.4.1.1 Consulting Services
- 6.4.1.2 Integration And Implementation
- 6.4.1.3 Training And Support
- 6.4.2 Managed services
- 6.4.2.1 Cloud-based services
- 6.4.2.2 On-premise services
- 6.4.1 Professional Services
Chapter 7 Market Estimates & Forecast, By Application, 2021-2034 ($Bn)
- 7.1 Key trends
- 7.2 Facial recognition
- 7.2.1 Security and surveillance
- 7.2.2 Access control
- 7.2.3 Emotion recognition
- 7.2.4 Marketing and customer analytics
- 7.3 Image classification
- 7.3.1 Product categorization
- 7.3.2 Content moderation
- 7.3.3 Medical image analysis
- 7.3.4 Industrial classification
- 7.4 Object detection
- 7.4.1 Retail Inventory management
- 7.4.2 Manufacturing defect detection
- 7.4.3 Security applications
- 7.4.4 Autonomous systems
- 7.5 Object tracking
- 7.5.1 Surveillance and security
- 7.5.2 Sports analytics
- 7.5.3 Retail customer tracking
- 7.5.4 Manufacturing process monitoring
- 7.6 Optical Character Recognition (OCR)
- 7.6.1 Document digitization
- 7.6.2 License plate recognition
- 7.6.3 Text recognition in manufacturing
- 7.6.4 Retail applications
- 7.7 Image Segmentation
- 7.7.1 Medical image segmentation
- 7.7.2 Industrial applications
- 7.7.3 Retail applications
- 7.7.4 Autonomous vehicles
- 7.8 Automated optical inspection
- 7.8.1 Display panel inspection
- 7.8.2 PCB inspection
- 7.8.3 Semiconductor inspection
- 7.8.4 Consumer electronics quality control
- 7.9 3D vision and depth sensing
- 7.9.1 Augmented reality applications
- 7.9.2 Robotics and automation
- 7.9.3 Smart manufacturing
- 7.9.4 Automotive applications
- 7.10 Gesture recognition
- 7.10.1 Consumer electronics
- 7.10.2 Automotive HMI
- 7.10.3 Healthcare applications
- 7.10.4 Smart home controls
- 7.11 Others
Chapter 8 Market Estimates & Forecast, By Industry Vertical, 2021-2034 ($Bn)
- 8.1 Key trends
- 8.2 Manufacturing
- 8.2.1 Electronics and semiconductor
- 8.2.1.1 Display manufacturing
- 8.2.1.2 PCB assembly
- 8.2.1.3 Semiconductor production
- 8.2.1.4 Consumer electronics
- 8.2.2 Automotive
- 8.2.3 Aerospace and defense
- 8.2.4 Pharmaceuticals
- 8.2.5 Food and beverage
- 8.2.6 Others
- 8.2.1 Electronics and semiconductor
- 8.3 Healthcare
- 8.3.1 Medical imaging and diagnostics
- 8.3.2 Patient monitoring
- 8.3.3 Surgical assistance
- 8.3.4 Healthcare administration
- 8.3.5 Others
- 8.4 Retail
- 8.4.1 Inventory management
- 8.4.2 Customer analytics
- 8.4.3 Self-checkout systems
- 8.4.4 Digital signage and smart displays
- 8.4.5 Others
- 8.5 Automotive
- 8.5.1 Advanced Driver Assistance Systems (ADAS)
- 8.5.2 Autonomous vehicles
- 8.5.3 In-cabin monitoring
- 8.5.4 Smart cockpit displays
- 8.5.5 Others
- 8.6 Security and surveillance
- 8.6.1 Public safety
- 8.6.2 Retail security
- 8.6.3 Industrial security
- 8.6.4 Residential security
- 8.6.5 Others
- 8.7 Agriculture
- 8.7.1 Crop monitoring
- 8.7.2 Livestock management
- 8.7.3 Precision farming
- 8.7.4 Others
- 8.8 Smart cities
- 8.8.1 Traffic management
- 8.8.2 Public safety
- 8.8.3 Infrastructure monitoring
- 8.8.4 Energy management
- 8.8.5 Others
- 8.9 Consumer electronics
- 8.9.1 Smartphones and tablets
- 8.9.2 Smart TVs and displays
- 8.9.3 AR/VR devices
- 8.9.4 Smart home devices
- 8.9.5 Others
- 8.10 Energy and utilities
- 8.10.1 Power grid monitoring
- 8.10.2 Renewable energy systems
- 8.10.3 Infrastructure inspection
- 8.10.4 Others
- 8.11 Others
Chapter 9 Market Estimates & Forecast, By Region, 2021-2034 ($Bn)
- 9.1 Key trends
- 9.2 North America
- 9.2.1 U.S.
- 9.2.2 Canada
- 9.3 Europe
- 9.3.1 UK
- 9.3.2 Germany
- 9.3.3 France
- 9.3.4 Italy
- 9.3.5 Spain
- 9.3.6 Russia
- 9.3.7 Nordics
- 9.4 Asia Pacific
- 9.4.1 China
- 9.4.2 India
- 9.4.3 Japan
- 9.4.4 South Korea
- 9.4.5 ANZ
- 9.4.6 Southeast Asia
- 9.5 Latin America
- 9.5.1 Brazil
- 9.5.2 Mexico
- 9.5.3 Argentina
- 9.6 MEA
- 9.6.1 South Africa
- 9.6.2 Saudi Arabia
- 9.6.3 UAE
Chapter 10 Company Profiles
- 10.1 Global Technology Leaders
- 10.1.1 NVIDIA
- 10.1.2 Intel
- 10.1.3 Microsoft
- 10.1.4 IBM
- 10.1.5 Google
- 10.1.6 Qualcomm
- 10.1.7 Sony
- 10.2 Industrial Vision and Automation Specialists
- 10.2.1 Cognex
- 10.2.2 Keyence
- 10.2.3 Basler
- 10.2.4 Omron
- 10.2.5 Teledyne
- 10.3 AI and Vision Software Innovators
- 10.3.1 Clarifai
- 10.3.2 Matterport
- 10.3.3 Visionatics
- 10.3.4 SmartCow
- 10.3.5 ZH-AOI
- 10.4 Semiconductor and Component Suppliers
- 10.4.1 MediaTek
- 10.4.2 Himax
- 10.4.3 Renesas Electronics
- 10.4.4 AUO Display Plus (ADP)
- 10.5 Edge Computing and Embedded Vision Companies
- 10.5.1 Aetina
- 10.5.2 Advantech
- 10.5.3 AAEON
- 10.5.4 Neousys
 2026年全球电脑视觉市场报告
 电脑视觉市场分析及预测(至2035年):按类型、产品类型、服务、技术、组件、应用、最终用户、功能、部署类型和解决方案划分
 2026-2030年全球医疗保健电脑视觉市场
 电脑视觉市场-全球产业规模、份额、趋势、机会和预测,按组件、产品类型、应用、垂直产业、地区和竞争格局划分,2021-2031年预测
 日本电脑视觉市场报告(按组件、产品类型、应用、垂直产业和地区划分,2026-2034 年)
 电脑视觉市场规模、份额和成长分析(按组件、产品类型和地区划分)-2026-2033年产业预测
 全球零售业电脑视觉人工智慧市场:市场规模、份额、趋势分析(按应用、最终用途、技术、部署方法和地区划分)、展望和预测(2025-2032 年)
 全球电脑视觉市场:预测至 2032 年—按组件、产品类型、部署方式、功能、应用、最终用户和地区进行分析
 全球电脑视觉市场规模、份额和行业分析报告:按产品、行业、组件、应用和地区划分,展望和预测(2025-2032年)
 电脑视觉:市场份额分析、行业趋势、统计数据和成长预测(2025-2030 年)