


 |
市场调查报告书
商品编码
1822563
汽车市场的数位孪生机会、成长动力、产业趋势分析及 2025 - 2034 年预测Digital Twin in Automotive Market Opportunity, Growth Drivers, Industry Trend Analysis, and Forecast 2025 - 2034 |
||||||
2024 年全球汽车数位孪生市场价值为 21 亿美元,预计到 2034 年将以 30.1% 的复合年增长率增长至 287 亿美元。
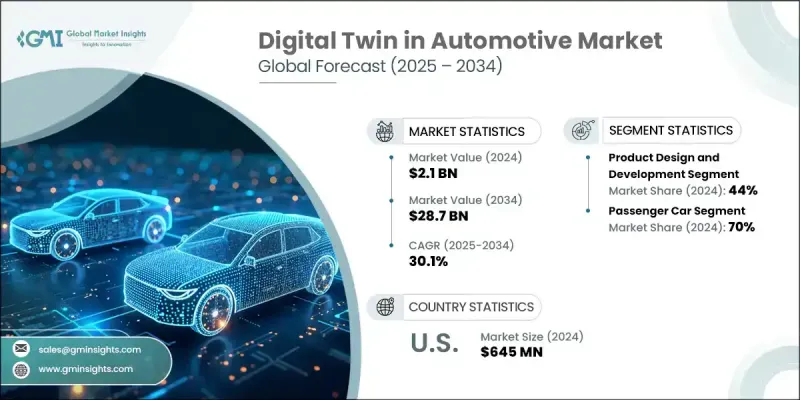
这一显着成长得益于汽车产业持续的数位转型。对互联技术、物联网 (IoT)、工业物联网 (IIoT) 和工业 4.0 原则的日益依赖,正在将传统汽车转变为智慧的数据驱动机器。随着汽车从机械硬体发展到复杂的软体平台,数位孪生技术正被用于管理来自感测器、系统和车载电脑的大量资料。汽车製造商正在利用这些资料来提升性能、预防故障,并透过人工智慧、机器学习和进阶分析技术实现预测性维护。事实证明,数位孪生不仅在类比设计和工程变更方面至关重要,而且在提高营运效率、指导员工培训和精简生产方面也发挥着重要作用。电动车和自动驾驶汽车需求的激增进一步加速了对支援更快原型设计和即时监控的虚拟复製品的需求。随着汽车产业朝着永续发展、零排放出行和智慧基础设施的方向发展,数位孪生的采用率预计将迅速上升。各大公司正积极应对,加强投资并制定策略性倡议,以在高成长环境中保持竞争力。
| 市场范围 | |
|---|---|
| 起始年份 | 2024 |
| 预测年份 | 2025-2034 |
| 起始值 | 21亿美元 |
| 预测值 | 287亿美元 |
| 复合年增长率 | 30.1% |
在这一市场中,产品设计和开发部门在2024年占据了44%的份额,预计在2025年至2034年期间的复合年增长率将达到29%。汽车製造商正在使用数位孪生技术在生产前开发和验证车辆零件。这使得团队能够降低原型设计成本,缩短开发週期,并加快电动车电池、动力系统和车辆空气动力学等复杂系统的创新。在早期阶段对复杂元素进行仿真,可加快测试速度、精确迭代并缩短上市时间。这些优势正在帮助原始设备製造商满足消费者日益增长的效能和客製化需求,同时保持领先于监管时间表。
2024年,乘用车市场占了70%的市场份额,预计到2034年将以29%的复合年增长率成长。汽车公司正在使用数位孪生技术来评估电动车电池在不同驾驶模式和环境条件下的性能。这种方法有助于优化热效率、能量密度和电池安全性等关键参数。透过提升电动车动力系统的性能和使用寿命,数位孪生技术直接有助于减少排放,并促进电动乘用车的更广泛应用。全球对永续交通解决方案的日益重视,进一步推动了数位孪生平台在该领域的应用。
2024年,美国汽车数位孪生市场占90%的市场份额,产值达6.45亿美元。美国汽车生态系统持续突破汽车创新的界限,尤其是在电动车和自动驾驶领域。各大公司正在利用数位孪生环境进行组件虚拟测试、效能微调,并应对电池管理等挑战,而无需等待实际故障发生。这些解决方案显着缩短了产品开发时间,同时提高了可靠性。对快速设计到部署週期的需求日益增长,在加速整个地区市场发展势头方面发挥关键作用。
全球汽车数位孪生市场的领先公司包括凯捷、西门子、通用电气、微软、IBM、博世和达梭系统。这些参与者是汽车领域客製化模拟和建模技术进步的关键贡献者。数位孪生汽车领域的顶尖公司正在透过持续创新、合作伙伴关係和有针对性的收购来扩大其市场份额。许多公司正在将人工智慧和高级分析整合到他们的平台中,以提供预测诊断和即时监控功能。各组织也正在开发可客製化、可扩展的解决方案,以满足从概念到营运的车辆生命週期的不同阶段的需求。为了增强竞争力,该公司正在与汽车製造商和软体开发商建立策略联盟,以简化全球营运中数位孪生工具的实施。
目录
第一章:方法论
- 市场范围和定义
- 研究设计
- 研究方法
- 资料收集方法
- 资料探勘来源
- 全球的
- 地区/国家
- 基础估算与计算
- 基准年计算
- 市场评估的主要趋势
- 初步研究和验证
- 主要来源
- 预测模型
- 研究假设和局限性
第 2 章:执行摘要
第三章:行业洞察
- 产业生态系统分析
- 供应商概况
- 利润率
- 成本结构
- 每个阶段的增值
- 影响价值链的因素
- 中断
- 产业衝击力
- 成长动力
- 人工智慧和自动化在招募中的应用日益增多
- 对集中招募平台的需求日益增长
- 远距和混合工作文化日益发展
- 与 CRM 和 HRIS 系统集成
- 转向数据驱动的招募决策
- 产业陷阱与挑战
- 高昂的初始设定和订阅成本
- 资料隐私和合规性问题
- 与遗留系统的整合复杂性
- 过度使用自动化导致候选人体验问题
- 针对利基行业的有限定制
- 市场机会
- 人工智慧驱动的候选人搜寻和技能匹配
- 新兴市场的扩张
- 与视讯面试和评估工具集成
- 自由职业和零工经济招聘
- 以行动优先的 ATS 采用
- 人力资源技术生态系合作伙伴关係
- 成长动力
- 数位孪生技术基础与架构
- 数位孪生基础与发展
- 数位孪生的类型:产品、流程、绩效、资产、系统
- 数位线程和资料互通性
- 基于模型的系统工程(MBSE)
- 物理-数位-物理(PDP)环路
- 即时数据同步与回馈
- 成长潜力分析
- 监管格局
- 北美洲
- 欧洲
- 亚太地区
- 拉丁美洲
- 中东和非洲
- 波特的分析
- PESTEL分析
- 技术创新与先进功能
- 类比引擎和求解器技术
- 物联网感测器整合和数据采集
- 边缘运算、5G 和即时数位孪生
- AI/ML 模型管理与模拟自动化
- AR/VR与沉浸式视觉化
- 云端、本机和混合架构
- API和系统整合能力
- 价格趋势分析
- 成本分解分析
- 专利分析
- 依技术领域分析专利组合
- 专利申请趋势与创新活动
- 竞争专利情报
- 永续性和环境方面
- 永续实践
- 减少废弃物的策略
- 生产中的能源效率
- 环保倡议
- 碳足迹考量
- 用例
- 产品设计与虚拟原型设计
- 概念设计、模拟和测试
- 轻量化和材料优化
- 碰撞和衝击模拟
- 製造与智慧工厂
- 生产计划与调度
- 机器人与自动化集成
- 品质控制和即时监控
- 工厂布局和流程优化
- 车辆性能与生命週期管理
- 预测性维护和状态监测
- 保固分析和召回管理
- 车队管理和使用情况分析
- OTA 更新与线上升级
- 供应炼和物流优化
- 供应链数位孪生与可视性
- 库存优化和需求预测
- 供应商协作与风险管理
- 物流网路仿真
- 客户体验和售后
- 个人化车辆配置及销售
- 数位展厅和VR/AR视觉化
- 互联服务和远端诊断
- 客户回馈循环和产品改进
- 监管、保固和合规性数位孪生
- 监理合规和数字报告
- 保固索赔和根本原因分析
- 安全认证和审计跟踪
- 产品设计与虚拟原型设计
- 最佳情况
- 报废、回收和循环经济
- 拆解回收的数位孪生
- 再製造、再利用和循环供应链
- 监理报告与合规
- 生命週期评估和碳影响
- 商业模式创新与货币化
- 数位孪生即服务(DTaaS)
- 按使用付费和订阅模式
- 基于价值的定价和基于结果的模型
- 数位孪生货币化和数据许可
- 组织变革、劳动力与流程转型
- 变更管理与数位孪生采用
- 劳动力再培训和人才发展
- 数位孪生成熟度模型与组织准备状况
- 流程再造与敏捷转型
- 生态系、标准和联盟
- 业界标准与参考架构
- 数位孪生联盟、ASAM 和其他联盟
- 开源与专有解决方案
- 生态系伙伴关係与互通性
- 永续性、ESG和生命週期评估
- 碳足迹分析和报告
- ESG指标与合规性
- 永续设计与绿色製造
- 循环经济与资源优化
- 投资报酬率、成本效益和回报分析
- 实施成本结构和投资要求
- 营运和财务效益
- 策略利益和竞争优势
- 投资报酬率架构与投资回收期分析
- 未来情境和中断分析
- 自动驾驶汽车与数位孪生集成
- MaaS、智慧城市与 V2 X
- 监管演变和政策影响
- 科技颠覆与产业转型
第四章:竞争格局
- 介绍
- 公司市占率分析
- 主要市场参与者的竞争分析
- 竞争定位矩阵
- 战略展望矩阵
- 关键进展
- 併购
- 伙伴关係与合作
- 新产品发布
- 扩张计划和资金
第五章:市场估计与预测:依部署模式,2021-2034
- 主要趋势
- 云
- 本地
- 杂交种
第六章:市场估计与预测:依车型,2021-2034
- 主要趋势
- 搭乘用车
- 掀背车
- 轿车
- SUV
- 商用车
- 轻型
- 中型
- 重负
第七章:市场估计与预测:依技术,2021-2034
- 主要趋势
- 系统数位孪生
- 产品数位孪生
- 流程数位孪生
第 8 章:市场估计与预测:按应用,2021-2034 年
- 主要趋势
- 产品设计与开发
- 机器和设备健康监测
- 流程支援和服务
第九章:市场估计与预测:依最终用途,2021-2034
- 主要趋势
- 原始设备製造商
- 一级供应商
- 汽车软体和技术公司
- 行动服务提供者
- 售后市场及服务中心
第 10 章:市场估计与预测:按地区,2021-2034 年
- 主要趋势
- 北美洲
- 我们
- 加拿大
- 欧洲
- 英国
- 德国
- 法国
- 义大利
- 西班牙
- 俄罗斯
- 北欧人
- 亚太地区
- 中国
- 印度
- 日本
- 韩国
- 澳新银行
- 东南亚
- 拉丁美洲
- 巴西
- 墨西哥
- 阿根廷
- 多边环境协定
- 南非
- 沙乌地阿拉伯
- 阿联酋
第 11 章:公司简介
- Global Leaders
- Altair
- Ansys
- Autodesk
- Capgemini
- Dassault Systemes
- General Electric
- IBM
- Microsoft
- Oracle
- PTC
- SAP
- Siemens
- Regional Champions
- AVL
- Bentley Systems
- Bosch
- Cognizant
- Hexagon
- KPIT Technologies
- Tata Technologies
- 新兴参与者/颠覆者
- Bosch
- General Electric
- Siemens Energy
The Global Digital Twin in Automotive Market was valued at USD 2.1 billion in 2024 and is estimated to grow at a CAGR of 30.1% to reach USD 28.7 billion by 2034.
This significant growth is being fueled by the ongoing digital transformation across the automotive sector. Increasing reliance on connected technologies, IoT, IIoT, and Industry 4.0 principles is transforming traditional vehicles into intelligent, data-driven machines. As vehicles evolve from mechanical hardware to complex software platforms, digital twin technology is being used to manage large-scale data from sensors, systems, and onboard computers. Automakers are leveraging this data to improve performance, prevent breakdowns, and enable predictive maintenance using AI, machine learning, and advanced analytics. Digital twins are proving vital not only in simulating design and engineering changes but also in enhancing operational efficiency, guiding workforce training, and streamlining production. The surge in demand for electric and autonomous vehicles is further accelerating the need for virtual replicas that support faster prototyping and real-time monitoring. As the industry pushes toward sustainability, zero-emission mobility, and smart infrastructure, digital twin adoption is expected to rise rapidly. Companies are responding with strong investment and strategic initiatives to remain competitive in this high-growth environment.
| Market Scope | |
|---|---|
| Start Year | 2024 |
| Forecast Year | 2025-2034 |
| Start Value | $2.1 Billion |
| Forecast Value | $28.7 Billion |
| CAGR | 30.1% |
Within this market, the product design and development segment held a 44% share in 2024 and is set to grow at a CAGR of 29% between 2025 and 2034. Automakers are using digital twin technology to develop and validate vehicle components before manufacturing. This allows teams to reduce prototyping costs, shorten development cycles, and speed up innovation for complex systems like EV batteries, powertrains, and vehicle aerodynamics. The simulation of intricate elements at an early stage enables faster testing, accurate iteration, and quicker time-to-market. These benefits are helping OEMs meet growing consumer demands for performance and customization while staying ahead of regulatory timelines.
The passenger car segment held a 70% share in 2024 and is expected to grow at a CAGR of 29% through 2034. Automotive companies are using digital twins to evaluate how EV batteries behave under diverse driving patterns and environmental conditions. This approach helps optimize key parameters such as thermal efficiency, energy density, and battery safety. By improving the performance and lifespan of EV power systems, digital twins contribute directly to reducing emissions and encouraging broader adoption of electric passenger vehicles. The growing global push toward sustainable transport solutions is further intensifying the use of digital twin platforms in this segment.
United States Digital Twin in Automotive Market held a 90% share in 2024, generating USD 645 million. The US automotive ecosystem continues to push the boundaries of vehicle innovation, especially in the electric and autonomous space. Companies are using digital twin environments to test components virtually, fine-tune performance, and address challenges like battery management all without waiting for real-world failures. These solutions are significantly cutting down product development time while increasing dependability. The growing demand for rapid design-to-deployment cycles is playing a critical role in accelerating market momentum across the region.
Leading companies in the Global Digital Twin in Automotive Market include Capgemini, Siemens, General Electric, Microsoft, IBM, Bosch, and Dassault Systemes. These players are key contributors to the advancement of simulation and modeling technologies tailored for the automotive landscape. Top companies in the digital twin automotive space are expanding their market presence through continuous innovation, collaborative partnerships, and focused acquisitions. Many are integrating AI and advanced analytics into their platforms to offer predictive diagnostics and real-time monitoring features. Organizations are also developing customizable, scalable solutions that cater to different stages of the vehicle lifecycle from concept to operation. To enhance competitiveness, firms are forming strategic alliances with automakers and software developers to streamline the implementation of digital twin tools across global operations.
Table of Contents
Chapter 1 Methodology
- 1.1 Market scope and definition
- 1.2 Research design
- 1.2.1 Research approach
- 1.2.2 Data collection methods
- 1.3 Data mining sources
- 1.3.1 Global
- 1.3.2 Regional/Country
- 1.4 Base estimates and calculations
- 1.4.1 Base year calculation
- 1.4.2 Key trends for market estimation
- 1.5 Primary research and validation
- 1.5.1 Primary sources
- 1.6 Forecast model
- 1.7 Research assumptions and limitations
Chapter 2 Executive Summary
- 2.1 Industry 360° synopsis, 2021 - 2034
- 2.2 Key market trends
- 2.2.1 Regional
- 2.2.2 Deployment Mode
- 2.2.3 Vehicle
- 2.2.4 Technology
- 2.2.5 Application
- 2.2.6 End Use
- 2.3 TAM Analysis, 2025-2034
- 2.4 CXO perspectives: Strategic imperatives
- 2.4.1 Executive decision points
- 2.4.2 Critical success factors
- 2.5 Future outlook and strategic recommendations
Chapter 3 Industry Insights
- 3.1 Industry ecosystem analysis
- 3.1.1 Supplier Landscape
- 3.1.2 Profit Margin
- 3.1.3 Cost structure
- 3.1.4 Value addition at each stage
- 3.1.5 Factor affecting the value chain
- 3.1.6 Disruptions
- 3.2 Industry impact forces
- 3.2.1 Growth drivers
- 3.2.1.1 Rising adoption of AI & automation in recruitment
- 3.2.1.2 Increasing need for centralized recruitment platforms
- 3.2.1.3 Growing remote & hybrid work culture
- 3.2.1.4 Integration with CRM and HRIS systems
- 3.2.1.5 Shift toward data-driven hiring decisions
- 3.2.2 Industry pitfalls and challenges
- 3.2.2.1 High initial setup and subscription costs
- 3.2.2.2 Data privacy & compliance concerns
- 3.2.2.3 Integration complexity with legacy systems
- 3.2.2.4 Candidate experience issues from automation overuse
- 3.2.2.5 Limited customization for niche industries
- 3.2.3 Market opportunities
- 3.2.3.1 AI-driven candidate sourcing & skill-matching
- 3.2.3.2 Expansion in emerging markets
- 3.2.3.3 Integration with video interviewing & assessment tools
- 3.2.3.4 Freelance & gig economy recruitment
- 3.2.3.5 Mobile-first ATS adoption
- 3.2.3.6 HR tech ecosystem partnerships
- 3.2.1 Growth drivers
- 3.3 Digital Twin Technology Foundation and Architecture
- 3.3.1 Digital Twin Fundamentals and Evolution
- 3.3.2 Types of Digital Twins: Product, Process, Performance, Asset, System
- 3.3.3 Digital Thread and Data Interoperability
- 3.3.4 Model-Based Systems Engineering (MBSE)
- 3.3.5 Physical-Digital-Physical (PDP) Loop
- 3.3.6 Real-Time Data Synchronization and Feedback
- 3.4 Growth potential analysis
- 3.5 Regulatory landscape
- 3.5.1 North America
- 3.5.2 Europe
- 3.5.3 Asia Pacific
- 3.5.4 Latin America
- 3.5.5 Middle East & Africa
- 3.6 Porter's analysis
- 3.7 PESTEL analysis
- 3.8 Technology innovation and advanced features
- 3.8.1 Simulation Engines and Solver Technology
- 3.8.2 IoT Sensor Integration and Data Acquisition
- 3.8.3 Edge Computing, 5G, and Real-Time Digital Twins
- 3.8.4 AI/ML Model Management and Simulation Automation
- 3.8.5 AR/VR and Immersive Visualization
- 3.8.6 Cloud, On-Premises, and Hybrid Architectures
- 3.8.7 API and System Integration Capabilities
- 3.9 Price trend analysis
- 3.10 Cost breakdown analysis
- 3.11 Patent analysis
- 3.11.1 Patent Portfolio Analysis by Technology Area
- 3.11.2 Patent Filing Trends and Innovation Activity
- 3.11.3 Competitive Patent Intelligence
- 3.12 Sustainability and Environmental Aspects
- 3.12.1 Sustainable Practices
- 3.12.2 Waste Reduction Strategies
- 3.12.3 Energy Efficiency in Production
- 3.12.4 Eco-friendly Initiatives
- 3.12.5 Carbon Footprint Considerations
- 3.13 Use cases
- 3.13.1 Product Design and Virtual Prototyping
- 3.13.1.1 Concept Design, Simulation, and Testing
- 3.13.1.2 Lightweighting and Material Optimization
- 3.13.1.3 Crash and Impact Simulation
- 3.13.2 Manufacturing and Smart Factory
- 3.13.2.1 Production Planning and Scheduling
- 3.13.2.2 Robotics and Automation Integration
- 3.13.2.3 Quality Control and Real-Time Monitoring
- 3.13.2.4 Factory Layout and Process Optimization
- 3.13.3 Vehicle Performance and Lifecycle Management
- 3.13.3.1 Predictive Maintenance and Condition Monitoring
- 3.13.3.2 Warranty Analytics and Recall Management
- 3.13.3.3 Fleet Management and Usage Analytics
- 3.13.3.4 OTA Updates and In-Service Upgrades
- 3.13.4 Supply Chain and Logistics Optimization
- 3.13.4.1 Supply Chain Digital Twin and Visibility
- 3.13.4.2 Inventory Optimization and Demand Forecasting
- 3.13.4.3 Supplier Collaboration and Risk Management
- 3.13.4.4 Logistics Network Simulation
- 3.13.5 Customer Experience and Aftersales
- 3.13.5.1 Personalized Vehicle Configuration and Sales
- 3.13.5.2 Digital Showroom and VR/AR Visualization
- 3.13.5.3 Connected Services and Remote Diagnostics
- 3.13.5.4 Customer Feedback Loop and Product Improvement
- 3.13.6 Regulatory, Warranty, and Compliance Digital Twins
- 3.13.6.1 Regulatory Compliance and Digital Reporting
- 3.13.6.2 Warranty Claims and Root Cause Analysis
- 3.13.6.3 Safety Certification and Audit Trail
- 3.13.1 Product Design and Virtual Prototyping
- 3.14 Best-case scenario
- 3.15 End-of-Life, Recycling, and Circular Economy
- 3.15.1 Digital Twin for Dismantling and Recycling
- 3.15.2 Remanufacturing, Reuse, and Circular Supply Chains
- 3.15.3 Regulatory Reporting and Compliance
- 3.15.4 Lifecycle Assessment and Carbon Impact
- 3.16 Business Model Innovation & Monetization
- 3.16.1 Digital Twin as a Service (DTaaS)
- 3.16.2 Pay-per-Use and Subscription Models
- 3.16.3 Value-Based Pricing and Outcome-Based Models
- 3.16.4 Digital Twin Monetization and Data Licensing
- 3.17 Organizational Change, Workforce, and Process Transformation
- 3.17.1 Change Management and Digital Twin Adoption
- 3.17.2 Workforce Reskilling and Talent Development
- 3.17.3 Digital Twin Maturity Models and Organizational Readiness
- 3.17.4 Process Reengineering and Agile Transformation
- 3.18 Ecosystem, Standards, and Consortia
- 3.18.1 Industry Standards and Reference Architectures
- 3.18.2 Digital Twin Consortium, ASAM, and Other Alliances
- 3.18.3 Open Source vs Proprietary Solutions
- 3.18.4 Ecosystem Partnerships and Interoperability
- 3.19 Sustainability, ESG, and Lifecycle Assessment
- 3.19.1 Carbon Footprint Analytics and Reporting
- 3.19.2 ESG Metrics and Compliance
- 3.19.3 Sustainable Design and Green Manufacturing
- 3.19.4 Circular Economy and Resource Optimization
- 3.20 ROI, Cost-Benefit, and Payback Analysis
- 3.20.1 Implementation Cost Structure and Investment Requirements
- 3.20.2 Operational and Financial Benefits
- 3.20.3 Strategic Benefits and Competitive Advantage
- 3.20.4 ROI Frameworks and Payback Period Analysis
- 3.21 Future Scenarios and Disruption Analysis
- 3.21.1 Autonomous Vehicles and Digital Twin Integration
- 3.21.2. MaaS, Smart Cities, and V2 X
- 3.21.3 Regulatory Evolution and Policy Impact
- 3.21.4 Technology Disruption and Industry Transformation
Chapter 4 Competitive Landscape, 2024
- 4.1 Introduction
- 4.2 Company market share analysis
- 4.2.1 North America
- 4.2.2 Europe
- 4.2.3 Asia Pacific
- 4.2.4 Latin America
- 4.2.5 MEA
- 4.3 Competitive analysis of major market players
- 4.4 Competitive positioning matrix
- 4.5 Strategic outlook matrix
- 4.6 Key developments
- 4.6.1 Mergers & acquisitions
- 4.6.2 Partnerships & collaborations
- 4.6.3 New Product Launches
- 4.6.4 Expansion Plans and funding
Chapter 5 Market Estimates & Forecast, By Deployment Mode, 2021-2034 ($Bn)
- 5.1 Key trends
- 5.2 Cloud
- 5.3 On-premises
- 5.4 Hybrid
Chapter 6 Market Estimates & Forecast, By Vehicle, 2021-2034 ($Bn)
- 6.1 Key trends
- 6.2 Passenger car
- 6.2.1 Hatchback
- 6.2.2 Sedan
- 6.2.3 SUV
- 6.3 Commercial vehicle
- 6.3.1 Light duty
- 6.3.2 Medium-duty
- 6.3.3 Heavy-duty
Chapter 7 Market Estimates & Forecast, By Technology, 2021-2034 ($Bn)
- 7.1 Key trends
- 7.2 System digital twin
- 7.3 Product digital twin
- 7.4 Process digital twin
Chapter 8 Market Estimates & Forecast, By Application, 2021-2034 ($Bn)
- 8.1 Key trends
- 8.2 Product design and development
- 8.3 Machine and equipment health monitoring
- 8.4 Process support and service
Chapter 9 Market Estimates & Forecast, By End Use, 2021-2034 ($Bn)
- 9.1 Key trends
- 9.2 OEMs
- 9.3 Tier 1 suppliers
- 9.4 Automotive software and technology companies
- 9.5 Mobility service providers
- 9.6 Aftermarket and service centers
Chapter 10 Market Estimates & Forecast, By Region, 2021-2034 ($Bn)
- 10.1 Key trends
- 10.2 North America
- 10.2.1 US
- 10.2.2 Canada
- 10.3 Europe
- 10.3.1 UK
- 10.3.2 Germany
- 10.3.3 France
- 10.3.4 Italy
- 10.3.5 Spain
- 10.3.6 Russia
- 10.3.7 Nordics
- 10.4 Asia Pacific
- 10.4.1 China
- 10.4.2 India
- 10.4.3 Japan
- 10.4.4 South Korea
- 10.4.5 ANZ
- 10.4.6 Southeast Asia
- 10.5 Latin America
- 10.5.1 Brazil
- 10.5.2 Mexico
- 10.5.3 Argentina
- 10.6 MEA
- 10.6.1 South Africa
- 10.6.2 Saudi Arabia
- 10.6.3 UAE
Chapter 11 Company Profiles
- 11.1 Global Leaders
- 11.1.1 Altair
- 11.1.2 Ansys
- 11.1.3 Autodesk
- 11.1.4 Capgemini
- 11.1.5 Dassault Systemes
- 11.1.6 General Electric
- 11.1.7 IBM
- 11.1.8 Microsoft
- 11.1.9 Oracle
- 11.1.10 PTC
- 11.1.11 SAP
- 11.1.12 Siemens
- 11.2 Regional Champions
- 11.2.1 AVL
- 11.2.2 Bentley Systems
- 11.2.3 Bosch
- 11.2.4 Cognizant
- 11.2.5 Hexagon
- 11.2.6 KPIT Technologies
- 11.2.7 Tata Technologies
- 11.3 Emerging Players / Disruptors
- 11.3.1 Bosch
- 11.3.2 General Electric
- 11.3.3 Siemens Energy
 洪水灾后重建市场:依服务类型、灾害原因、重建服务、最终用户和通路-2026-2032年全球预测电破碎平台市场:按类型、压力等级、最终用户和应用划分,全球预测,2026-2032年
 全球生态系修復服务市场规模、份额、趋势和成长分析报告(2026-2034年)
 乘用车数位双胞胎市场机会、成长要素、产业趋势分析及2026年至2035年预测
 汽车数位孪生市场-全球产业规模、份额、趋势、机会及预测(依车辆类型、零件类型、最终用户产业、地区及竞争格局划分,2021-2031年预测)汽车数位孪生硬体市场机会、成长驱动因素、产业趋势分析及预测(2025-2034年)
 2025年数位双胞胎血库物流全球市场报告电动车平台市场-全球产业规模、份额、趋势、机会和预测,按车辆类型、推进类型、组件、地区和竞争细分,2020-2030 年
 全球物流数位双胞胎市场全球汽车数位双胞胎市场