


 |
市场调查报告书
商品编码
1822596
紫外线感测器市场机会、成长动力、产业趋势分析及2025-2034年预测UV Sensors Market Opportunity, Growth Drivers, Industry Trend Analysis, and Forecast 2025 - 2034 |
||||||
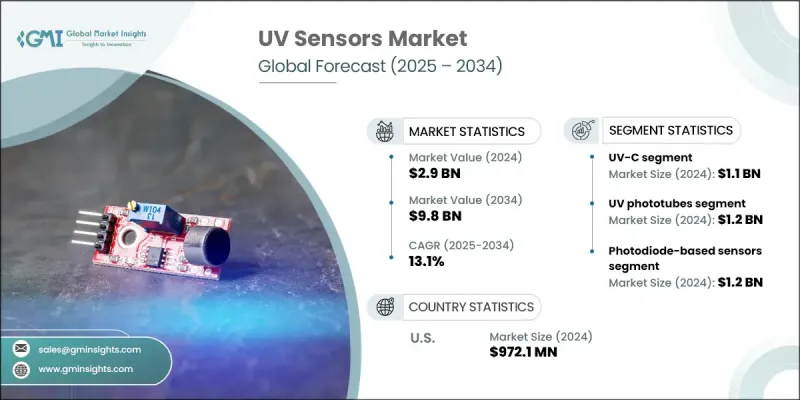
2024 年全球紫外线感测器市场价值为 29 亿美元,预计到 2034 年将以 13.1% 的复合年增长率增长至 98 亿美元。
这一激增的驱动因素包括紫外线消毒系统的日益普及、智慧穿戴装置整合的不断提升、环境和汽车监测的广泛应用,以及医疗保健和工业领域应用的不断扩展。人们对紫外线安全和环境监测意识的不断提高也推动了对这些感测器的持续需求。公共事业、医疗保健机构和商业场所等行业对紫外线消毒的使用日益增多,这仍然是关键的催化剂。在医院和医疗环境中,对用于表面、设备和空气消毒的UV-C系统的需求推动了对精确感测器的需求。此外,工业部门正在将紫外线感测器解决方案纳入製程控制、火焰侦测和环境合规系统中。塑造这一领域的一个主要趋势是专注于生产紧凑、经济高效的紫外线感测器,这有助于在工业和消费市场中实现更广泛的应用。微型组件的趋势提高了安全系统、自动化和穿戴式技术等应用的灵活性。
| 市场范围 | |
|---|---|
| 起始年份 | 2024 |
| 预测年份 | 2025-2034 |
| 起始值 | 29亿美元 |
| 预测值 | 98亿美元 |
| 复合年增长率 | 13.1% |
2024年,UV-C紫外线杀菌领域产值达11亿美元。随着水处理、医疗保健和市政卫生领域对杀菌解决方案的需求不断增长,该领域正在迅速扩张。 UV-C感测器对于精确测量剂量、控制辐照度和验证消毒性能至关重要。随着安全法规日益严格,製造商正优先开发高精度UV-C感测器,这些感测器能够在恶劣条件下持续运行,并为关键应用提供可追溯的可靠资料。
2024年,紫外线光电管市场价值达12亿美元。这些感测器因其在工业环境中的灵敏度和可靠性而备受推崇,尤其是在火焰探测、燃烧安全系统和光谱测量领域。它们在高风险环境中的精确度使其成为科学和操作环境中监测紫外线排放的首选解决方案。该领域的製造商正在努力提高光电管感测器的灵敏度和可靠性,同时确保符合消防安全法规和行业标准。
2024年,美国紫外线感测器市场规模达9.721亿美元。美国市场的成长得益于其完善的监管环境和UV-C技术的持续创新。政府法规确保紫外线相关设备符合功效和安全标准,从而提升了各行业的信任度和采用率。随着紫外线消毒系统和安全应用的部署不断增加,尤其是在医疗保健、环境监测和公共基础设施领域,对紫外线感测器的需求也随之增长。
全球紫外线感测器市场的知名企业包括 Silicon Laboratories Inc.、Vishay Intertechnology Inc.、Apogee Instruments Inc.、Texas Instruments Inc.、Analog Devices Inc.、Broadcom Inc.、Skye Instruments Ltd.、STMicroelectronics NV、Solaricon Light Co. Corp.、Genicom Co. Ltd.、GaNo Optoelectronics Inc. 和 ams OSRAM AG。紫外线感测器市场的公司正在采取多管齐下的方法来巩固其市场地位。许多公司正在投资开发高精度、可追溯至 NIST 的传感器,旨在满足医疗保健、环境安全和火焰检测等关键应用领域的严格监管要求。 Broadcom、Texas Instruments 和 Apogee Instruments 等公司正在透过整合无线连接和即时监控等先进功能来扩展其产品组合。
目录
第一章:方法论与范围
第二章:执行摘要
第三章:行业洞察
- 产业生态系统分析
- 供应商格局
- 利润率
- 成本结构
- 每个阶段的增值
- 影响价值链的因素
- 中断
- 产业生态系统分析
- 产业衝击力
- 成长动力
- 紫外线消毒需求不断成长
- 穿戴式科技的成长
- 汽车和座舱环境感测器
- 医疗保健应用的成长
- 工业应用部署不断增加
- 陷阱与挑战
- 先进感测器成本高昂
- 缺乏标准化和绩效参差不齐
- 成长动力
- 成长潜力分析
- 监管格局
- 北美洲
- 欧洲
- 亚太地区
- 拉丁美洲
- 中东和非洲
- 波特的分析
- PESTEL分析
- 技术和创新格局
- 当前的技术趋势
- 新兴技术
- 新兴商业模式
- 合规要求
- 永续性措施
- 专利和智慧财产权分析
- 地缘政治与贸易动态
第四章:竞争格局
- 介绍
- 公司市占率分析
- 按地区
- 北美洲
- 欧洲
- 亚太地区
- 拉丁美洲
- 中东和非洲
- 市场集中度分析
- 按地区
- 关键参与者的竞争基准
- 财务绩效比较
- 收入
- 利润率
- 研发
- 产品组合比较
- 产品范围广度
- 科技
- 创新
- 地理位置比较
- 全球足迹分析
- 服务网路覆盖
- 各地区市场渗透率
- 竞争定位矩阵
- 领导者
- 挑战者
- 追踪者
- 利基市场参与者
- 战略展望矩阵
- 财务绩效比较
- 2021-2024 年关键发展
- 併购
- 伙伴关係与合作
- 技术进步
- 扩张和投资策略
- 永续发展倡议
- 数位转型倡议
- 新兴/新创企业竞争对手格局
第五章:市场估计与预测:按类型,2021 - 2034
- 主要趋势
- 紫外线A
- 紫外线B
- 紫外线C
- 组合紫外线
第六章:市场估计与预测:依紫外线类型,2021 - 2034 年
- 主要趋势
- 紫外线光电管
- 光感应器
- 紫外光谱感测器
第七章:市场估计与预测:按技术,2021 - 2034 年
- 主要趋势
- 基于光电二极体的感测器
- 基于光电晶体管的感测器
- 基于CMOS的感测器
- 其他的
第 8 章:市场估计与预测:按最终用途应用,2021 - 2034 年
- 主要趋势
- 军事与国防
- 辐射暴露侦测
- 现场净化系统
- 其他的
- 消费性电子产品
- 穿戴式装置
- 智慧型手机和平板电脑
- 智慧家庭设备
- 其他的
- 医疗保健
- 紫外线消毒和灭菌系统
- 医疗光疗设备
- 紫外线皮肤治疗
- 其他的
- 工业的
- 紫外线曝光检测
- 机械安全系统
- 过程控制
- 其他的
- 汽车和运输
- 舱内紫外线监测系统
- 油漆和内装材料保护
- 其他的
- 农业和食品工业
- 环境监测
- 研究与教育
- 其他的
第九章:市场估计与预测:按地区,2021 - 2034
- 主要趋势
- 北美洲
- 我们
- 加拿大
- 欧洲
- 德国
- 英国
- 法国
- 西班牙
- 义大利
- 荷兰
- 亚太地区
- 中国
- 印度
- 日本
- 澳洲
- 韩国
- 拉丁美洲
- 巴西
- 墨西哥
- 阿根廷
- 中东和非洲
- 沙乌地阿拉伯
- 南非
- 阿联酋
第十章:公司简介
- 全球关键参与者
- Vishay Intertechnology Inc.
- STMicroelectronics NV
- ams OSRAM AG
- 区域关键参与者
- 北美洲
- Silicon Laboratories Inc.
- Texas Instruments Inc.
- Apogee Instruments Inc.
- 欧洲
- Skye Instruments Ltd.
- Analog Devices, Inc.
- Solar Light Co. Inc.
- Asia-Pacific
- Panasonic Holdings Corp.
- LAPIS Semiconductor Co. Ltd.
- Genicom Co. Ltd.
- 北美洲
- 颠覆者/利基市场参与者
- Broadcom Inc.
- Davis Instruments Corp.
- GaNo Optoelectronics Inc.
The Global UV Sensors Market was valued at USD 2.9 billion in 2024 and is estimated to grow at a CAGR of 13.1% to reach USD 9.8 billion by 2034.
This surge is driven by growing adoption of UV disinfection systems, increasing integration in smart wearables, widespread use in environmental and automotive monitoring, and expanding applications in healthcare and industrial sectors. Rising awareness of UV safety and environmental monitoring also fuels consistent demand for these sensors. Increasing usage of UV-based disinfection across sectors such as public utilities, healthcare settings, and commercial spaces continues to be a key catalyst. In hospitals and medical environments, demand for UV-C systems to sterilize surfaces, equipment, and air is pushing the requirement for accurate sensors. Moreover, industrial sectors are incorporating UV sensor solutions into process control, flame detection, and environmental compliance systems. A major trend shaping this space is the focus on producing compact, cost-effective UV sensors, which supports greater adoption in both industrial and consumer markets. The trend toward miniaturized components has improved flexibility in applications across safety systems, automation, and wearable technology.
| Market Scope | |
|---|---|
| Start Year | 2024 |
| Forecast Year | 2025-2034 |
| Start Value | $2.9 Billion |
| Forecast Value | $9.8 Billion |
| CAGR | 13.1% |
The UV-C segment generated USD 1.1 billion in 2024. It is expanding rapidly as demand grows for germicidal solutions in water treatment, healthcare, and municipal sanitation. UV-C sensors are essential for accurate dose measurement, irradiance control, and verifying disinfection performance. With safety regulations becoming more stringent, manufacturers are prioritizing the development of high-precision UV-C sensors that can operate consistently in rugged conditions and deliver traceable, reliable data for critical applications.
The UV phototubes segment was valued at USD 1.2 billion in 2024. These sensors are highly valued for their sensitivity and reliability in industrial environments, particularly in flame detection, combustion safety systems, and spectroscopic measurements. Their accuracy in high-risk environments makes them a go-to solution for monitoring UV emissions in both scientific and operational settings. Manufacturers in this segment are working toward enhancing the sensitivity and reliability of their phototube sensors while ensuring compliance with fire-safety regulations and industrial standards.
U.S. UV Sensors Market generated USD 972.1 million in 2024. Growth in the U.S. is supported by a strong regulatory landscape and continual innovations in UV-C technologies. Government regulations ensure that UV-related devices meet efficacy and safety standards, which has encouraged greater trust and adoption across sectors. The demand for UV sensors has grown in alignment with the increased deployment of UV disinfection systems and safety applications, especially in healthcare, environmental monitoring, and public infrastructure.
Prominent players in the Global UV Sensors Market include Silicon Laboratories Inc., Vishay Intertechnology Inc., Apogee Instruments Inc., Texas Instruments Inc., Analog Devices Inc., Broadcom Inc., Skye Instruments Ltd., STMicroelectronics N.V., Solar Light Co. Inc., Panasonic Holdings Corp., LAPIS Semiconductor Co. Ltd., Davis Instruments Corp., Genicom Co. Ltd., GaNo Optoelectronics Inc., and ams OSRAM AG. Companies in the UV sensors market are adopting a multi-pronged approach to reinforce their market presence. Many are investing in the development of highly accurate, NIST-traceable sensors designed to meet stringent regulatory demands in critical applications such as healthcare, environmental safety, and flame detection. Firms like Broadcom, Texas Instruments, and Apogee Instruments are expanding their product portfolios by integrating advanced features like wireless connectivity and real-time monitoring capabilities.
Table of Contents
Chapter 1 Methodology and scope
- 1.1 Market scope and definition
- 1.2 Research design
- 1.2.1 Research approach
- 1.2.2 Data collection methods
- 1.3 Data mining sources
- 1.3.1 Global
- 1.3.2 Regional/Country
- 1.4 Base estimates and calculations
- 1.4.1 Base year calculation
- 1.4.2 Key trends for market estimation
- 1.5 Primary research and validation
- 1.5.1 Primary sources
- 1.6 Forecast model
- 1.7 Research assumptions and limitations
Chapter 2 Executive summary
- 2.1 Industry 3600 synopsis
- 2.2 Key market trends
- 2.2.1 UV type trends
- 2.2.2 Type trends
- 2.2.3 Technology trends
- 2.2.4 end use application trends
- 2.2.5 Regional trends
- 2.3 TAM Analysis, 2025-2034 (USD Billion)
- 2.4 CXO perspectives: Strategic imperatives
- 2.4.1 Executive decision points
- 2.4.2 Critical success factors
- 2.5 Future outlook and strategic recommendations
Chapter 3 Industry insights
- 3.1 Industry ecosystem analysis
- 3.1.1 Supplier landscape
- 3.1.2 Profit margin
- 3.1.3 Cost structure
- 3.1.4 Value addition at each stage
- 3.1.5 Factor affecting the value chain
- 3.1.6 Disruptions
- 3.2 Industry ecosystem analysis
- 3.3 Industry impact forces
- 3.3.1 Growth drivers
- 3.3.1.1 Rising Demand for UV Disinfection
- 3.3.1.2 Growth in Wearable Technology
- 3.3.1.3 Automotive & Cabin Environmental Sensors
- 3.3.1.4 Growth in Healthcare Applications
- 3.3.1.5 Increasing deployment in industrial application
- 3.3.2 Pitfalls and challenges
- 3.3.2.1 High Costs of Advanced Sensors
- 3.3.2.2 Lack of Standardization & Variable Performance
- 3.3.1 Growth drivers
- 3.4 Growth potential analysis
- 3.5 Regulatory landscape
- 3.5.1 North America
- 3.5.2 Europe
- 3.5.3 Asia Pacific
- 3.5.4 Latin America
- 3.5.5 Middle East & Africa
- 3.6 Porter's analysis
- 3.7 PESTEL analysis
- 3.8 Technology and Innovation landscape
- 3.8.1 Current technological trends
- 3.8.2 Emerging technologies
- 3.9 Emerging Business Models
- 3.10 Compliance Requirements
- 3.11 Sustainability Measures
- 3.12 Patent and IP analysis
- 3.13 Geopolitical and trade dynamics
Chapter 4 Competitive landscape, 2024
- 4.1 Introduction
- 4.2 Company market share analysis
- 4.2.1 By region
- 4.2.1.1 North America
- 4.2.1.2 Europe
- 4.2.1.3 Asia Pacific
- 4.2.1.4 Latin America
- 4.2.1.5 Middle East & Africa
- 4.2.2 Market Concentration Analysis
- 4.2.1 By region
- 4.3 Competitive benchmarking of key players
- 4.3.1 Financial performance comparison
- 4.3.1.1 Revenue
- 4.3.1.2 Profit margin
- 4.3.1.3 R&D
- 4.3.2 Product portfolio comparison
- 4.3.2.1 Product range breadth
- 4.3.2.2 Technology
- 4.3.2.3 Innovation
- 4.3.3 Geographic presence comparison
- 4.3.3.1 Global footprint analysis
- 4.3.3.2 Service network coverage
- 4.3.3.3 Market penetration by region
- 4.3.4 Competitive positioning matrix
- 4.3.4.1 Leaders
- 4.3.4.2 Challengers
- 4.3.4.3 Followers
- 4.3.4.4 Niche players
- 4.3.5 Strategic outlook matrix
- 4.3.1 Financial performance comparison
- 4.4 Key developments, 2021-2024
- 4.4.1 Mergers and acquisitions
- 4.4.2 Partnerships and collaborations
- 4.4.3 Technological advancements
- 4.4.4 Expansion and investment strategies
- 4.4.5 Sustainability initiatives
- 4.4.6 Digital transformation initiatives
- 4.5 Emerging/ startup competitors landscape
Chapter 5 Market estimates and forecast, by Type, 2021 - 2034 (USD Million & Thousand Units)
- 5.1 Key trends
- 5.2 UV-A
- 5.3 UV-B
- 5.4 UV-C
- 5.5 Combined UV
Chapter 6 Market estimates and forecast, by UV Type, 2021 - 2034 (USD Million & Thousand Units)
- 6.1 Key trends
- 6.2 UV phototubes
- 6.3 Light sensors
- 6.4 UV spectrum sensors
Chapter 7 Market estimates and forecast, by Technology, 2021 - 2034 (USD Million & Thousand Units)
- 7.1 Key trends
- 7.2 Photodiode-based sensors
- 7.3 Phototransistor-based sensors
- 7.4 CMOS-based sensors
- 7.5 Others
Chapter 8 Market estimates and forecast, by End Use Application, 2021 - 2034 (USD Million & Thousand Units)
- 8.1 Key trends
- 8.2 Military & defense
- 8.2.1 Radiation exposure detection
- 8.2.2 Field decontamination systems
- 8.2.3 Others
- 8.3 Consumer electronics
- 8.3.1 Wearables
- 8.3.2 Smartphones and tablets
- 8.3.3 Smart home devices
- 8.3.4 Others
- 8.4 Healthcare and medical
- 8.4.1 UV disinfection and sterilization systems
- 8.4.2 Medical phototherapy devices
- 8.4.3 UV skin treatment
- 8.4.4 Others
- 8.5 Industrial
- 8.5.1 UV exposure detection
- 8.5.2 Machinery safety systems
- 8.5.3 Process control
- 8.5.4 Others
- 8.6 Automotive and transportation
- 8.6.1 In-cabin UV monitoring systems
- 8.6.2 Paint and interior material protection
- 8.6.3 Others
- 8.7 Agriculture and food industry
- 8.8 Environmental monitoring
- 8.9 Research and education
- 8.10 Others
Chapter 9 Market estimates and forecast, by Region, 2021 - 2034 (USD Million & Thousand Units)
- 9.1 Key trends
- 9.2 North America
- 9.2.1 U.S.
- 9.2.2 Canada
- 9.3 Europe
- 9.3.1 Germany
- 9.3.2 UK
- 9.3.3 France
- 9.3.4 Spain
- 9.3.5 Italy
- 9.3.6 Netherlands
- 9.4 Asia Pacific
- 9.4.1 China
- 9.4.2 India
- 9.4.3 Japan
- 9.4.4 Australia
- 9.4.5 South Korea
- 9.5 Latin America
- 9.5.1 Brazil
- 9.5.2 Mexico
- 9.5.3 Argentina
- 9.6 Middle East and Africa
- 9.6.1 Saudi Arabia
- 9.6.2 South Africa
- 9.6.3 UAE
Chapter 10 Company profiles
- 10.1 Global Key Players
- 10.1.1 Vishay Intertechnology Inc.
- 10.1.2 STMicroelectronics N.V.
- 10.1.3 ams OSRAM AG
- 10.2 Regional Key Players
- 10.2.1 North America
- 10.2.1.1 Silicon Laboratories Inc.
- 10.2.1.2 Texas Instruments Inc.
- 10.2.1.3 Apogee Instruments Inc.
- 10.2.2 Europe
- 10.2.2.1 Skye Instruments Ltd.
- 10.2.2.2 Analog Devices, Inc.
- 10.2.2.3 Solar Light Co. Inc.
- 10.2.3 Asia-Pacific
- 10.2.3.1 Panasonic Holdings Corp.
- 10.2.3.2 LAPIS Semiconductor Co. Ltd.
- 10.2.3.3 Genicom Co. Ltd.
- 10.2.1 North America
- 10.3 Disruptors / Niche Players
- 10.3.1 Broadcom Inc.
- 10.3.2 Davis Instruments Corp.
- 10.3.3 GaNo Optoelectronics Inc.

