


 |
市场调查报告书
商品编码
1833444
无线显示市场机会、成长动力、产业趋势分析及 2025 - 2034 年预测Wireless Display Market Opportunity, Growth Drivers, Industry Trend Analysis, and Forecast 2025 - 2034 |
||||||
2024 年全球无线显示市场价值为 60.3 亿美元,预计到 2034 年将以 12.7% 的复合年增长率增长至 198.6 亿美元。
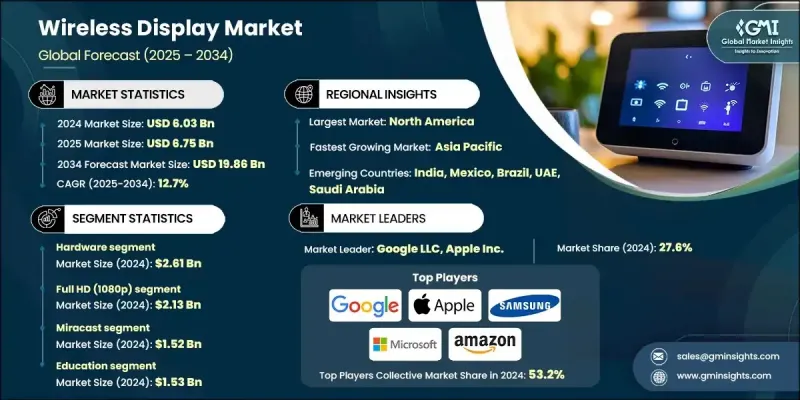
这一成长轨蹟的驱动因素包括智慧型手机和智慧电视的日益普及、BYOD趋势和混合工作环境的广泛实施、线上教育模式的快速扩展以及无线显示器在消费和专业领域的日益普及。 Wi-Fi 6/6E和5G技术的持续进步正在增强无线连接,使萤幕投影和装置互通性更快、更可靠。智慧家庭和工作场所向无线通讯的转变凸显了对无缝高清内容共享日益增长的需求。无线显示解决方案支援即时协作和内容分发,无需繁琐的线缆。无论是在会议室、教室或家庭,其吸引力都在于轻鬆的连接、灵敏的性能和跨装置的兼容性。这种跨产业的应用正在推动北美、亚太地区以及全球其他不断发展的数位生态系统对无线显示器的需求。
| 市场范围 | |
|---|---|
| 起始年份 | 2024 |
| 预测年份 | 2025-2034 |
| 起始值 | 60.3亿美元 |
| 预测值 | 198.6亿美元 |
| 复合年增长率 | 12.7% |
2024年,硬体市场规模达26.1亿美元。该领域持续吸引企业、教育工作者和消费者对直觉、无线显示解决方案的需求。投射加密狗、适配器、显示接收器和整合智慧萤幕等产品,可在各种装置上轻鬆实现高品质的萤幕镜像。这些硬体工具支援流行的无线协议和标准,可在工作场所、教育环境和娱乐系统中提供即插即用的兼容性。
2024年,全高清(1080p)解析度市场规模达21.3亿美元。全高清凭藉其低延迟、低频宽消耗的出色表现,依然是众多设备中最受欢迎的解析度标准。随着视讯通话、教育课程和娱乐应用中对流畅萤幕共享和串流媒体播放的需求日益增长,全高清凭藉高效的性能持续满足用户期望。其在笔记型电脑、投影机、行动装置和电视领域的广泛应用,进一步巩固了其在无线显示领域的地位。
美国无线显示市场在2024年创造了16.2亿美元的产值,预计到2034年将以13.2%的复合年增长率成长。无线显示解决方案需求的成长与远端和混合工作模式的激增以及智慧型装置在家庭中的广泛使用密切相关。美国强大的科技基础设施加速了跨平台萤幕镜像工具在企业和消费者环境中的普及。随着学校、企业和娱乐供应商对无缝即时显示技术的依赖日益增加,美国市场将继续在塑造全球趋势方面发挥关键作用。
无线显示市场的知名公司包括LG电子公司、亚马逊公司、巴可公司、苹果公司、Netgear公司、ScreenBeam公司、夏普公司、明基电通公司、英特尔公司、谷歌公司、三星电子有限公司、戴尔科技公司、微软公司和Airtame ApS。为了提升市场占有率,无线显示公司正在采取专注于跨平台相容性、整合和创新的策略。许多领先公司正在投资研发,以推出支援多种无线协定(如Miracast、AirPlay和Chromecast)的产品,确保广泛的设备互通性。扩大与原始设备製造商(OEM)和设备製造商的合作伙伴关係,使参与者能够将无线显示技术直接嵌入到智慧电视、投影机、笔记型电脑和行动装置中。
目录
第一章:方法论与范围
第二章:执行摘要
第三章:行业洞察
- 产业生态系统分析
- 供应商概况
- 利润率
- 成本结构
- 每个阶段的增值
- 影响价值链的因素
- 中断
- 产业衝击力
- 成长动力
- 智慧型电视和智慧型手机普及率激增
- 对 BYOD 和混合工作模式的需求不断增长
- 线上学习与教育科技平台的扩展
- 串流媒体服务和游戏平台的激增
- Wi-Fi 6/6e 和 5G 连线的进步
- 产业陷阱与挑战
- 互通性和设备相容性问题
- 延迟、讯号干扰和频宽限制
- 市场机会
- 与统一通讯平台集成
- 智慧教室和数位化学习的应用
- 汽车资讯娱乐系统的扩展
- 用于远端工作的基于云端的无线显示
- 成长动力
- 成长潜力分析
- 监管格局
- 北美洲
- 欧洲
- 亚太地区
- 拉丁美洲
- 中东和非洲
- 波特的分析
- PESTEL分析
- 技术和创新格局
- 当前的技术趋势
- 新兴技术
- 价格趋势
- 按地区
- 按产品
- 定价策略
- 新兴商业模式
- 合规性要求
- 永续性措施
- 消费者情绪分析
- 专利和智慧财产权分析
- 地缘政治与贸易动态
第四章:竞争格局
- 公司简介 市占率分析
- 公司市占率分析
- 按地区
- 北美洲
- 欧洲
- 亚太地区
- 市场集中度分析
- 关键参与者的竞争基准化分析
- 财务绩效比较
- 收入
- 利润率
- 研发
- 产品组合比较
- 产品范围广度
- 科技
- 创新
- 地理分布比较
- 全球足迹分析
- 服务网路覆盖
- 各地区市场渗透率
- 竞争定位矩阵
- 领导者
- 挑战者
- 追踪者
- 利基市场参与者
- 战略展望矩阵
- 财务绩效比较
- 2021-2024 年关键发展
- 併购
- 伙伴关係与合作
- 技术进步
- 扩张和投资策略
- 永续发展倡议
- 数位转型计划
- 新兴/新创企业竞争对手格局
第五章:市场估计与预测:依组件划分,2021 - 2034 年
- 主要趋势
- 硬体
- 显示装置
- 智慧电视
- 监视器
- 投影仪
- 无线适配器
- 传输和通讯模组
- 天线
- 接收器
- 中继器
- 其他的
- 显示装置
- 软体
- 面向消费者的软体
- 企业/协作软体
- 内容管理与媒体平台
- 安全和设备管理软体
- 其他的
- 服务
- 设定和安装
- 维护与支援
- 基于云端的串流媒体
第六章:市场估计与预测:依决议,2021 - 2034 年
- 主要趋势
- 高清(720p)
- 全高清(1080p)
- 4K 超高清
- 8K以上
第七章:市场估计与预测:按技术,2021 - 2034 年
- 主要趋势
- WiDi(英特尔无线显示)
- Miracast
- AirPlay
- Google Cast(Chromecast)
- 其他的
第 8 章:市场估计与预测:按最终用途产业,2021 年至 2034 年
- 主要趋势
- 消费性电子产品
- 家庭娱乐
- 游戏机和电脑
- 智慧音箱
- 家庭自动化
- 其他的
- 卫生保健
- 病人监护系统
- 医疗影像显示器
- 外科手术室
- 培训和电子学习
- 其他的
- 教育
- 线上学习
- 智慧校园
- 互动式白板和投影仪
- 教育内容串流媒体
- 其他的
- 政府和国防
- 指挥与控制中心
- 公共部门办公室和行政部门
- 监控和监视显示器
- 军事训练与模拟
- 其他的
- 媒体和娱乐
- 广播
- 后製和编辑套件
- 电影院和剧院数位投影
- 活动和音乐会视觉展示
- 其他的
- 零售
- 数位看板和广告
- 互动式资讯亭和店内展示
- 销售点(POS)系统
- 其他的
- 工业/企业
- 控制室
- 视讯会议
- 工厂车间监控
- 培训和入职展示
- 其他的
- 其他的
第九章:市场估计与预测:按地区,2021 - 2034
- 主要趋势
- 北美洲
- 我们
- 加拿大
- 欧洲
- 德国
- 英国
- 法国
- 义大利
- 西班牙
- 荷兰
- 欧洲其他地区
- 亚太地区
- 中国
- 印度
- 日本
- 韩国
- 澳洲
- 亚太其他地区
- 拉丁美洲
- 巴西
- 墨西哥
- 阿根廷
- 拉丁美洲其他地区
- 中东和非洲
- 阿联酋
- 沙乌地阿拉伯
- 南非
- MEA 其余地区
第十章:公司简介
- 全球参与者:
- Amazon.com, Inc.
- Apple Inc.
- Barco NV
- Dell Technologies Inc.
- Google LLC
- HP Inc.
- Intel Corporation
- Lenovo Group Limited
- LG Electronics Inc.
- Microsoft Corporation
- Panasonic Corporation
- Samsung Electronics Co., Ltd.
- Sharp Corporation
- 区域参与者:
- Belkin International, Inc.
- Epson America, Inc.
- Netgear Inc.
- Vanco International, LLC
- 新兴参与者:
- Actiontec Electronics, Inc.
- Airtame ApS
- BenQ Corporation
- ScreenBeam Inc.
The Global Wireless Display Market was valued at USD 6.03 billion in 2024 and is estimated to grow at a CAGR of 12.7% to reach USD 19.86 billion by 2034.
This growth trajectory is driven by increasing adoption of smartphones and smart TVs, the widespread implementation of BYOD trends and hybrid work environments, the rapid scaling of online education models, and the rising use of wireless displays in both consumer and professional spaces. Continued progress in Wi-Fi 6/6E and 5G technologies is enhancing wireless connectivity, making screen casting and device interoperability faster and more reliable. The shift toward wireless communication within smart homes and workplaces underscores the growing demand for seamless, high-definition content sharing. Wireless display solutions support real-time collaboration and content distribution without the clutter of cables. Whether in boardrooms, classrooms, or households, the appeal lies in effortless connectivity, responsive performance, and compatibility across devices. This cross-sector adoption is fueling demand for wireless displays across North America, Asia-Pacific, and other growing digital ecosystems worldwide.
| Market Scope | |
|---|---|
| Start Year | 2024 |
| Forecast Year | 2025-2034 |
| Start Value | $6.03 billion |
| Forecast Value | $19.86 billion |
| CAGR | 12.7% |
In 2024, the hardware segment generated USD 2.61 billion. It continues to attract demand from businesses, educators, and consumers seeking intuitive, cable-free display solutions. Products such as casting dongles, adapters, display receivers, and integrated smart screens enable easy, high-quality screen mirroring across a variety of devices. These hardware tools support popular wireless protocols and standards, offering plug-and-play compatibility in workspaces, education settings, and entertainment systems.
The Full HD (1080p) resolution segment generated USD 2.13 billion in 2024. Full HD remains the most preferred resolution standard across a broad range of devices due to its ability to deliver crisp visuals with low latency while maintaining moderate bandwidth consumption. As demand increases for fluid screen-sharing and streaming in video calls, educational sessions, and entertainment applications, Full HD continues to meet user expectations with efficient performance. Its broad adoption in laptops, projectors, mobile devices, and TVs further strengthens its position in the wireless display landscape.
United States Wireless Display Market generated USD 1.62 billion in 2024 and is expected to grow at a CAGR of 13.2% through 2034. The rise in demand for wireless display solutions is closely tied to the surge in remote and hybrid work models and the widespread use of smart devices across households. The country's robust tech infrastructure has accelerated the adoption of cross-platform screen mirroring tools in both enterprise and consumer settings. As schools, corporations, and entertainment providers increase reliance on seamless, real-time display technologies, the U.S. market continues to play a pivotal role in shaping global trends.
Prominent companies operating in the wireless display market include LG Electronics Inc., Amazon.com, Inc., Barco NV, Apple Inc., Netgear Inc., ScreenBeam Inc., Sharp Corporation, BenQ Corporation, Intel Corporation, Google LLC, Samsung Electronics Co., Ltd., Dell Technologies Inc., Microsoft Corporation, and Airtame ApS. To enhance their market presence, wireless display companies are adopting strategies focused on cross-platform compatibility, integration, and innovation. Many leading firms are investing in R&D to launch products that support multiple wireless protocols like Miracast, AirPlay, and Chromecast, ensuring wide device interoperability. Expanding partnerships with OEMs and device manufacturers allows players to embed wireless display technologies directly into smart TVs, projectors, laptops, and mobile devices.
Table of Contents
Chapter 1 Methodology and Scope
- 1.1 Market scope and definition
- 1.2 Research design
- 1.2.1 Research approach
- 1.2.2 Data collection methods
- 1.3 Data mining sources
- 1.3.1 Global
- 1.3.2 Regional/Country
- 1.4 Base estimates and calculations
- 1.4.1 Base year calculation
- 1.4.2 Key trends for market estimation
- 1.5 Primary research and validation
- 1.5.1 Primary sources
- 1.6 Forecast model
- 1.7 Research assumptions and limitations
Chapter 2 Executive Summary
- 2.1 Industry 3600 synopsis
- 2.2 Key market trends
- 2.2.1. Component
- 2.2.2 Resolution
- 2.2.3 Technology
- 2.2.4 End Use Industry
- 2.2.5 North America
- 2.2.6 Europe
- 2.2.7 Asia Pacific
- 2.2.8 Latin America
- 2.2.9 Middle East & Africa
- 2.3 TAM Analysis, 2025-2034 (USD Million)
- 2.4 CXO perspective: Strategic imperatives
- 2.5 Executive decision points
- 2.6 Critical Success Factors
- 2.7 Future Outlook and Strategic Recommendations
Chapter 3 Industry Insights
- 3.1 Industry ecosystem analysis
- 3.1.1 Supplier Landscape
- 3.1.2 Profit Margin
- 3.1.3 Cost structure
- 3.1.4 Value addition at each stage
- 3.1.5 Factor affecting the value chain
- 3.1.6 Disruptions
- 3.2 Industry impact forces
- 3.2.1 Growth drivers
- 3.2.1.1 Surge in smart TV and smartphone adoption
- 3.2.1.2 Rising demand for BYOD and hybrid work models
- 3.2.1.3 Expansion of online learning and edtech platforms
- 3.2.1.4 Proliferation of streaming services and gaming platforms
- 3.2.1.5 Advancements in Wi-Fi 6/6e and 5G connectivity
- 3.2.2 Industry pitfalls and challenges
- 3.2.2.1 Interoperability and device compatibility issues
- 3.2.2.2 Latency, signal interference, and bandwidth limitations
- 3.2.3 Market Opportunities
- 3.2.3.1 Integration with unified communication platforms
- 3.2.3.2 Adoption in smart classrooms and digital learning
- 3.2.3.3 Expansion in automotive infotainment systems
- 3.2.3.4 Cloud-based wireless display for remote work
- 3.2.1 Growth drivers
- 3.3 Growth potential analysis
- 3.4 Regulatory landscape
- 3.4.1 North America
- 3.4.2 Europe
- 3.4.3 Asia Pacific
- 3.4.4 Latin America
- 3.4.5 Middle East & Africa
- 3.5 Porter’s analysis
- 3.6 PESTEL analysis
- 3.7 Technological and Innovation landscape
- 3.7.1 Current technological trends
- 3.7.2 Emerging technologies
- 3.8 Price Trends
- 3.8.1 By region
- 3.8.2 By product
- 3.9 Pricing strategies
- 3.10 Emerging business models
- 3.11 Compliance requirements
- 3.12 Sustainability measures
- 3.13 Consumer sentiment analysis
- 3.14 Patent and IP analysis
- 3.15 Geopolitical and trade dynamics
Chapter 4 Competitive Landscape, 2024
- 4.1 Introduction Company market share analysis
- 4.2 Company market share analysis
- 4.2.1 By region
- 4.2.1. North America
- 4.2.2. Europe
- 4.2.3. Asia Pacific
- 4.2.2 Market concentration analysis
- 4.3 Competitive Benchmarking of key Players
- 4.3.1 Financial Performance Comparison
- 4.3.1.1. Revenue
- 4.3.1.2. Profit Margin
- 4.3.1.3. R&D
- 4.3.2 Product Portfolio Comparison
- 4.3.2.1. Product Range Breadth
- 4.3.2.2. Technology
- 4.3.2.3. Innovation
- 4.3.3 Geographic Presence Comparison
- 4.3.3.1. Global Footprint Analysis
- 4.3.3.2. Service Network Coverage
- 4.3.3.3. Market Penetration by Region
- 4.3.4 Competitive Positioning Matrix
- 4.3.4.1. Leaders
- 4.3.4.2. Challengers
- 4.3.4.3. Followers
- 4.3.4.4. Niche Players
- 4.3.5 Strategic outlook matrix
- 4.3.1 Financial Performance Comparison
- 4.4 Key developments, 2021-2024
- 4.4.1 Mergers and Acquisitions
- 4.4.2 Partnerships and Collaborations
- 4.4.3 Technological Advancements
- 4.4.4 Expansion and Investment Strategies
- 4.4.5 Sustainability Initiatives
- 4.4.6 Digital Transformation Initiatives
- 4.5 Emerging/ Startup Competitors Landscape
Chapter 5 Market Estimates & Forecast, By Component, 2021 - 2034 (USD Billion & Units)
- 5.1 Key trends
- 5.2 Hardware
- 5.2.1 Display devices
- 5.2.1.1 Smart TVs
- 5.2.1.2 Monitors
- 5.2.1.3 Projectors
- 5.2.2 Wireless adapters
- 5.2.3 Transmission & communication modules
- 5.2.4 Antennas
- 5.2.5 Receivers
- 5.2.6 Repeaters
- 5.2.7 Others
- 5.2.1 Display devices
- 5.3 Software
- 5.3.1 Consumer-oriented software
- 5.3.2 Enterprise / collaboration software
- 5.3.3 Content management & media platforms
- 5.3.4 Security & device management software
- 5.3.5 Others
- 5.4 Services
- 5.4.1 Setup & installation
- 5.4.2 Maintenance & support
- 5.4.3 Cloud-based streaming
Chapter 6 Market estimates & forecast, By Resolution, 2021 - 2034 (USD Billion & Units)
- 6.1 Key trends
- 6.2 HD (720p)
- 6.3 Full HD (1080p)
- 6.4 4K Ultra HD
- 6.5 8K and Above
Chapter 7 Market estimates & forecast, By Technology, 2021 - 2034 (USD Billion & Units)
- 7.1 Key trends
- 7.2 WiDi (Intel Wireless Display)
- 7.3 Miracast
- 7.4 AirPlay
- 7.5 Google Cast (Chromecast)
- 7.6 Others
Chapter 8 Market Estimates and Forecast, By End Use Industry, 2021 - 2034 ( USD Billion & Units)
- 8.1 Key trends
- 8.2 Consumer electronics
- 8.2.1 Home entertainment
- 8.2.2 Gaming consoles & PCs
- 8.2.3 Smart speakers
- 8.2.4 Home automation
- 8.2.5 Others
- 8.3 Healthcare
- 8.3.1 Patient monitoring systems
- 8.3.2 Medical imaging display
- 8.3.3 Surgery & operation theaters
- 8.3.4 Training & e-learning
- 8.3.5 Others
- 8.4 Education
- 8.4.1 Online learning
- 8.4.2 Smart campuses
- 8.4.3 Interactive whiteboards & projectors
- 8.4.4 Educational content streaming
- 8.4.5 Others
- 8.5 Government & defense
- 8.5.1 Command & control centers
- 8.5.2 Public sector offices & administration
- 8.5.3 Surveillance & monitoring displays
- 8.5.4 Military training & simulation
- 8.5.5 Others
- 8.6 Media & entertainment
- 8.6.1 Broadcasting
- 8.6.2 Post-production & editing suites
- 8.6.3 Cinema & theater digital projection
- 8.6.4 Event & concert visual displays
- 8.6.5 Others
- 8.7 Retail
- 8.7.1 Digital signage & advertising
- 8.7.2 Interactive kiosks & in-store displays
- 8.7.3 Point of Sale (POS) systems
- 8.7.4 Others
- 8.8 Industrial / enterprise
- 8.8.1 Control rooms
- 8.8.2 Video conferencing
- 8.8.3 Factory floor monitoring
- 8.8.4 Training & onboarding displays
- 8.8.5 Others
- 8.9 Others
Chapter 9 Market Estimates and Forecast, By Region, 2021 - 2034 (USD Billion & Units)
- 9.1 Key trends
- 9.2 North America
- 9.2.1 U.S.
- 9.2.2 Canada
- 9.3 Europe
- 9.3.1 Germany
- 9.3.2 U.K.
- 9.3.3 France
- 9.3.4 Italy
- 9.3.5 Spain
- 9.3.6 Netherlands
- 9.3.7 Rest of Europe
- 9.4 Asia Pacific
- 9.4.1 China
- 9.4.2 India
- 9.4.3 Japan
- 9.4.4 South Korea
- 9.4.5 Australia
- 9.4.6 Rest of Asia Pacific
- 9.5 Latin America
- 9.5.1 Brazil
- 9.5.2 Mexico
- 9.5.3 Argentina
- 9.5.4 Rest of Latin America
- 9.6 Middle East & Africa
- 9.6.1 UAE
- 9.6.2 Saudi Arabia
- 9.6.3 South Africa
- 9.6.4 Rest of MEA
Chapter 10 Company Profile
- 10.1 Global Players:
- 10.1.1 Amazon.com, Inc.
- 10.1.2 Apple Inc.
- 10.1.3 Barco NV
- 10.1.4 Dell Technologies Inc.
- 10.1.5 Google LLC
- 10.1.6 HP Inc.
- 10.1.7 Intel Corporation
- 10.1.8 Lenovo Group Limited
- 10.1.9 LG Electronics Inc.
- 10.1.10 Microsoft Corporation
- 10.1.11 Panasonic Corporation
- 10.1.12 Samsung Electronics Co., Ltd.
- 10.1.13 Sharp Corporation
- 10.2 Regional Players:
- 10.2.1 Belkin International, Inc.
- 10.2.2 Epson America, Inc.
- 10.2.3 Netgear Inc.
- 10.2.4 Vanco International, LLC
- 10.3 Emerging Players:
- 10.3.1 Actiontec Electronics, Inc.
- 10.3.2 Airtame ApS
- 10.3.3 BenQ Corporation
- 10.3.4 ScreenBeam Inc.
 无线显示市场:按组件、连接方式、应用、显示技术和最终用户划分-2026-2032年全球市场预测
 全球无线显示市场规模、份额、趋势和成长分析报告(2026-2034年)
 2026年全球无线显示市场报告
 无线显示市场规模、份额及成长分析(按组件、技术、最终用户和地区划分)-2026-2033年产业预测
 无线显示市场-全球产业规模、份额、趋势、机会和预测,依技术类型、显示类型、最终用户、地区和竞争格局划分,2020-2030年预测
 全球无线显示市场:市场规模、市场份额、趋势分析(按内容、应用、技术和地区)、展望和未来预测(2024-2031 年)
 无线显示市场规模、份额和趋势分析报告:按产品、按技术、按最终用途、按地区、细分市场预测,2024-2030 年无线显示器市场:各技术,各用途,各提供,各地区,2024年~2031年