


 |
市场调查报告书
商品编码
1844252
立方体卫星市场机会、成长动力、产业趋势分析及 2025 - 2034 年预测CubeSat Market Opportunity, Growth Drivers, Industry Trend Analysis, and Forecast 2025 - 2034 |
||||||
2024 年全球立方体卫星市场价值为 4.504 亿美元,预计到 2034 年将以 14.3% 的复合年增长率增长至 17 亿美元。
对地球观测资料的需求、物联网和全球互联互通的快速扩张以及微型化技术的进步是推动这一市场发展的关键因素。政府和商业部门对太空技术的投资不断增加,也在加速立方体卫星的发展方面发挥重要作用,使得以通讯、地球监测、科学探索和教育为重点的任务更加频繁。卫星星座的兴起进一步推动了对低成本、灵活的立方体卫星解决方案的需求,使其在全球互联互通和物联网应用中具有极高的价值。随着海量资料传输需求的不断增长,立方体卫星正成为满足现代世界通讯和遥感需求不可或缺的一部分。
| 市场范围 | |
|---|---|
| 起始年份 | 2024 |
| 预测年份 | 2025-2034 |
| 起始值 | 4.504亿美元 |
| 预测值 | 17亿美元 |
| 复合年增长率 | 14.3% |
2024年,硬体市场规模达3.138亿美元,这得益于对微型组件日益增长的需求,以及立方体卫星在通讯、地球观测和科学研究中的应用。卫星设计的技术进步,包括耐用性的提升以及人工智慧和物联网的融合,预计将继续塑造硬体市场。为了保持竞争力,製造商需要专注于降低成本、提高耐用性并整合尖端技术,以适应市场的快速发展。
2024年,1-3U立方体卫星市场价值1.559亿美元。该市场因其紧凑的尺寸、高性价比的有效载荷发射以及能够搭载更小但先进的传感器技术,广泛应用于地球观测、通讯和科学应用。鼓励製造商优先开发高效能微型感测器,提高功率效率,同时确保这些系统耐用且可客製化,以便在1-3U市场快速部署。
2024年,美国立方体卫星市场规模达1.668亿美元,这得益于大量创投和私募股权融资,促进了立方体卫星技术的创新。政府部门与私营部门之间的密切合作,加上强大的航太发射基础设施,将推动该市场进一步扩张。美国製造商应致力于加强与政府机构的合作,探索创投机会,并开发具有成本效益的立方体卫星技术,以充分利用美国先进的发射能力,满足日益增长的商业和研究驱动型任务需求。
一些知名公司引领全球立方体卫星产业,包括 AAC Clyde Space、CU 航太、Dragonfly 航太、EnduroSat、EXOLAUNCH GmbH、GomSpace、ISISPACE GROUP、洛克希德马丁、Maverick Space Systems Inc.、NanoAvionics、诺斯罗普格鲁曼塔、ASpace/SpaceS Space. Ltd 和 Tyvak International。
全球立方体卫星市场中的企业为巩固其市场地位所采取的关键策略包括:专注于透过规模经济降低生产成本,并提高卫星零件的耐用性。企业也强调模组化立方体卫星平台的开发,以便快速且灵活地客製化,满足客户的不同需求。此外,企业正在整合人工智慧、物联网 (IoT) 和微型感测器等先进技术,以满足不断变化的客户需求。与政府机构和私人投资者建立牢固的合作伙伴关係,以及在卫星发射基础设施方面的合作,对于在这个不断增长的市场中保持竞争优势也至关重要。
目录
第一章:方法论与范围
第 2 章:执行摘要
第三章:行业洞察
- 产业生态系统分析
- 供应商概况
- 利润率
- 成本结构
- 每个阶段的增值
- 影响价值链的因素
- 中断
- 产业衝击力
- 成长动力
- 对地球观测资料的需求不断增长
- 物联网和全球连接的扩展
- 小型化技术进步
- 政府和商业对太空的投资增加
- 卫星星座的使用日益增多
- 产业陷阱与挑战
- 空间垃圾和监管挑战
- 耐用性有限导致频繁更换
- 市场机会
- 新兴太空旅游与探索任务
- 在轨服务和碎片清除技术的发展
- 成长动力
- 成长潜力分析
- 监管格局
- 北美洲
- 欧洲
- 亚太地区
- 拉丁美洲
- 中东和非洲
- 波特的分析
- PESTEL分析
- 技术和创新格局
- 当前的技术趋势
- 新兴技术
- 新兴商业模式
- 合规性要求
- 国防预算分析
- 全球国防开支趋势
- 区域国防预算分配
- 北美洲
- 欧洲
- 亚太地区
- 中东和非洲
- 拉丁美洲
- 重点国防现代化项目
- 预算预测(2025-2034)
- 对产业成长的影响
- 各国国防预算
- 供应链弹性
- 地缘政治分析
- 劳动力分析
- 数位转型
- 合併、收购和策略伙伴关係格局
- 风险评估与管理
- 主要合约授予(2021-2024)
第四章:竞争格局
- 介绍
- 公司市占率分析
- 按地区
- 北美洲
- 欧洲
- 亚太地区
- 拉丁美洲
- 中东和非洲
- 市场集中度分析
- 按地区
- 关键参与者的竞争基准
- 财务绩效比较
- 收入
- 利润率
- 研发
- 产品组合比较
- 产品范围广度
- 科技
- 创新
- 地理位置比较
- 全球足迹分析
- 服务网路覆盖
- 各地区市场渗透率
- 竞争定位矩阵
- 领导者
- 挑战者
- 追踪者
- 利基市场参与者
- 战略展望矩阵
- 财务绩效比较
- 2021-2024 年关键发展
- 併购
- 伙伴关係与合作
- 技术进步
- 扩张和投资策略
- 永续发展倡议
- 数位转型倡议
- 新兴/新创企业竞争对手格局
第五章:市场估计与预测:按规模,2021 - 2034
- 主要趋势
- 0.25U至1U
- 1到3U
- 3U至6U
- 6U至12U
- 12U以上
第六章:市场估计与预测:按组件,2021 - 2034
- 主要趋势
- 硬体
- 有效载荷
- 结构
- 电力系统(EPS)
- 姿态确定与控制系统(ADCS)
- 推进系统
- 通讯系统
- 其他的
- 软体
- 飞行软体
- 地面控制软体
- 资料处理和 AI/ML 解决方案
- 服务
- 整合与测试
- 发射服务
- 任务行动和地面支持
第七章:市场估计与预测:按应用,2021 - 2034
- 主要趋势
- 地球观测与遥感
- 通讯和资料中继
- 科学研究与探索
- 太空观测
- 军事和国防应用
- 其他的
第八章:市场估计与预测:依最终用途,2021 - 2034 年
- 商业的
- 电信公司
- 地球观测与遥感公司
- 新空间新创公司
- 其他的
- 政府和军队
- 其他的
第九章:市场估计与预测:按地区,2021 - 2034
- 主要趋势
- 北美洲
- 我们
- 加拿大
- 欧洲
- 德国
- 英国
- 法国
- 西班牙
- 义大利
- 荷兰
- 亚太地区
- 中国
- 印度
- 日本
- 澳洲
- 韩国
- 拉丁美洲
- 巴西
- 墨西哥
- 阿根廷
- 中东和非洲
- 沙乌地阿拉伯
- 南非
- 阿联酋
第十章:公司简介
- 全球关键参与者
- Lockheed Martin
- Northrop Grumman
- RTX Corporation
- SpaceX
- 区域关键参与者
- 北美洲
- Maverick Space Systems Inc.
- Pumpkin Space Systems
- 欧洲
- AAC Clyde Space
- EnduroSat
- EXOLAUNCH GmbH
- GomSpace
- ISISPACE GROUP
- NanoAvionics
- Space Inventor A/S
- Surrey Satellite Technology Ltd
- Tyvak International
- Asia-Pacific
- CU Aerospace
- 北美洲
- 颠覆者/利基市场参与者
- Dragonfly Aerospace.
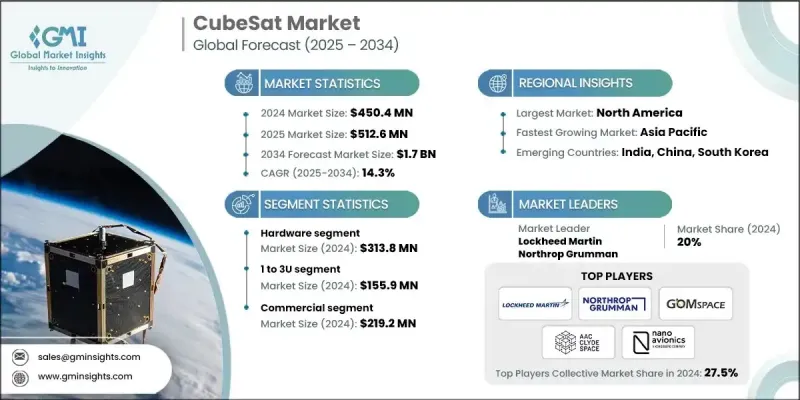
The Global CubeSat Market was valued at USD 450.4 million in 2024 and is estimated to grow at a CAGR of 14.3% to reach USD 1.7 billion by 2034.
The demand for Earth observation data, the rapid expansion of IoT and global connectivity, and advancements in miniaturization are key factors driving this market. Increased government and commercial investments in space technologies are also playing a significant role in accelerating CubeSat development, leading to more frequent missions focused on communication, Earth monitoring, scientific exploration, and educational purposes. The rise in satellite constellations is further boosting the need for low-cost, flexible CubeSat solutions, making them highly valuable for global connectivity and IoT applications. With the growing need for massive data transmission, CubeSats are becoming integral to meeting the communication and remote sensing needs of the modern world.
| Market Scope | |
|---|---|
| Start Year | 2024 |
| Forecast Year | 2025-2034 |
| Start Value | $450.4 million |
| Forecast Value | $1.7 billion |
| CAGR | 14.3% |
The hardware segment was valued at USD 313.8 million in 2024, driven by the increasing demand for miniaturized components and the adoption of CubeSats for communication, Earth observation, and scientific research. Technological advancements in satellite design, including increased durability and the integration of AI and IoT, are expected to continue shaping the hardware segment. To remain competitive, manufacturers need to focus on reducing costs, improving durability, and integrating cutting-edge technologies to align with the market's rapid evolution.
In 2024, the 1-3U CubeSat segment was valued at USD 155.9 million. This segment is widely utilized for Earth observation, communication, and scientific applications due to its compact size, cost-effectiveness in launching payloads, and capability to carry smaller but advanced sensor technologies. Manufacturers are encouraged to prioritize developing highly efficient, miniaturized sensors and increasing power efficiency while ensuring these systems are durable and customizable for swift deployment in the 1 to 3U segment.
U.S. CubeSat Market was valued at USD 166.8 million in 2024, fueled by substantial venture capital and private equity funding, fostering innovation in CubeSat technology. Strong collaboration between government entities and the private sector, along with a robust space launch infrastructure, enables further expansion. U.S.-based manufacturers should focus on strengthening partnerships with government agencies, exploring venture capital opportunities, and developing cost-effective CubeSat technologies to leverage the nation's advanced launch capabilities and cater to the growing demand for commercial and research-driven missions.
Several prominent companies are leading the Global CubeSat industry, including AAC Clyde Space, CU Aerospace, Dragonfly Aerospace, EnduroSat, EXOLAUNCH GmbH, GomSpace, ISISPACE GROUP, Lockheed Martin, Maverick Space Systems Inc., NanoAvionics, Northrop Grumman, Pumpkin Space Systems, RTX Corporation, Space Inventor A/S, SpaceX, Surrey Satellite Technology Ltd, and Tyvak International.
Key strategies adopted by companies in the Global CubeSat market to strengthen their market position include focusing on reducing production costs through economies of scale and enhancing the durability of satellite components. Companies are also emphasizing the development of modular CubeSat platforms, allowing for quick and flexible customization to meet the varying needs of clients. Additionally, companies are integrating advanced technologies such as artificial intelligence, Internet of Things (IoT), and miniaturized sensors to keep pace with evolving customer requirements. Strong partnerships with government agencies and private investors, along with collaboration in satellite launch infrastructure, are also vital to maintaining a competitive edge in this growing market.
Table of Contents
Chapter 1 Methodology and Scope
- 1.1 Market scope and definition
- 1.2 Research design
- 1.2.1 Research approach
- 1.2.2 Data collection methods
- 1.3 Data mining sources
- 1.3.1 Global
- 1.3.2 Regional/Country
- 1.4 Base estimates and calculations
- 1.4.1 Base year calculation
- 1.4.2 Key trends for market estimation
- 1.5 Primary research and validation
- 1.5.1 Primary sources
- 1.6 Forecast model
- 1.7 Research assumptions and limitations
Chapter 2 Executive Summary
- 2.1 Industry snapshot
- 2.2 Key market trends
- 2.2.1 Size trends
- 2.2.2 Component trends
- 2.2.3 Application trends
- 2.2.4 End use trends
- 2.2.5 Regional
- 2.3 TAM Analysis, 2025-2034 (USD Million)
- 2.4 CXO perspectives: Strategic imperatives
- 2.4.1 Executive decision points
- 2.4.2 critical success factors
- 2.5 Future outlook and strategic recommendations
Chapter 3 Industry Insights
- 3.1 Industry ecosystem analysis
- 3.1.1 Supplier Landscape
- 3.1.2 Profit Margin
- 3.1.3 Cost structure
- 3.1.4 Value addition at each stage
- 3.1.5 Factor affecting the value chain
- 3.1.6 Disruptions
- 3.2 Industry impact forces
- 3.2.1 Growth drivers
- 3.2.1.1 Growing demand for earth observation data
- 3.2.1.2 Expansion of IoT and global connectivity
- 3.2.1.3 Technological advancements in miniaturization
- 3.2.1.4 Increased government and commercial investments in space
- 3.2.1.5 Rising use of satellite constellations
- 3.2.2 Industry pitfalls and challenges
- 3.2.2.1 Space debris and regulatory challenges
- 3.2.2.2 Limited durability leads to frequent replacements
- 3.2.3 Market opportunities
- 3.2.3.1 Emerging space tourism and exploration missions
- 3.2.3.2 Development of in-orbit servicing and debris removal
- 3.2.1 Growth drivers
- 3.3 Growth potential analysis
- 3.4 Regulatory landscape
- 3.4.1 North America
- 3.4.2 Europe
- 3.4.3 Asia Pacific
- 3.4.4 Latin America
- 3.4.5 Middle East & Africa
- 3.5 Porter’s analysis
- 3.6 PESTEL analysis
- 3.7 Technology and innovation landscape
- 3.7.1 Current technological trends
- 3.7.2 Emerging technologies
- 3.8 Emerging business models
- 3.9 Compliance requirements
- 3.10 Defense budget analysis
- 3.11 Global defense spending trends
- 3.12 Regional defense budget allocation
- 3.12.1 North America
- 3.12.2 Europe
- 3.12.3 Asia Pacific
- 3.12.4 Middle East and Africa
- 3.12.5 Latin America
- 3.13 Key defense modernization programs
- 3.14 Budget forecast (2025-2034)
- 3.14.1 Impact on Industry Growth
- 3.14.2 Defense Budgets by Country
- 3.15 Supply chain resilience
- 3.16 Geopolitical analysis
- 3.17 Workforce analysis
- 3.18 Digital transformation
- 3.19 Mergers, acquisitions, and strategic partnerships landscape
- 3.20 Risk assessment and management
- 3.21 Major contract awards (2021-2024)
Chapter 4 Competitive Landscape, 2024
- 4.1 Introduction
- 4.2 Company market share analysis
- 4.2.1 By region
- 4.2.1.1 North America
- 4.2.1.2 Europe
- 4.2.1.3 Asia Pacific
- 4.2.1.4 Latin America
- 4.2.1.5 Middle East & Africa
- 4.2.2 Market Concentration Analysis
- 4.2.1 By region
- 4.3 Competitive benchmarking of key players
- 4.3.1 Financial performance comparison
- 4.3.1.1 Revenue
- 4.3.1.2 Profit margin
- 4.3.1.3 R&D
- 4.3.2 Product portfolio comparison
- 4.3.2.1 Product range breadth
- 4.3.2.2 Technology
- 4.3.2.3 Innovation
- 4.3.3 Geographic presence comparison
- 4.3.3.1 Global footprint analysis
- 4.3.3.2 Service network coverage
- 4.3.3.3 Market penetration by region
- 4.3.4 Competitive positioning matrix
- 4.3.4.1 Leaders
- 4.3.4.2 Challengers
- 4.3.4.3 Followers
- 4.3.4.4 Niche players
- 4.3.5 Strategic outlook matrix
- 4.3.1 Financial performance comparison
- 4.4 Key developments, 2021-2024
- 4.4.1 Mergers and acquisitions
- 4.4.2 Partnerships and collaborations
- 4.4.3 Technological advancements
- 4.4.4 Expansion and investment strategies
- 4.4.5 Sustainability initiatives
- 4.4.6 Digital transformation initiatives
- 4.5 Emerging/ startup competitors landscape
Chapter 5 Market Estimates and Forecast, By Size, 2021 - 2034 (USD Million)
- 5.1 Key trends
- 5.2 0.25U to 1U
- 5.3 1 to 3U
- 5.4 3U to 6U
- 5.5 6U to 12U
- 5.6 12U and above
Chapter 6 Market Estimates and Forecast, By Component, 2021 - 2034 (USD Million)
- 6.1 Key trends
- 6.2 Hardware
- 6.2.1 Payloads
- 6.2.2 Structure
- 6.2.3 Electrical power systems (EPS)
- 6.2.4 Attitude determination & control systems (ADCS)
- 6.2.5 Propulsion systems
- 6.2.6 Communication systems
- 6.2.7 Others
- 6.3 Software
- 6.3.1 Flight software
- 6.3.2 Ground control software
- 6.3.3 Data processing & AI/ML solutions
- 6.4 Services
- 6.4.1 Integration & testing
- 6.4.2 Launch services
- 6.4.3 Mission operations & ground support
Chapter 7 Market Estimates and Forecast, By Application, 2021 - 2034 (USD Million)
- 7.1 Key trends
- 7.2 Earth observation & remote sensing
- 7.3 Communication & data relay
- 7.4 Scientific research & exploration
- 7.5 Space observation
- 7.6 Military & defense applications
- 7.7 Others
Chapter 8 Market Estimates and Forecast, By End Use, 2021 - 2034 (USD Million)
- 8.1 Commercial
- 8.1.1 Telecommunication companies
- 8.1.2 Earth observation & remote sensing companies
- 8.1.3 Newspace startups
- 8.1.4 Others
- 8.2 Government and military
- 8.3 Others
Chapter 9 Market Estimates and Forecast, By Region, 2021 - 2034 (USD Million)
- 9.1 Key trends
- 9.2 North America
- 9.2.1 U.S.
- 9.2.2 Canada
- 9.3 Europe
- 9.3.1 Germany
- 9.3.2 Uk
- 9.3.3 France
- 9.3.4 Spain
- 9.3.5 Italy
- 9.3.6 Netherlands
- 9.4 Asia Pacific
- 9.4.1 China
- 9.4.2 India
- 9.4.3 Japan
- 9.4.4 Australia
- 9.4.5 South Korea
- 9.5 Latin America
- 9.5.1 Brazil
- 9.5.2 Mexico
- 9.5.3 Argentina
- 9.6 Middle East and Africa
- 9.6.1 Saudi Arabia
- 9.6.2 South Africa
- 9.6.3 UAE
Chapter 10 Company profiles
- 10.1 Global Key Players
- 10.1.1 Lockheed Martin
- 10.1.2 Northrop Grumman
- 10.1.3 RTX Corporation
- 10.1.4 SpaceX
- 10.2 Regional Key Players
- 10.2.1 North America
- 10.2.1.1 Maverick Space Systems Inc.
- 10.2.1.2 Pumpkin Space Systems
- 10.2.2 Europe
- 10.2.2.1 AAC Clyde Space
- 10.2.2.2 EnduroSat
- 10.2.2.3 EXOLAUNCH GmbH
- 10.2.2.4 GomSpace
- 10.2.2.5 ISISPACE GROUP
- 10.2.2.6 NanoAvionics
- 10.2.2.7 Space Inventor A/S
- 10.2.2.8 Surrey Satellite Technology Ltd
- 10.2.2.9 Tyvak International
- 10.2.3 Asia-Pacific
- 10.2.3.1 CU Aerospace
- 10.2.1 North America
- 10.3 Disruptors / Niche Players
- 10.3.1 Dragonfly Aerospace.
 2026 年立方卫星全球市场报告
 立方卫星市场:2026-2032年全球市场预测(依平台配置、飞行器尺寸、轨道、推进系统、应用程式和最终用户划分)
 立方体卫星市场:依类型、应用、最终用户和轨道类型划分 - 全球预测至 2036 年
 立方卫星市场规模、份额和成长分析(按尺寸、子系统、应用、最终用户和地区划分)—2026-2033年产业预测
 立方体卫星市场规模、占有率、成长及全球产业分析:按类型、应用和地区划分的洞察与预测(2024-2032 年)
 立方卫星市场规模、份额和趋势分析报告:按规模、应用、子系统、最终用途、地区和细分市场预测,2025 年至 2033 年
 立方卫星市场,规模,占有率,趋势,产业分析报告:子系统,各尺寸,各用途,各终端用户,各地区-2025~2034年市场预测全球立方体卫星市场:依规模、应用、子系统、最终用户和地区进行预测(截至 2030 年)