


 |
市场调查报告书
商品编码
1844302
认知代理市场机会、成长动力、产业趋势分析及 2025 - 2034 年预测Cognitive Agent Market Opportunity, Growth Drivers, Industry Trend Analysis, and Forecast 2025 - 2034 |
||||||
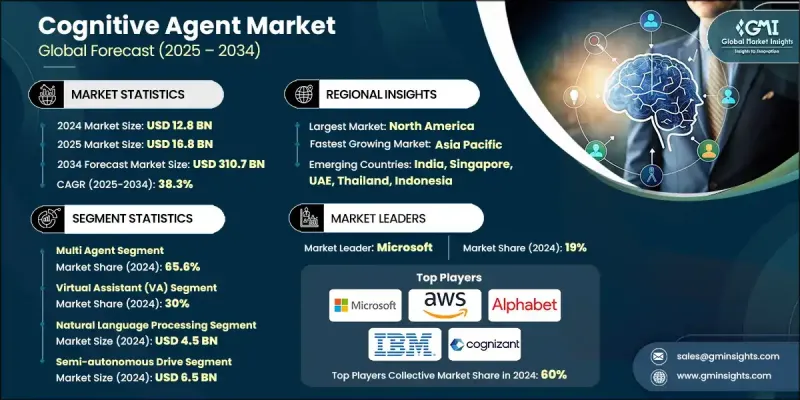
2024 年全球认知代理市场价值为 128 亿美元,预计到 2034 年将以 38.3% 的复合年增长率增长至 3107 亿美元。
认知代理的需求正受到企业推动,这些企业希望增强决策能力、实现客户互动自动化并提升营运效率。这些先进的系统超越了传统的虚拟助手,利用尖端技术理解情境、学习过往经验,并独立或在极少人工干预的情况下执行任务。商业、金融服务、保险、医疗保健、零售、製造、政府和教育等行业正在采用认知代理来支援客户服务、诈欺检测、供应链优化和劳动力管理等功能。随着企业和政府适应远距办公和客户服务需求,全球疫情加速了包括认知代理在内的人工智慧解决方案的采用。 2019-2020年期间,人工智慧相关投资大幅成长了40%,标誌着企业正转向人工智慧驱动的解决方案,以在疫情期间维持营运并为客户提供优质服务。
| 市场范围 | |
|---|---|
| 起始年份 | 2024 |
| 预测年份 | 2025-2034 |
| 起始值 | 128亿美元 |
| 预测值 | 3107亿美元 |
| 复合年增长率 | 38.3% |
多智能体领域在2024年占了65.6%的份额,预计2025年至2034年的复合年增长率将达到37.1%。该领域的蓬勃发展得益于其能够协调多个人工智慧系统,以协作的方式解决任务。多智能体系统可以互动、共享资料,并增强决策能力以优化效能,使其成为管理科技、金融和物流等行业大规模动态营运的理想选择。
虚拟助理领域在 2024 年占据了 30% 的份额,预计将快速成长,2025 年至 2034 年的复合年增长率为 35.5%。这些助手越来越受欢迎,因为它们可以改善客户互动并提供无缝的用户体验,提供可处理数百万用户的可扩展性,同时整合到更广泛的数位生态系统中。
2024年,美国认知代理市场规模达44亿美元。凭藉先进的技术基础设施和广泛的企业应用,美国继续在全球认知代理市场占据主导地位。诸如「国家人工智慧计画」等政府支持措施促进了人工智慧技术的发展,鼓励成熟的科技公司和新创公司投资各行各业的认知代理解决方案。
全球认知代理市场的主要参与者包括 IBM、微软、OpenAI、Salesforce、Cognizant、甲骨文、NVIDIA、Google、埃森哲和亚马逊网路服务。认知代理市场中的公司正在采取各种策略来扩大其市场份额。这些措施包括策略合作伙伴关係、合併和收购,以增强技术产品并扩大市场覆盖范围。一些公司也大力投资研发,以改善其认知代理的功能,使其能够提供更复杂的决策、自动化客户服务和流程优化功能。此外,公司正专注于将认知代理整合到现有的业务工作流程中,以便为各行各业的客户提供附加价值。
目录
第一章:方法论与范围
第二章:执行摘要
第三章:行业洞察
- 产业生态系统分析
- 供应商格局
- 云端服务供应商
- 人工智慧平台提供商
- 系统整合商
- 硬体和基础设施供应商
- 安全与治理解决方案提供商
- 产业特定AI解决方案提供商
- 成本结构
- 利润率
- 每个阶段的增值
- 影响供应链的因素
- 破坏者
- 供应商格局
- 对部队的影响
- 成长动力
- 越来越多的企业采用人工智慧虚拟助手
- 对生成式人工智慧、机器学习和 NLP 技术的投资不断增加
- 各行各业对自动化的需求不断成长
- 扩展云端基础设施和人工智慧即服务产品
- 产业陷阱与挑战
- 资料隐私、网路安全和监管问题
- 与传统 IT 系统的整合复杂性高
- 市场机会
- 人工智慧技术提供者与产业特定参与者之间的合作
- 多智能体系统与完全自主认知智能体的开发
- 成长动力
- 技术趋势与创新生态系统
- 现有技术
- 大型语言模型演化
- 多模式人工智慧集成
- 强化学习的进步
- 神经架构搜寻
- 新兴技术
- 代理的联邦学习
- 边缘人工智慧与分散式运算
- 量子计算集成
- 脑机介面开发
- 现有技术
- 成长潜力分析
- 监管格局
- NIST人工智慧风险管理框架
- 欧盟人工智慧合规要求
- GDPR资料保护影响
- 特定行业的人工智慧法规
- 国际人工智慧治理标准
- 道德人工智慧发展指南
- 成本分解分析
- 开发和培训成本
- 基础设施和计算费用
- 整合和客製化成本
- 持续维护和更新
- 合规与治理成本
- 波特的分析
- PESTEL分析
- 专利分析
- 永续性和环境方面
- 环境影响评估与生命週期分析
- 社会影响力和社区关係
- 治理与企业责任
- 永续技术发展
- 用例
- AI模型与演算法分析
- 基础模型景观
- 微调和客製化方法
- 模型性能基准测试
- 训练资料要求
- 电脑资源最佳化
- 投资格局分析
- 认知人工智慧的创投
- 企业投资与收购活动
- 政府资助人工智慧研究
- 学术研究投资
- 客户行为分析
- 企业采用决策因素
- 用例优先模式
- 供应商评估标准
- 实施方法偏好
- 性能和品质标准
- 代理响应准确度指标
- 处理速度和延迟要求
- 可扩充性和吞吐量基准
- 可靠性和可用性标准
- 风险评估框架
- 人工智慧模型偏见和公平风险
- 资料隐私和安全风险
- 监理合规风险
- 技术过时的风险
- 道德人工智慧与负责任的发展
- 人工智慧伦理框架实施
- 偏见检测和缓解策略
- 公平与包容性考虑
- 透明度和可解释性要求
第四章:竞争格局
- 介绍
- 公司市占率分析
- 北美洲
- 欧洲
- 亚太地区
- 拉丁美洲
- 中东和非洲
- 竞争定位矩阵
- 战略展望矩阵
- 关键进展
- 併购
- 伙伴关係与合作
- 新产品发布
- 扩张计划和资金
第五章:市场估计与预测:按代理商,2021 - 2034 年
- 主要趋势
- 虚拟助理(VA)
- 对话式客户代理
- 数位工作者
- 决策支持
- 其他的
第六章:市场估计与预测:按系统,2021 - 2034
- 主要趋势
- 单一代理
- 多代理
第七章:市场估计与预测:依自主水平,2021 - 2034 年
- 主要趋势
- 半自主
- 完全自主
- 辅助(人机互动)
第八章:市场估计与预测:依技术分类,2021 - 2034 年
- 主要趋势
- 机器学习(ML)
- 自然语言处理
- 电脑视觉
- 机器人流程自动化(RPA)
- 认知运算
- 其他的
第九章:市场估计与预测:依最终用途,2021 - 2034
- 主要趋势
- 银行、金融服务和保险(BFSI)
- 医疗保健与生命科学
- 零售与电子商务
- 媒体与娱乐
- 製造业
- 政府和公共部门
- 教育
- 运输与物流
- 能源与公用事业
- 其他的
第 10 章:市场估计与预测:按地区,2021 年至 2034 年
- 北美洲
- 我们
- 加拿大
- 欧洲
- 英国
- 德国
- 法国
- 义大利
- 西班牙
- 比利时
- 荷兰
- 瑞典
- 亚太地区
- 中国
- 印度
- 日本
- 澳洲
- 新加坡
- 韩国
- 越南
- 印尼
- 拉丁美洲
- 巴西
- 墨西哥
- 阿根廷
- 多边环境协定
- 南非
- 沙乌地阿拉伯
- 阿联酋
第 11 章:公司简介
- 全球参与者
- OpenAI
- Microsoft
- Amazon Web Services
- IBM
- Anthropic
- Salesforce
- Meta Platforms
- NVIDIA
- Oracle
- 区域参与者
- UiPath
- Automation Anywhere
- ServiceNow
- Baidu
- Alibaba Cloud
- Tencent
- SAP
- Palantir Technologies
- DataRobot
- H2O.ai
- 新兴企业
- Cohere
- Stability AI
- Hugging Face
- Adept AI
- Character.AI
- Jasper AI
- Copy.ai
- Rasa
- Moveworks
- Avanade
The Global Cognitive Agent Market was valued at USD 12.8 billion in 2024 and is estimated to grow at a CAGR of 38.3% to reach USD 310.7 billion by 2034.
The demand for cognitive agents is being driven by organizations looking to enhance decision-making, automate customer interactions, and increase operational efficiency. These advanced systems move beyond traditional virtual assistants, leveraging cutting-edge technologies to understand context, learn from past experiences, and perform tasks either independently or with minimal human input. Industries such as BFSI, healthcare, retail, manufacturing, government, and education are adopting cognitive agents to support functions like customer service, fraud detection, supply chain optimization, and workforce management. The global pandemic accelerated the adoption of AI solutions, including cognitive agents, as companies and governments adjusted to remote work and customer service demands. During 2019-2020, AI-related investments saw a significant 40% increase, signaling a shift towards AI-driven solutions to sustain operations and service customers amid disruptions.
| Market Scope | |
|---|---|
| Start Year | 2024 |
| Forecast Year | 2025-2034 |
| Start Value | $12.8 Billion |
| Forecast Value | $310.7 Billion |
| CAGR | 38.3% |
The multi-agent segment held a 65.6% share in 2024 and is projected to grow at a CAGR of 37.1% from 2025 to 2034. This segment thrives due to its ability to coordinate with multiple AI systems to solve tasks in a collaborative manner. Multi-agent systems can interact, share data, and enhance decision-making to optimize performance, making them ideal for managing large-scale, dynamic operations in industries like technology, finance, and logistics.
The virtual assistant segment held a 30% share in 2024 and is expected to grow rapidly, at a CAGR of 35.5% from 2025 to 2034. These assistants are becoming increasingly popular for improving customer interactions and providing seamless user experiences, offering scalability that can handle millions of users while integrating into broader digital ecosystems.
U.S. Cognitive Agent Market generated USD 4.4 billion in 2024. With its advanced technological infrastructure and substantial enterprise adoption, the U.S. continues to dominate the global cognitive agent market. Government support, like the National AI Initiative, fosters the development of AI technologies, encouraging both established tech companies and startups to invest in cognitive agent solutions across various industries.
Major players in the Global Cognitive Agent Market include IBM, Microsoft, OpenAI, Salesforce, Cognizant, Oracle, NVIDIA, Google, Accenture, and Amazon Web Services. Companies in the cognitive agent market are adopting a variety of strategies to expand their market presence. These include strategic partnerships, mergers, and acquisitions to enhance technology offerings and improve market reach. Some companies are also heavily investing in R&D to improve the functionality of their cognitive agents, enabling them to offer more sophisticated decision-making, automated customer service, and process optimization capabilities. Additionally, companies are focusing on the integration of cognitive agents into existing business workflows to provide added value for customers across industries.
Table of Contents
Chapter 1 Methodology & Scope
- 1.1 Market scope and definition
- 1.2 Research design
- 1.2.1 Research approach
- 1.2.2 Data collection methods
- 1.3 Data mining sources
- 1.3.1 Global
- 1.3.2 Regional/Country
- 1.4 Base estimates and calculations
- 1.4.1 Base year calculation
- 1.4.2 Key trends for market estimation
- 1.5 Primary research and validation
- 1.5.1 Primary sources
- 1.6 Forecast model
- 1.6.1.1 Research assumptions and limitations
Chapter 2 Executive Summary
- 2.1 Industry 360° synopsis
- 2.2 Key market trends
- 2.2.1 Regional
- 2.2.2 Agent
- 2.2.3 System
- 2.2.4 Autonomy Level
- 2.2.5 Technology
- 2.2.6 End use
- 2.3 TAM Analysis, 2025-2034
- 2.4 CXO perspectives: Strategic imperatives
- 2.4.1 Key decision points for industry executives
- 2.4.2 Critical success factors for market players
- 2.5 Future outlook and strategic recommendations
Chapter 3 Industry Insights
- 3.1 Industry ecosystem analysis
- 3.1.1 Supplier landscape
- 3.1.1.1 Cloud service providers
- 3.1.1.2 AI platform providers
- 3.1.1.3 System integrators
- 3.1.1.4 Hardware & infrastructure providers
- 3.1.1.5 Security & governance solution providers
- 3.1.1.6 Industry-specific AI solution providers
- 3.1.2 Cost structure
- 3.1.3 Profit margin
- 3.1.4 Value addition at each stage
- 3.1.5 Factors impacting the supply chain
- 3.1.6 Disruptors
- 3.1.1 Supplier landscape
- 3.2 Impact on forces
- 3.2.1 Growth drivers
- 3.2.1.1 Increasing enterprise adoption of AI-powered virtual assistants
- 3.2.1.2 Rising investments in generative AI, machine learning, and NLP technologies
- 3.2.1.3 Growing demand for automation across industries
- 3.2.1.4 Expansion of cloud infrastructure and AI-as-a-Service offerings
- 3.2.2 Industry pitfalls & challenges
- 3.2.2.1 Data privacy, cybersecurity, and regulatory concerns
- 3.2.2.2 High integration complexity with legacy IT systems
- 3.2.3 Market opportunities
- 3.2.3.1 Collaboration between AI tech providers and industry-specific players
- 3.2.3.2 Development of multi-agent systems and fully autonomous cognitive agents
- 3.2.1 Growth drivers
- 3.3 Technology trends & innovation ecosystem
- 3.3.1 Current technologies
- 3.3.1.1 Large language model evolution
- 3.3.1.2 Multi-modal AI integration
- 3.3.1.3 Reinforcement learning advances
- 3.3.1.4 Neural architecture search
- 3.3.2 Emerging technologies
- 3.3.2.1 Federated learning for agents
- 3.3.2.2 Edge AI & distributed computing
- 3.3.2.3 Quantum computing integration
- 3.3.2.4 Brain-computer interface development
- 3.3.1 Current technologies
- 3.4 Growth potential analysis
- 3.5 Regulatory landscape
- 3.5.1 NIST AI risk management framework
- 3.5.2 EU AI compliance requirements
- 3.5.3 GDPR data protection impact
- 3.5.4 Sector-specific AI regulations
- 3.5.5 International AI governance standards
- 3.5.6 Ethical AI development guidelines
- 3.6 Cost breakdown analysis
- 3.6.1 Development & training costs
- 3.6.2 Infrastructure & computing expenses
- 3.6.3 Integration & customization costs
- 3.6.4 Ongoing maintenance & updates
- 3.6.5 Compliance & governance costs
- 3.7 Porter's analysis
- 3.8 PESTEL analysis
- 3.9 Patent analysis
- 3.10 Sustainability and environmental aspects
- 3.10.1 Environmental impact assessment & lifecycle analysis
- 3.10.2 Social impact & community relations
- 3.10.3 Governance & corporate responsibility
- 3.10.4 Sustainable technological development
- 3.11 Use cases
- 3.12 AI model & algorithm analysis
- 3.12.1 Foundation model landscape
- 3.12.2 Fine-tuning & customization approaches
- 3.12.3 Model performance benchmarking
- 3.12.4 Training data requirements
- 3.12.5 Computer resource optimization
- 3.13 Investment landscape analysis
- 3.13.1 Venture capital investment in cognitive AI
- 3.13.2 Corporate investment & acquisition activity
- 3.13.3 Government AI research funding
- 3.13.4 Academic research investment
- 3.14 Customer behavior analysis
- 3.14.1 Enterprise adoption decision factors
- 3.14.2 Use case prioritization patterns
- 3.14.3 Vendor evaluation criteria
- 3.14.4 Implementation approach preferences
- 3.15 Performance & quality standards
- 3.15.1 Agent response accuracy metrics
- 3.15.2 Processing speed & latency requirements
- 3.15.3 Scalability & throughput benchmarks
- 3.15.4 Reliability & availability standards
- 3.16 Risk assessment framework
- 3.16.1 AI model bias & fairness risks
- 3.16.2 Data privacy & security risks
- 3.16.3 Regulatory compliance risks
- 3.16.4 Technology obsolescence risks
- 3.17 Ethical AI & responsible development
- 3.17.1 AI ethics framework implementation
- 3.17.2 Bias detection & mitigation strategies
- 3.17.3 Fairness & inclusive considerations
- 3.17.4 Transparency & explainability requirements
Chapter 4 Competitive Landscape, 2024
- 4.1 Introduction
- 4.2 Company market share analysis
- 4.2.1 North America
- 4.2.2 Europe
- 4.2.3 Asia Pacific
- 4.2.4 Latin America
- 4.2.5 Middle East & Africa
- 4.3 Competitive positioning matrix
- 4.4 Strategic outlook matrix
- 4.5 Key developments
- 4.5.1 Mergers & acquisitions
- 4.5.2 Partnerships & collaborations
- 4.5.3 New product launches
- 4.5.4 Expansion plans and funding
Chapter 5 Market Estimates & Forecast, By Agent, 2021 - 2034 ($Bn)
- 5.1 Key trends
- 5.2 Virtual Assistants (VA)
- 5.3 Conversational Customer Agents
- 5.4 Digital Workers
- 5.5 Decision-Support
- 5.6 Others
Chapter 6 Market Estimates & Forecast, By System, 2021 - 2034 ($Bn)
- 6.1 Key trends
- 6.2 Single agent
- 6.3 Multi agent
Chapter 7 Market Estimates & Forecast, By Autonomy Level, 2021 - 2034 ($Bn)
- 7.1 Key trends
- 7.2 Semi-autonomous
- 7.3 Fully autonomous
- 7.4 Assistive (Human-in-the-loop)
Chapter 8 Market Estimates & Forecast, By Technology, 2021 - 2034 ($Bn)
- 8.1 Key trends
- 8.2 Machine Learning (ML)
- 8.3 Natural Language Processing
- 8.4 Computer Vision
- 8.5 Robotics Process Automation (RPA)
- 8.6 Cognitive Computing
- 8.7 Others
Chapter 9 Market Estimates & Forecast, By End Use, 2021 - 2034 ($Bn)
- 9.1 Key trends
- 9.2 Banking, Financial Services & Insurance (BFSI)
- 9.3 Healthcare & Life Sciences
- 9.4 Retail & e-commerce
- 9.5 Media & Entertainment
- 9.6 Manufacturing
- 9.7 Government & Public Sector
- 9.8 Education
- 9.9 Transportation & Logistics
- 9.10 Energy & Utilities
- 9.11 Others
Chapter 10 Market Estimates & Forecast, By Region, 2021 - 2034 ($Bn)
- 10.1 North America
- 10.1.1 US
- 10.1.2 Canada
- 10.2 Europe
- 10.2.1 UK
- 10.2.2 Germany
- 10.2.3 France
- 10.2.4 Italy
- 10.2.5 Spain
- 10.2.6 Belgium
- 10.2.7 Netherlands
- 10.2.8 Sweden
- 10.3 Asia Pacific
- 10.3.1 China
- 10.3.2 India
- 10.3.3 Japan
- 10.3.4 Australia
- 10.3.5 Singapore
- 10.3.6 South Korea
- 10.3.7 Vietnam
- 10.3.8 Indonesia
- 10.4 Latin America
- 10.4.1 Brazil
- 10.4.2 Mexico
- 10.4.3 Argentina
- 10.5 MEA
- 10.5.1 South Africa
- 10.5.2 Saudi Arabia
- 10.5.3 UAE
Chapter 11 Company Profiles
- 11.1 Global players
- 11.1.1 OpenAI
- 11.1.2 Microsoft
- 11.1.3 Google
- 11.1.4 Amazon Web Services
- 11.1.5 IBM
- 11.1.6 Anthropic
- 11.1.7 Salesforce
- 11.1.8 Meta Platforms
- 11.1.9 NVIDIA
- 11.1.10 Oracle
- 11.2 Regional players
- 11.2.1 UiPath
- 11.2.2 Automation Anywhere
- 11.2.3 ServiceNow
- 11.2.4 Baidu
- 11.2.5 Alibaba Cloud
- 11.2.6 Tencent
- 11.2.7 SAP
- 11.2.8 Palantir Technologies
- 11.2.9 DataRobot
- 11.2.10 H2O.ai
- 11.3 Emerging players
- 11.3.1 Cohere
- 11.3.2 Stability AI
- 11.3.3 Hugging Face
- 11.3.4 Adept AI
- 11.3.5 Character.AI
- 11.3.6 Jasper AI
- 11.3.7 Copy.ai
- 11.3.8 Rasa
- 11.3.9 Moveworks
- 11.3.10 Avanade