


 |
市场调查报告书
商品编码
1858879
发电用蒸汽涡轮机市场机会、成长驱动因素、产业趋势分析及预测(2025-2034年)Power Generation Steam Turbine Market Opportunity, Growth Drivers, Industry Trend Analysis, and Forecast 2025 - 2034 |
||||||
2024 年全球发电蒸汽涡轮机市场价值为 10.4 亿美元,预计到 2034 年将以 23.9% 的复合年增长率增长至 29.2 亿美元。
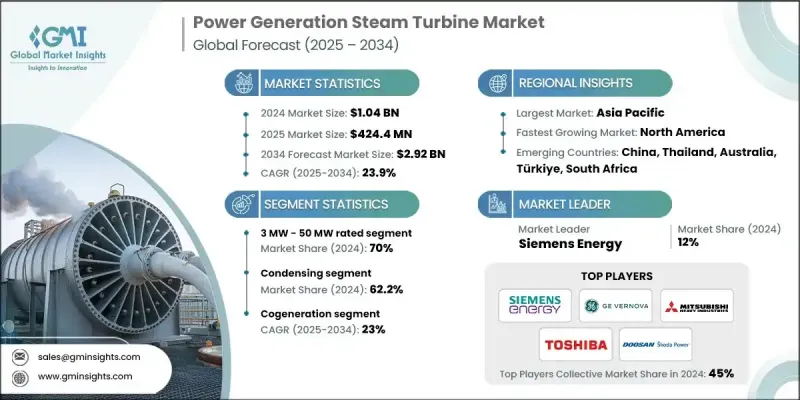
这一显着增长主要受工业活动扩张和对可靠、不间断电力日益增长的需求所驱动,从而加速了对自备发电的需求。随着工业规模的扩大,对稳定能源的需求也随之增加,促使高效蒸汽涡轮机系统得到广泛应用。工业界逐步向联合循环配置转型,以及对老旧火力发电装置的依赖下降,持续重塑市场格局。用于发电的蒸汽涡轮机将蒸汽的热能转换为机械能,然后将机械能转换为电能。在政府支持减排政策以及对热电联产和混合能源模式投资不断增加的背景下,市场前景仍然十分乐观。基础设施建设的不断改进以及为平衡电力供需所做的努力,进一步推动了对这些系统的需求。许多发展中经济体正在向天然气和再生能源发电进行显着转型,这提升了蒸汽涡轮机在混合能源系统中的作用,并促进了其在多个地区的广泛应用。
| 市场范围 | |
|---|---|
| 起始年份 | 2024 |
| 预测年份 | 2025-2034 |
| 起始值 | 10.4亿美元 |
| 预测值 | 29.2亿美元 |
| 复合年增长率 | 23.9% |
预计2034年,3兆瓦蒸汽涡轮机市场规模将达2.8亿美元。这些汽轮机结构紧凑,是工业场所、离网地区以及热电联产解决方案的高效电源。製造商正在推出模组化汽轮机配置,以简化安装、降低复杂性并减少维护。这些特性使其在农村地区和基础设施欠发达地区尤其具有吸引力,因为在这些地区,易于部署至关重要。
2024年,非凝汽式汽轮机市场规模达6.487亿美元。该领域受益于工业技术的快速升级和以提高能源效率为重点的政策倡议。公共和私人机构都在积极推动采用能够降低热损失并提供必要工艺蒸汽的汽轮机。这些汽轮机是热电联产应用的核心设备,可同时生产电力和热能。其高效性使其适用于重型工业作业。随着材料、叶片设计和热力学过程的改进,非凝汽式汽轮机如今具有更高的耐久性和更低的维护需求,从而提高了全生命週期经济性和整体效率。
预计到2034年,北美发电用蒸汽涡轮机市场规模将达1.65亿美元。该地区的成长主要得益于各行业热电联产系统应用的不断扩大。然而,由于许多国家正在逐步淘汰燃煤电厂,转而采用更清洁的能源,传统蒸汽涡轮机在火力发电厂的应用可能会放缓,从而形成一个复杂的成长模式。
活跃于全球发电蒸汽涡轮机市场的关键企业包括住友重工、Triveni Turbine、三菱重工、Turbotech Precision Engineering、MAN Energy Solutions、西门子能源、荏原株式会社、Trillium Flow Technologies、富士电机、杭州汽轮机动力集团、GE Vernova、川崎重、川崎重、川崎重工、日本重工解决方案Industries、安萨尔多能源、Bharat Heavy Electricals 和 Chola Turbo。为了巩固市场地位,发电蒸汽涡轮机市场的企业正致力于策略创新和全球合作。关键措施包括加大研发投入,开发能够在各种负载条件和环境标准下高效运作的汽轮机。企业也正在提升服务能力,提供包括安装、数位化监控和预测性维护在内的端到端支援。多家企业正透过合资企业共同开发结合再生能源和火力发电的混合系统。
目录
第一章:方法论与范围
第二章:执行概要
第三章:行业洞察
- 产业生态系分析
- 原物料供应及采购分析
- 製造能力评估
- 供应链韧性与风险因素
- 配电网路分析
- 监管环境
- 产业影响因素
- 成长驱动因素
- 产业陷阱与挑战
- 成长潜力分析
- 波特的分析
- PESTEL 分析
- 发电用蒸汽涡轮机的成本结构分析
- 价格趋势分析(美元/兆瓦)
- 按地区
- 按产能
- 新兴机会与趋势
- 数位化与物联网集成
- 新兴市场渗透
- 投资分析及未来展望
第四章:竞争格局
- 介绍
- 按地区分類的公司市占率分析
- 北美洲
- 欧洲
- 亚太地区
- 中东和非洲
- 拉丁美洲
- 战略仪錶板
- 策略倡议
- 重要伙伴关係与合作
- 主要併购活动
- 产品创新与发布
- 市场扩张策略
- 竞争性标竿分析
- 创新与永续发展格局
第五章:市场规模及预测:依设计类型划分,2021-2034年
- 主要趋势
- 反应
- 衝动
第六章:市场规模及预测:依废气排放划分,2021-2034年
- 主要趋势
- 冷凝
- 非冷凝式
第七章:市场规模及预测:依燃料类型划分,2021-2034年
- 主要趋势
- 石油和天然气
- 垃圾焚化发电厂
- 生物质
第八章:市场规模及预测:依产能划分,2021-2034年
- 主要趋势
- 小于 3 兆瓦
- 3兆瓦 - 50兆瓦
- 50兆瓦 - 100兆瓦
第九章:市场规模及预测:依技术划分,2021-2034年
- 主要趋势
- 蒸汽循环
- 复合循环
- 热电联产
第十章:市场规模及预测:依地区划分,2021-2034年
- 主要趋势
- 北美洲
- 我们
- 加拿大
- 墨西哥
- 欧洲
- 英国
- 法国
- 俄罗斯
- 德国
- 西班牙
- 义大利
- 亚太地区
- 中国
- 日本
- 韩国
- 印度
- 澳洲
- 印尼
- 马来西亚
- 泰国
- 中东和非洲
- 沙乌地阿拉伯
- 阿联酋
- 伊朗
- 埃及
- 南非
- 奈及利亚
- 土耳其
- 摩洛哥
- 拉丁美洲
- 巴西
- 阿根廷
- 智利
第十一章:公司简介
- Ansaldo Energia
- Bharat Heavy Electricals Limited
- Chart Industries
- Chola Turbo
- Doosan Škoda Power
- EBARA CORPORATION
- Fuji Electric
- GE Vernova
- Hangzhou Turbine Power Group
- Kawasaki Heavy Industries
- MAN Energy Solutions
- Mitsubishi Heavy Industries
- NCON Turbo Tech
- Shin Nippon Machinery
- Siemens Energy
- Sumitomo Heavy Industries
- Toshiba Energy Systems & Solutions Corporation
- Trillium Flow Technologies
- Triveni Turbine
- Turbotech Precision Engineering
The Global Power Generation Steam Turbine Market was valued at USD 1.04 billion in 2024 and is estimated to grow at a CAGR of 23.9% to reach USD 2.92 billion by 2034.
This substantial growth is driven by expanding industrial activities and the growing need for reliable, uninterrupted electricity, which is accelerating demand for captive power generation. As industries scale up, they require stable energy sources, encouraging the adoption of efficient steam turbine systems. A gradual industry shift toward combined cycle configurations, along with the declining reliance on outdated thermal power units, continues to reshape the market. Steam turbines used in power generation convert the thermal energy of steam into mechanical energy, which is then transformed into electricity. With supportive government policies targeting emissions reduction, alongside increasing investments in cogeneration and hybrid energy models, the market outlook remains highly favorable. Rising infrastructure development and efforts to balance electricity demand and supply further contribute to the demand for these systems. Many developing economies are making notable transitions toward gas-based and renewable power generation, enhancing the role of steam turbines within hybrid setups and contributing to their expanding application across multiple regions.
| Market Scope | |
|---|---|
| Start Year | 2024 |
| Forecast Year | 2025-2034 |
| Start Value | $1.04 Billion |
| Forecast Value | $2.92 Billion |
| CAGR | 23.9% |
The segment featuring 3 MW steam turbines is forecast to reach USD 280 million by 2034. These turbines are compact and serve as efficient power sources for industrial sites, off-grid locations, and combined heat and power solutions. Manufacturers are introducing modular turbine configurations that streamline installation, reduce complexity, and cut down on maintenance. These features make them particularly attractive in rural zones and regions with developing infrastructure, where ease of deployment is crucial.
In 2024, the non-condensing steam turbine segment was valued at USD 648.7 million. This category benefits from rapid industrial upgrades and policy-led efforts focused on energy efficiency. Both public and private initiatives are pushing the adoption of steam turbines that lower thermal losses while delivering essential process steam. These turbines are central to combined heat and power applications, which produce both electricity and thermal energy. Their efficiency makes them suitable for heavy-duty industrial operations. With improvements in materials, blade design, and thermodynamic processes, non-condensing turbines now offer better durability and lower maintenance requirements, improving lifecycle economics and overall efficiency.
North America Power Generation Steam Turbine Market is projected to reach USD 165 million by 2034. Growth in this region is primarily fueled by expanding use of cogeneration systems across industries. However, conventional steam turbine deployment in thermal plants may see a slowdown, as many nations are phasing out coal-fired facilities in favor of cleaner alternatives, creating a mixed landscape for growth.
Key companies actively operating in the Global Power Generation Steam Turbine Market include Sumitomo Heavy Industries, Triveni Turbine, Mitsubishi Heavy Industries, Turbotech Precision Engineering, MAN Energy Solutions, Siemens Energy, EBARA CORPORATION, Trillium Flow Technologies, Fuji Electric, Hangzhou Turbine Power Group, GE Vernova, Kawasaki Heavy Industries, NCON Turbo Tech, Doosan Skoda Power, Toshiba Energy Systems & Solutions Corporation, Shin Nippon Machinery, Chart Industries, Ansaldo Energia, Bharat Heavy Electricals, and Chola Turbo. To strengthen their presence, companies in the power generation steam turbine market are focusing on strategic innovation and global partnerships. Key approaches include expanding R&D to develop turbines that operate efficiently under varied load conditions and environmental standards. Firms are also enhancing their service capabilities, offering end-to-end support including installation, digital monitoring, and predictive maintenance. Several players are entering joint ventures to co-develop hybrid systems combining renewable and thermal power generation.
Table of Contents
Chapter 1 Methodology & Scope
- 1.1 Research design
- 1.1.1 Research approach
- 1.1.2 Data collection methods
- 1.2 Base estimates and calculations
- 1.2.1 Base year calculation
- 1.2.2 Market estimates & forecast parameters
- 1.3 Forecast model
- 1.3.1 Key trends for market estimates
- 1.3.2 Quantified market impact analysis
- 1.3.2.1 Mathematical impact of growth parameters on forecast
- 1.3.3 Scenario analysis framework
- 1.4 Primary research and validation
- 1.4.1 Some of the primary sources (but not limited to)
- 1.5 Data mining sources
- 1.5.1 Paid Sources
- 1.5.2 Sources, by region
- 1.6 Research trail & scoring components
- 1.6.1 Research trail components
- 1.6.2 Scoring components
- 1.7 Research transparency addendum
- 1.7.1 Source attribution framework
- 1.7.2 Quality assurance metrics
- 1.7.3 Our commitment to trust
- 1.8 Market definitions
Chapter 2 Executive Summary
- 2.1 Industry synopsis, 2021 - 2034
- 2.1.1 Business trends
- 2.1.2 Design trends
- 2.1.3 Exhaust trends
- 2.1.4 Fuel trends
- 2.1.5 Capacity trends
- 2.1.6 Technology trends
- 2.1.7 Regional trends
Chapter 3 Industry Insights
- 3.1 Industry ecosystem analysis
- 3.1.1 Raw material availability & sourcing analysis
- 3.1.2 Manufacturing capacity assessment
- 3.1.3 Supply chain resilience & risk factors
- 3.1.4 Distribution network analysis
- 3.2 Regulatory landscape
- 3.3 Industry impact forces
- 3.3.1 Growth drivers
- 3.3.2 Industry pitfalls & challenges
- 3.4 Growth potential analysis
- 3.5 Porter's analysis
- 3.5.1 Bargaining power of suppliers
- 3.5.2 Bargaining power of buyers
- 3.5.3 Threat of new entrants
- 3.5.4 Threat of substitutes
- 3.6 PESTEL analysis
- 3.6.1 Political factors
- 3.6.2 Economic factors
- 3.6.3 Social factors
- 3.6.4 Technological factors
- 3.6.5 Legal factors
- 3.6.6 Environmental factors
- 3.7 Cost structure analysis of power generation steam turbines
- 3.8 Price trend analysis (USD/MW)
- 3.8.1 By region
- 3.8.2 By capacity
- 3.9 Emerging opportunities & trends
- 3.9.1 Digitalization & IoT integration
- 3.9.2 Emerging market penetration
- 3.10 Investment analysis & future prospects
Chapter 4 Competitive Landscape, 2025
- 4.1 Introduction
- 4.2 Company market share analysis, by region, 2024
- 4.2.1 North America
- 4.2.2 Europe
- 4.2.3 Asia Pacific
- 4.2.4 Middle East & Africa
- 4.2.5 Latin America
- 4.3 Strategic dashboard
- 4.4 Strategic initiatives
- 4.4.1 Key partnerships & collaborations
- 4.4.2 Major M&A activities
- 4.4.3 Product innovations & launches
- 4.4.4 Market expansion strategies
- 4.5 Competitive benchmarking
- 4.6 Innovation & sustainability landscape
Chapter 5 Market Size and Forecast, By Design, 2021 - 2034 (USD Million & MW)
- 5.1 Key trends
- 5.2 Reaction
- 5.3 Impulse
Chapter 6 Market Size and Forecast, By Exhaust, 2021 - 2034 (USD Million & MW)
- 6.1 Key trends
- 6.2 Condensing
- 6.3 Non-condensing
Chapter 7 Market Size and Forecast, By Fuel, 2021 - 2034 (USD Million & MW)
- 7.1 Key trends
- 7.2 Oil & gas
- 7.3 Waste-to-energy plants
- 7.4 Biomass
Chapter 8 Market Size and Forecast, By Capacity, 2021 - 2034 (USD Million & MW)
- 8.1 Key trends
- 8.2 < 3 MW
- 8.3 3 MW - 50 MW
- 8.4 > 50 MW - 100 MW
Chapter 9 Market Size and Forecast, By Technology, 2021 - 2034 (USD Million & MW)
- 9.1 Key trends
- 9.2 Steam cycle
- 9.3 Combined cycle
- 9.4 Cogeneration
Chapter 10 Market Size and Forecast, By Region, 2021 - 2034 (USD Million & MW)
- 10.1 Key trends
- 10.2 North America
- 10.2.1 U.S.
- 10.2.2 Canada
- 10.2.3 Mexico
- 10.3 Europe
- 10.3.1 UK
- 10.3.2 France
- 10.3.3 Russia
- 10.3.4 Germany
- 10.3.5 Spain
- 10.3.6 Italy
- 10.4 Asia Pacific
- 10.4.1 China
- 10.4.2 Japan
- 10.4.3 South Korea
- 10.4.4 India
- 10.4.5 Australia
- 10.4.6 Indonesia
- 10.4.7 Malaysia
- 10.4.8 Thailand
- 10.5 Middle East & Africa
- 10.5.1 Saudi Arabia
- 10.5.2 UAE
- 10.5.3 Iran
- 10.5.4 Egypt
- 10.5.5 South Africa
- 10.5.6 Nigeria
- 10.5.7 Turkiye
- 10.5.8 Morocco
- 10.6 Latin America
- 10.6.1 Brazil
- 10.6.2 Argentina
- 10.6.3 Chile
Chapter 11 Company Profiles
- 11.1 Ansaldo Energia
- 11.2 Bharat Heavy Electricals Limited
- 11.3 Chart Industries
- 11.4 Chola Turbo
- 11.5 Doosan Škoda Power
- 11.6 EBARA CORPORATION
- 11.7 Fuji Electric
- 11.8 GE Vernova
- 11.9 Hangzhou Turbine Power Group
- 11.10 Kawasaki Heavy Industries
- 11.11 MAN Energy Solutions
- 11.12 Mitsubishi Heavy Industries
- 11.13 NCON Turbo Tech
- 11.14 Shin Nippon Machinery
- 11.15 Siemens Energy
- 11.16 Sumitomo Heavy Industries
- 11.17 Toshiba Energy Systems & Solutions Corporation
- 11.18 Trillium Flow Technologies
- 11.19 Triveni Turbine
- 11.20 Turbotech Precision Engineering
 2026年全球蒸气涡轮售后市场报告
 蒸汽轮机
蒸汽轮机 工业电阻式蒸气加湿器市场:依终端用户产业、容量范围、控制方式、通路和维护类型划分,全球预测(2026-2032年)工业蒸气加湿器市场按产品类型、最终用户产业、工作压力、安装方式和分销管道划分,全球预测(2026-2032年)
 全球蒸气涡轮服务市场规模、份额、趋势和成长分析报告(2026-2034年)2026年全球蒸气涡轮市场报告
 全球蒸汽涡轮机市场:依技术、设计、排气系统、应用、燃料和地区划分-市场规模、产业动态、机会分析和预测(2026-2035 年)
 蒸气涡轮市场-全球产业规模、份额、趋势、机会和预测:按类型、额定容量、排气类型、燃料类型、地区和竞争格局划分,2021-2031年蒸气涡轮市场-2026-2031年预测蒸汽涡轮机MRO市场-全球产业规模、份额、趋势、机会和预测,按服务类型、服务提供者、燃料类型、容量、最终用户产业、地区和竞争格局划分,2021-2031年预测