


 |
市场调查报告书
商品编码
1858880
循环经济解决方案市场机会、成长驱动因素、产业趋势分析及预测Circular Economy Solutions Market Opportunity, Growth Drivers, Industry Trend Analysis, and Forecast |
||||||
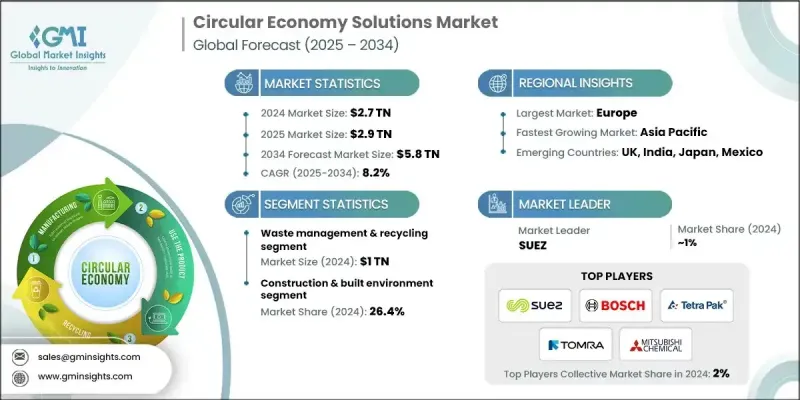
2024 年全球循环经济解决方案市值为 2.7 兆美元,预计到 2034 年将以 8.2% 的复合年增长率成长至 5.8 兆美元。
随着资源短缺和供应链不稳定持续为各行各业带来挑战,企业正越来越多地采用循环经济模式来提高营运效率并最大限度地减少浪费。这项转变的驱动力在于保障材料供应、降低成本并同时促进永续发展。企业正在将回收和再利用系统融入核心运营,逐步摆脱传统的线性模式。物联网和人工智慧等数位技术如今能够实现即时生命週期追踪和预测性维护,从而提升这些系统的效能。专注于先进材料回收、高效能循环和智慧基础设施的企业正引领这项转型。数位平台也迅速发展,促进了翻新产品交易、备件市场和共享服务。这一成长趋势凸显了市场向闭环模式和循环驱动型创新转变的更广泛趋势,从而提升了企业的长期韧性和资源优化利用率。
| 市场范围 | |
|---|---|
| 起始年份 | 2024 |
| 预测年份 | 2025-2034 |
| 起始值 | 2.7兆美元 |
| 预测值 | 5.8兆美元 |
| 复合年增长率 | 8.2% |
到2024年,废弃物管理和回收领域预计将创造1兆美元的产值,成为循环经济框架中最成熟、最容易推广的部分。市政当局和企业广泛采用这些系统,以提高资源回收率并减少垃圾掩埋量。威立雅和巴斯夫等行业领导者正在利用先进的分类技术和物流创新来改善收集和处理模式。该领域持续受益于支持永续发展和循环经济实践的监管倡议,从而促进各行业之间的快速整合。
2024年,电子电气设备产业市占率预计将达到20.1%,这主要得益于日益增强的环保意识以及回收和翻新技术的发展。消费者对永续电子产品的需求不断增长,以及遏制电子垃圾产生的努力,都推动了该行业的成长。整个产业的公司都在致力于可拆卸设计和延长产品寿命,从而增强了对循环电子解决方案的需求。
预计到2024年,美国循环经济解决方案市占率将达到77.1%。消费者意识的增强和企业责任框架的完善正在推动该地区对循环经济实践的需求。环境、社会和治理(ESG)策略的采纳、绿色建筑认证的增加以及生产者延伸责任政策的扩展,使美国在该市场中处于领先地位。各行各业的企业都在积极采用产品生命週期服务和永续物流,以满足不断变化的监管要求和消费者期望。
全球循环经济解决方案市场的主要参与者包括 Tomra Systems、Tetra Pak、Cylib、苏伊士集团 (SUEZ)、威立雅 (Veolia)、巴斯夫 (BASF)、Circularise、优美科 (Umicore)、ENEOS、Carbios、Trinseo、Li Industries、Bosch (Bosch)、Reinverse 和三菱化学。为了巩固其在循环经济解决方案市场的地位,领先企业正致力于整合包括人工智慧 (AI) 和物联网 (IoT) 在内的智慧技术,以实现即时追踪、预测分析和生命週期管理。许多企业正在与技术供应商建立策略合作伙伴关係,以改善材料回收流程并支援闭环模式。对环保材料和可扩展回收技术的研发投入也在推动产品创新。此外,企业正在拓展其翻新产品和产品即服务 (PaaS) 模式的服务,以满足日益增长的环保意识消费者的需求。
目录
第一章:方法论与范围
第二章:执行概要
第三章:行业洞察
- 产业生态系分析
- 供应商格局
- 利润率
- 每个阶段的价值增加
- 影响价值链的因素
- 产业影响因素
- 成长驱动因素
- 监管压力与永续发展要求
- 资源稀缺性和成本效益
- 消费者对永续解决方案的需求
- 产业陷阱与挑战
- 初始投资额高,且投资报酬率存在不确定性
- 基础设施分散且缺乏标准化
- 机会
- 数位化赋能与智慧技术
- 新的商业模式和收入来源
- 成长驱动因素
- 成长潜力分析
- 未来市场趋势
- 技术与创新格局
- 当前技术趋势
- 新兴技术
- 监管环境
- 标准和合规要求
- 区域监理框架
- 认证标准
- 差距分析
- 风险评估与缓解
- 波特的分析
- PESTEL 分析
第四章:竞争格局
- 介绍
- 公司市占率分析
- 按地区
- 公司矩阵分析
- 主要市场参与者的竞争分析
- 竞争定位矩阵
- 关键进展
- 併购
- 合作伙伴关係与合作
- 新产品发布
- 扩张计划
第五章:市场估算与预测:依解类型划分,2021-2034年
- 废弃物管理与回收
- 先进的分选和分离系统
- 化学回收与解聚
- 物料回收设施(MRF)及处理
- 有机废弃物处理和沼气生产
- 电子垃圾(电子废弃物)回收
- 再製造和翻新服务
- 汽车零件再製造
- 电子及IT设备翻新
- 工业机械设备修復
- 航太与国防零件回收
- 产品即服务 (PaaS) 模式
- 设备租赁与绩效合约
- 出行即服务与共享交通
- 照明即服务与能源效能
- 包装即服务和可重复使用容器
- 工业共生与资源交换
- 垃圾发电整合系统
- 副产品交换与材料匹配平台
- 生态工业园区开发
- 碳捕获、利用与封存(CCUS)一体化
- 其他(数位化溯源和资料平台等)
第六章:市场估算与预测:依平台类型划分,2021-2034年
- 产品和材料交换
- 二手交易市场
- 共享平台
- 循环供应链网络
- 其他(永续物流平台等)
第七章:市场估计与预测:依应用领域划分,2021-2034年
- 建筑与建成环境
- 塑胶及包装
- 电子电器设备
- 纺织品和服装
- 食品与农业
- 汽车与运输
- 其他(农业等)
第八章:市场估算与预测:依地区划分,2021-2034年
- 钥匙
- 北美洲
- 我们
- 加拿大
- 欧洲
- 德国
- 英国
- 法国
- 西班牙
- 义大利
- 亚太地区
- 中国
- 日本
- 印度
- 澳洲
- 韩国
- 拉丁美洲
- 巴西
- 墨西哥
- 阿根廷
- MEA
- 南非
- 沙乌地阿拉伯
- 阿联酋
第九章:公司简介
- BASF
- Bosch
- Carbios
- Circularise
- Cylib
- ENEOS
- Li Industries
- Mitsubishi Chemical
- Refinverse
- SUEZ
- Tetra Pak
- Tomra Systems
- Trinseo
- Umicore
- Veolia
The Global Circular Economy Solutions Market was valued at USD 2.7 trillion in 2024 and is estimated to grow at a CAGR of 8.2% to reach USD 5.8 trillion by 2034.
As resource scarcity and supply chain instability continue to challenge industries, companies are increasingly adopting circular models to enhance operational efficiency and minimize waste. This shift is being driven by a need to safeguard material availability and reduce costs while promoting sustainability. Businesses are integrating recovery and reuse systems into core operations, transitioning away from conventional linear models. Digital technologies like IoT and AI are now enabling real-time lifecycle tracking and predictive maintenance, enhancing the effectiveness of these systems. Companies focused on advanced material recovery, efficient recycling, and smart infrastructure are leading this transition. Digital platforms have also expanded rapidly, facilitating refurbished goods trading, spare parts marketplaces, and shared services. This growth trend underscores a broader market movement toward closed-loop models and circularity-driven innovation, improving long-term resilience and resource optimization.
| Market Scope | |
|---|---|
| Start Year | 2024 |
| Forecast Year | 2025-2034 |
| Start Value | $2.7 Trillion |
| Forecast Value | $5.8 Trillion |
| CAGR | 8.2% |
The waste management and recycling segment generated USD 1 trillion in 2024, representing the most developed and readily scalable part of circular economy frameworks. These systems are widely adopted by municipalities and corporations to improve resource recovery and reduce landfill waste. Industry leaders like Veolia and BASF are leveraging advanced sorting technologies and logistical innovations to refine collection and processing models. This segment continues to benefit from regulatory initiatives that support sustainability and circularity practices, encouraging quicker integration across industries.
The electronics and electrical equipment segment held a 20.1% share in 2024, propelled by rising environmental consciousness and technology-driven advancements in recycling and refurbishing. Growing consumer preference for sustainable electronics and the push to curb e-waste generation have fueled this segment. Companies across the sector are focusing on design for disassembly and extended product life, strengthening demand for circular electronics solutions.
United States Circular Economy Solutions Market held a 77.1% share in 2024. Strong consumer awareness and corporate responsibility frameworks are driving the regional demand for circular practices. Adoption of environmental, social, and governance (ESG) strategies, increased certification for green buildings, and expansion of extended producer responsibility policies have positioned the U.S. at the forefront of this market. Businesses across sectors are embracing product lifecycle services and sustainable logistics to align with evolving regulatory and consumer expectations.
Key players in the Global Circular Economy Solutions Market include Tomra Systems, Tetra Pak, Cylib, SUEZ, Veolia, BASF, Circularise, Umicore, ENEOS, Carbios, Trinseo, Li Industries, Bosch, Reinverse, and Mitsubishi Chemical. To strengthen their foothold in the Circular Economy Solutions Market, leading companies are focusing on integrating smart technologies, including AI and IoT, to enable real-time tracking, predictive analytics, and lifecycle management. Many are forming strategic partnerships with technology providers to enhance material recovery processes and support closed-loop models. Investments in R&D for eco-friendly materials and scalable recycling technologies are also shaping product innovation. Additionally, businesses are expanding their services around refurbished products and product-as-a-service models to tap into the evolving preferences of environmentally conscious consumers.
Table of Contents
Chapter 1 Methodology & Scope
- 1.1 Market scope and definition
- 1.2 Research design
- 1.2.1 Research approach
- 1.2.2 Data collection methods
- 1.3 Data mining sources
- 1.3.1 Global
- 1.3.2 Regional
- 1.4 Base estimates and calculations
- 1.4.1 Base year calculation
- 1.4.2 Key trends for market estimation
- 1.5 Primary research and validation
- 1.5.1 Primary sources
- 1.6 Forecast model
- 1.7 Research assumptions and limitations
Chapter 2 Executive Summary
- 2.1 Industry 360° synopsis
- 2.2 Key market trends
- 2.2.1 Regional
- 2.2.2 Solution type
- 2.2.3 Platforms type
- 2.2.4 Application
- 2.3 CXO perspectives: Strategic imperatives
- 2.3.1 Key decision points for industry executives
- 2.3.2 Critical success factors for market players
- 2.4 Future outlook and strategic recommendations
Chapter 3 Industry Insights
- 3.1 Industry ecosystem analysis
- 3.1.1 Supplier landscape
- 3.1.2 Profit margin
- 3.1.3 Value addition at each stage
- 3.1.4 Factor affecting the value chain
- 3.2 Industry impact forces
- 3.2.1 Growth drivers
- 3.2.1.1 Regulatory pressure & sustainability mandates
- 3.2.1.2 Resource scarcity & cost efficiency
- 3.2.1.3 Consumer demand for sustainable solutions
- 3.2.2 Industry pitfalls & challenges
- 3.2.2.1 High initial investment & ROI uncertainty
- 3.2.2.2 Fragmented infrastructure & lack of standardization
- 3.2.3 Opportunities
- 3.2.3.1 Digital enablement & smart technologies
- 3.2.3.2 New business models & revenue streams
- 3.2.1 Growth drivers
- 3.3 Growth potential analysis
- 3.4 Future market trends
- 3.5 Technology and innovation landscape
- 3.5.1 Current technological trends
- 3.5.2 Emerging technologies
- 3.6 Regulatory landscape
- 3.6.1 Standards and compliance requirements
- 3.6.2 Regional regulatory frameworks
- 3.6.3 Certification standards
- 3.7 Gap Analysis
- 3.8 Risk assessment and mitigation
- 3.9 Porter's analysis
- 3.10 PESTEL analysis
Chapter 4 Competitive Landscape, 2024
- 4.1 Introduction
- 4.2 Company market share analysis
- 4.2.1 By region
- 4.2.1.1 North America
- 4.2.1.2 Europe
- 4.2.1.3 Asia Pacific
- 4.2.1.4 Latin America
- 4.2.1.5 Middle East and Africa
- 4.2.1 By region
- 4.3 Company matrix analysis
- 4.4 Competitive analysis of major market players
- 4.5 Competitive positioning matrix
- 4.6 Key developments
- 4.6.1 Mergers & acquisitions
- 4.6.2 Partnerships & collaborations
- 4.6.3 New product launches
- 4.6.4 Expansion plans
Chapter 5 Market Estimates & Forecast, By Solution Type, 2021-2034 (USD Trillion)
- 5.1 Waste management & recycling
- 5.1.1 Advanced sorting & separation systems
- 5.1.2 Chemical recycling & depolymerization
- 5.1.3 Material recovery facilities (MRF) & processing
- 5.1.4 Organic waste processing & biogas generation
- 5.1.5 Electronic waste (E-waste) recovery
- 5.2 Remanufacturing & refurbishment services
- 5.2.1 Automotive component remanufacturing
- 5.2.2 Electronics & IT equipment refurbishment
- 5.2.3 Industrial machinery & equipment restoration
- 5.2.4 Aerospace & defense component recovery
- 5.3 Product-as-a-service (PaaS) models
- 5.3.1 Equipment leasing & performance contracting
- 5.3.2 Mobility-as-a-service & shared transportation
- 5.3.3 Lighting-as-a-service & energy performance
- 5.3.4 Packaging-as-a-service & reusable container
- 5.4 Industrial symbiosis & resource exchange
- 5.4.1 Waste-to-energy integration systems
- 5.4.2 By-product exchange & material matching platforms
- 5.4.3 Eco-industrial park development
- 5.4.4 Carbon capture, utilization & storage (CCUS) integration
- 5.5 Others (digital traceability & data platforms etc.)
Chapter 6 Market Estimates & Forecast, By Platforms Type, 2021-2034 (USD Trillion)
- 6.1 Product & material exchanges
- 6.2 Reuse & resale marketplaces
- 6.3 Sharing platforms
- 6.4 Circular supply chain networks
- 6.5 Others (sustainable logistics platforms etc.)
Chapter 7 Market Estimates & Forecast, By Application, 2021-2034 (USD Trillion)
- 7.1 Construction & built environment
- 7.2 Plastics & packaging
- 7.3 Electronics & electrical equipment
- 7.4 Textiles & apparel
- 7.5 Food & agriculture
- 7.6 Automotive & transportation
- 7.7 Others (agriculture etc.)
Chapter 8 Market Estimates & Forecast, By Region, 2021-2034 (USD Trillion)
- 8.1 Key
- 8.2 North America
- 8.2.1 U.S.
- 8.2.2 Canada
- 8.3 Europe
- 8.3.1 Germany
- 8.3.2 UK
- 8.3.3 France
- 8.3.4 Spain
- 8.3.5 Italy
- 8.4 Asia Pacific
- 8.4.1 China
- 8.4.2 Japan
- 8.4.3 India
- 8.4.4 Australia
- 8.4.5 South Korea
- 8.5 Latin America
- 8.5.1 Brazil
- 8.5.2 Mexico
- 8.5.3 Argentina
- 8.6 MEA
- 8.6.1 South Africa
- 8.6.2 Saudi Arabia
- 8.6.3 UAE
Chapter 9 Company Profiles
- 9.1 BASF
- 9.2 Bosch
- 9.3 Carbios
- 9.4 Circularise
- 9.5 Cylib
- 9.6 ENEOS
- 9.7 Li Industries
- 9.8 Mitsubishi Chemical
- 9.9 Refinverse
- 9.10 SUEZ
- 9.11 Tetra Pak
- 9.12 Tomra Systems
- 9.13 Trinseo
- 9.14 Umicore
- 9.15 Veolia