


 |
市场调查报告书
商品编码
1858999
溶解气体分析仪 (DGA) 市场机会、成长驱动因素、产业趋势分析及预测(2025-2034 年)Dissolved Gas Analyzer (DGA) Market Opportunity, Growth Drivers, Industry Trend Analysis, and Forecast 2025 - 2034 |
||||||
2024 年全球溶解气体分析仪 (DGA) 市值为 5.78 亿美元,预计到 2034 年将以 6.3% 的复合年增长率增长至 10.5 亿美元。
电力产业和工业领域对老旧电力基础设施高效监测的需求日益增长,推动了溶解气体分析仪(DGA)市场的发展。 DGA透过分析绝缘油中溶解的气体,在电力变压器早期故障的检测中发挥着至关重要的作用。随着旧电网可靠性的下降,DGA系统正被广泛采用,以预防设备故障、减少停机时间并优化维护计划。电力公司优先考虑基于状态的监测,以延长资产寿命并避免计划外停电,这极大地促进了这些技术的应用。 DGA系统还支援预测性维护策略,这些策略与更广泛的电网现代化工作一致,并确保长期电力稳定性。人们对变压器诊断在提高可持续性和可靠性方面的认识不断提高,进一步巩固了市场的发展势头,尤其是在电力公司和工业运营商面临着提高正常运行时间和降低与老旧能源资产相关的运营风险的压力之际。
| 市场范围 | |
|---|---|
| 起始年份 | 2024 |
| 预测年份 | 2025-2034 |
| 起始值 | 5.78亿美元 |
| 预测值 | 10.5亿美元 |
| 复合年增长率 | 6.3% |
2024年,多气体系统市占率达到62%,预计2034年将维持6.4%的复合年增长率。这些系统旨在同时检测和测量各种工业条件下的多种气体类型。它们配备了先进的感测技术,可分析甲烷、一氧化碳、二氧化碳、氧气和挥发性有机化合物(VOCs)等气体,提供准确的即时资料,这对于确保运行安全和环境合规至关重要。其多功能性和可靠性使其成为工业监测和变压器诊断的首选。
现代数位协议领域在2024年占据了63%的市场份额,预计2025年至2034年将以6.4%的复合年增长率成长。 DNP3和IEC 61850等数位通讯标准正日益整合到智慧电网和数位变电站。这些协定能够实现复杂电力系统中快速、安全且可扩展的资料传输,支援基于事件的通讯和即时系统监控。它们在增强不同设备生态系统间的互通性和预测分析方面发挥着重要作用,这是推动该领域成长的关键因素。
2024年,美国溶解气体分析仪(DGA)市场规模达1.523亿美元,反映出市场对变压器健康监测工具的强劲需求。北美地区凭藉其老化的电网基础设施、严格的监管标准以及对智慧电网技术的快速投资,继续引领全球DGA市场。该地区也聚集了大量的DGA製造商和解决方案供应商,进一步推动了先进监测解决方案的创新和部署,从而保障电网可靠性。
在全球溶解气体分析仪 (DGA) 市场中,西门子股份公司 (Siemens AG)、MTE Meter Test Equipment AG、GE Vernova Inc.、EMH Energie-Messtechnik GmbH、Vaisala Oyj、ABB Ltd.、LumaSense Technologies. Inc.、Doble Engineering Company、Qualitrol Company LLC 和思源电气股份有限公司 (Sieyuan Electric Co. Ltd.) 等公司为主要参与者。这些公司正透过有针对性的创新、策略合作和产品组合拓展来巩固其市场地位。许多企业正在投资下一代感测器技术和人工智慧分析,以提高气体检测系统的精度和即时性能。製造商还将他们的 DGA 产品与更广泛的变压器监测平台集成,从而提供端到端的诊断解决方案。一些公司专注于开发紧凑型模组化系统,以满足现代变电站的空间限制。
目录
第一章:方法论与范围
第二章:执行概要
第三章:行业洞察
- 产业生态系分析
- 供应商格局
- 利润率
- 每个阶段的价值增加
- 影响价值链的因素
- 中断
- 产业影响因素
- 成长驱动因素
- 老化的电力基础设施
- 电网可靠性的需求日益增长
- 监管和安全合规性
- 产业陷阱与挑战
- 高初始投资
- 技术工人短缺和劳动市场波动
- 机会
- 成长驱动因素
- 成长潜力分析
- 市场进入与定位策略
- 监管环境
- 主要市场趋势和颠覆性因素
- 从离线实验室分析转向线上即时监测
- 与资产绩效管理 (APM) 和人工智慧平台集成
- 更重视电网可靠性和韧性
- 再生能源併网和基础设施老化是需求驱动因素。
- 向整体性、多参数变压器监测过渡
- 技术和创新格局
- 当前技术趋势
- 下一代感测器技术(PAS、NDIR、固态)
- 边缘运算助力车载诊断和更快警报
- 先进的软体和人工智慧驱动的诊断演算法
- 模组化设计和增强的连接性(IEC 61850)
- 免维护且低耗材的系统
- 新兴技术
- 先进光学感测:整合光纤实现非侵入式监测
- 人工智慧与数位孪生技术的融合:增强故障预测和资产模拟
- 车队整体健康评估的数据分析:从单一资产到电网层级洞察
- 替代绝缘液:开发适用于酯类油和其他环保液体的DGA解决方案
- 当前技术趋势
- 2024年定价分析
- 产品成本
- 单气体系统
- 多气体系统
- 组件/订阅费用
- 载气钢瓶(例如,氩气,用于气相层析仪)
- 年度软体和数据分析订阅(按资产计)
- 原物料供应中的实际产能限制与感知产能限制
- 产品成本
- 供应商价格上涨趋势验证未来市场趋势
- 人工智慧驱动的预测性维护与自主电网管理
- 采用资料生成代理即服务 (DaaS) 和订阅模式
- 风险评估与缓解
- 监理合规风险
- 产能限制影响分析
- 技术转型风险
- 价格波动和成本上涨风险
- 波特五力分析
- PESTEL 分析
第四章:竞争格局
- 介绍
- 介绍
- 公司市占率分析
- 按地区
- 北美洲
- 欧洲
- 亚太地区
- MEA
- 拉丁美洲
- 按地区
- 公司矩阵分析
- 主要市场参与者的竞争分析
- 竞争定位矩阵
- 关键进展
- 併购
- 合作伙伴关係与合作
- 新产品发布
- 扩张计划
第五章:市场估算与预测:依产品类型划分,2021-2034年
- 单气体系统
- 多气体系统
- 其他的
第六章:市场估算与预测:依安装类型划分,2021-2034年
- 永久线上系统
- 便携式现场单元
- 实验室整合系统
- 其他的
第七章:市场估算与预测:依开采类型划分,2021-2034年
- 真空抽取
- 顶空萃取
- 脱硫柱法
- 其他的
第八章:市场估算与预测:依流体类型划分,2021-2034年
- 矿物油系统
- 天然酯体系
- 合成酯体系
- 硅油系统
- 其他的
第九章:市场估算与预测:依功率等级划分,2021-2034年
- 100-500兆伏安
- 501-800兆伏安
- 801 - 1200 兆伏安
- 其他的
第十章:市场估计与预测:依协议系统划分,2021-2034年
- 传统协定係统
- 现代数位协议系统
- 其他的
第十一章:市场估计与预测:依最终用途产业划分,2021-2034年
- 能源与电力
- 化学
- 矿业
- 石油和天然气
- 纸浆和造纸
- 其他的
第十二章:市场估算与预测:依配销通路,2021-2034年
- 间接销售
- 直销
第十三章:市场估计与预测:依地区划分,2021-2034年
- 主要趋势
- 北美洲
- 我们
- 加拿大
- 欧洲
- 英国
- 德国
- 法国
- 义大利
- 西班牙
- 俄罗斯
- 亚太地区
- 中国
- 印度
- 日本
- 韩国
- 澳洲
- 拉丁美洲
- 巴西
- 墨西哥
- MEA
- 南非
- 沙乌地阿拉伯
- 阿联酋
第十四章:公司简介
- ABB Ltd
- GE Vernova Inc.
- Siemens AG
- Hitachi Energy Ltd
- Qualitrol Company LLC
- Doble Engineering Company
- Vaisala Oyj
- MTE Meter Test Equipment AG
- Weidmann Electrical Technology AG
- Advanced Energy Industries Inc.
- Sieyuan Electric Co Ltd
- Gatron GmbH
- Morgan Schaffer
- EMH Energie-Messtechnik
- LumaSense Technologies
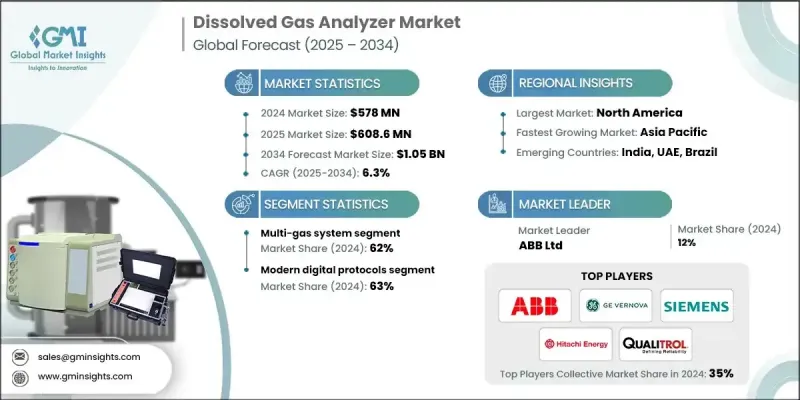
The Global Dissolved Gas Analyzer (DGA) Market was valued at USD 578 million in 2024 and is estimated to grow at a CAGR of 6.3% to reach USD 1.05 billion by 2034.
The growth is fueled by the rising need for efficient monitoring of aging power infrastructure across utilities and industrial sectors. Dissolved gas analyzers (DGAs) are instrumental in detecting early-stage faults in power transformers by analyzing gases dissolved in insulating oils. As aging grids struggle with reliability, DGA systems are being adopted to prevent equipment failures, reduce downtime, and optimize maintenance schedules. Utilities are prioritizing condition-based monitoring to extend asset life and avoid unplanned outages, which is driving strong adoption of these technologies. DGA systems also support predictive maintenance strategies that align with broader grid modernization efforts and ensure long-term power stability. The increasing awareness of transformer diagnostics for improved sustainability and reliability further reinforces the market's forward momentum, especially as utility providers and industrial operators face pressure to improve uptime and reduce operational risks tied to older energy assets.
| Market Scope | |
|---|---|
| Start Year | 2024 |
| Forecast Year | 2025-2034 |
| Start Value | $578 Million |
| Forecast Value | $1.05 Billion |
| CAGR | 6.3% |
In 2024, the multi-gas system segment held a 62% share and is expected to maintain growth at a CAGR of 6.4% through 2034. These systems are designed to simultaneously detect and measure multiple gas types across various industrial conditions. Equipped with advanced sensing technologies, they can analyze gases such as methane, carbon monoxide, carbon dioxide, oxygen, and VOCs, offering accurate real-time data essential for ensuring operational safety and environmental compliance. Their versatility and reliability make them the preferred choice in industrial monitoring and transformer diagnostics.
The modern digital protocols segment accounted for a 63% share in 2024 and is anticipated to grow at a CAGR of 6.4% from 2025 to 2034. Digital communication standards such as DNP3 and IEC 61850 are increasingly integrated into smart grids and digital substations. These protocols enable fast, secure, and scalable data transmission across complex power systems, supporting event-based communication and real-time system monitoring. Their role in enhancing interoperability and predictive analytics across diverse device ecosystems is a key factor driving growth in this segment.
U.S. Dissolved Gas Analyzer (DGA) Market generated USD 152.3 million in 2024, reflecting strong demand for transformer health monitoring tools. North America continues to lead the global DGA market due to its aging grid infrastructure, high regulatory standards, and rapid investments in smart grid technologies. The region also hosts a dense concentration of DGA manufacturers and solution providers, further bolstering innovation and deployment of advanced monitoring solutions to maintain grid reliability.
Key companies shaping the Global Dissolved Gas Analyzer (DGA) Market include Siemens AG, MTE Meter Test Equipment AG, GE Vernova Inc., EMH Energie-Messtechnik GmbH, Vaisala Oyj, ABB Ltd., LumaSense Technologies, Hitachi Energy Ltd, Gatron GmbH, Morgan Schaffer, Weidmann Electrical Technology AG, Advanced Energy Industries Inc., Doble Engineering Company, Qualitrol Company LLC, and Sieyuan Electric Co. Ltd. Companies in the Dissolved Gas Analyzer (DGA) Market are strengthening their market position through targeted innovation, strategic partnerships, and portfolio expansion. Many players are investing in next-gen sensor technologies and AI-powered analytics to enhance the accuracy and real-time performance of gas detection systems. Manufacturers are also integrating their DGA products with broader transformer monitoring platforms, providing end-to-end diagnostic solutions. Several firms focus on developing compact and modular systems to meet the space constraints of modern substations.
Table of Contents
Chapter 1 Methodology & Scope
- 1.1 Market scope and definition
- 1.2 Research design
- 1.2.1 Research approach
- 1.2.2 Data collection methods
- 1.3 Data mining sources
- 1.3.1 Global
- 1.3.2 Regional/Country
- 1.4 Base estimates and calculations
- 1.4.1 Base year calculation
- 1.4.2 Key trends for market estimation
- 1.5 Primary research and validation
- 1.5.1 Primary sources
- 1.6 Forecast model
- 1.7 Research assumptions and limitations
Chapter 2 Executive Summary
- 2.1 Industry 3600 synopsis
- 2.2 Key market trends
- 2.2.1 Regional
- 2.2.2 Product type
- 2.2.3 Fluid type
- 2.2.4 Protocol systems
- 2.2.5 Extraction type
- 2.2.6 Installation type
- 2.2.7 Power rating
- 2.2.8 End use industry
- 2.2.9 Distribution channel
- 2.3 CXO perspectives: strategic imperatives
- 2.3.1 Key decision points for industry executives
- 2.3.2 Critical success factors for market players
- 2.4 Future outlook and strategic recommendations
- 2.5 Strategic recommendations
- 2.5.1 Supply chain diversification strategy
- 2.5.2 Product portfolio enhancement
- 2.5.3 Partnership and alliance opportunities
- 2.5.4 Cost management and pricing strategy
- 2.6 Decision framework
- 2.6.1 Investment priority matrix
- 2.6.2 Risk-adjusted ROI analysis
Chapter 3 Industry Insights
- 3.1 Industry ecosystem analysis
- 3.1.1 Supplier Landscape
- 3.1.2 Profit Margin
- 3.1.3 Value addition at each stage
- 3.1.4 Factor affecting the value chain
- 3.1.5 Disruptions
- 3.2 Industry Impact forces
- 3.2.1 Growth drivers
- 3.2.1.1 Aging power infrastructure
- 3.2.1.2 Rising demand for grid reliability
- 3.2.1.3 Regulatory and safety compliance
- 3.2.2 Industry pitfalls & challenges
- 3.2.2.1 High initial investment
- 3.2.2.2 Skilled labor shortage and workforce volatility
- 3.2.3 Opportunities
- 3.2.1 Growth drivers
- 3.3 Growth potential analysis
- 3.4 Market entry and positioning strategy
- 3.5 Regulatory landscape
- 3.5.1 North America
- 3.5.2 Europe
- 3.5.3 Asia Pacific
- 3.5.4 Latin America
- 3.5.5 MEA
- 3.6 Major market trends and disruptions
- 3.6.1 Shift from offline lab analysis to online, real-time monitoring
- 3.6.2 Integration with asset performance management (APM) & AI platforms
- 3.6.3 Increased focus on grid reliability and resilience
- 3.6.4 Demand driven by renewable energy integration and aging infrastructure
- 3.6.5 Transition to holistic, multi-parameter transformer monitoring
- 3.7 Technological and innovation landscape
- 3.7.1 Current technological trends
- 3.7.1.1 Next-generation sensor technologies (PAS, NDIR, solid-state)
- 3.7.1.2 Edge computing for onboard diagnostics and faster alerts
- 3.7.1.3 Advanced software and AI-driven diagnostic algorithms
- 3.7.1.4 Modular designs and enhanced connectivity (IEC 61850)
- 3.7.1.5 Maintenance-free and low-consumable systems
- 3.7.2 Emerging technologies
- 3.7.2.1 Advanced optical sensing: Integrating fiber optics for non-invasive monitoring
- 3.7.2.2 AI and digital twin integration: Enhancing fault prediction and asset simulation
- 3.7.2.3 Data analytics for fleet-wide health assessment: From single-asset to grid-level insights
- 3.7.2.4 Alternative insulating fluids: Developing DGA solutions for ester oils and other eco-friendly liquids
- 3.7.1 Current technological trends
- 3.8 Pricing analysis, 2024
- 3.8.1 Product cost
- 3.8.1.1 Single-Gas Systems
- 3.8.1.2 Multi-Gas Systems
- 3.8.2 Component/ Subscription cost
- 3.8.2.1 Carrier Gas Cylinder (e.g., Argon, for GC-based units)
- 3.8.2.2 Annual Software & Data Analytics Subscription (per asset)
- 3.8.3 Real vs. perceived capacity constraints in supply of raw materials
- 3.8.1 Product cost
- 3.9 Supplier price increase validation future market trends
- 3.9.1 AI-driven predictive maintenance and autonomous grid management
- 3.9.2 Adoption of DGA-as-a-Service (DaaS) and subscription-based models
- 3.10 Risk assessment and mitigation
- 3.10.1 Regulatory compliance risks
- 3.10.2 Capacity constraint impact analysis
- 3.10.3 Technology transition risks
- 3.10.4 Pricing volatility and cost escalation risks
- 3.11 Porter's five forces analysis
- 3.12 PESTEL analysis
Chapter 4 Competitive Landscape, 2024
- 4.1 Introduction
- 4.2 Introduction
- 4.3 Company market share analysis
- 4.3.1 By region
- 4.3.1.1 North America
- 4.3.1.2 Europe
- 4.3.1.3 Asia Pacific
- 4.3.1.4 MEA
- 4.3.1.5 LATAM
- 4.3.1 By region
- 4.4 Company matrix analysis
- 4.5 Competitive analysis of major market players
- 4.6 Competitive positioning matrix
- 4.7 Key developments
- 4.7.1 Mergers & acquisitions
- 4.7.2 Partnerships & collaborations
- 4.7.3 New Product Launches
- 4.7.4 Expansion Plans
Chapter 5 Market Estimates & Forecast, By Product Type, 2021 - 2034 (USD Million) (Thousand Units)
- 5.1 Single-Gas Systems
- 5.2 Multi-Gas Systems
- 5.3 Others
Chapter 6 Market Estimates & Forecast, By Installation Type, 2021 - 2034 (USD Million) (Thousand Units)
- 6.1 Permanent Online Systems
- 6.2 Portable Field Units
- 6.3 Laboratory Integration Systems
- 6.4 Others
Chapter 7 Market Estimates & Forecast, By Extraction Type, 2021 - 2034 (USD Million) (Thousand Units)
- 7.1 Vacuum extraction
- 7.2 Headspace extraction
- 7.3 Stripper column method
- 7.4 Others
Chapter 8 Market Estimates & Forecast, By Fluid Type, 2021 - 2034 (USD Million) (Thousand Units)
- 8.1 Mineral Oil Systems
- 8.2 Natural Ester Systems
- 8.3 Synthetic Ester Systems
- 8.4 Silicone Fluid Systems
- 8.5 Others
Chapter 9 Market Estimates & Forecast, By Power Rating, 2021 - 2034 (USD Million) (Thousand Units)
- 9.1 100 - 500 MVA
- 9.2 501 - 800 MVA
- 9.3 801 - 1200 MVA
- 9.4 Others
Chapter 10 Market Estimates & Forecast, By Protocol Systems, 2021 - 2034 (USD Million) (Thousand Units)
- 10.1 Legacy Protocol Systems
- 10.2 Modern Digital Protocol Systems
- 10.3 Others
Chapter 11 Market Estimates & Forecast, By End Use Industry, 2021 - 2034 (USD Million) (Thousand Units)
- 11.1 Energy & Power
- 11.2 Chemical
- 11.3 Mining
- 11.4 Oil & Gas
- 11.5 Pulp & Paper
- 11.6 Others
Chapter 12 Market Estimates & Forecast, By Distribution Channel, 2021 - 2034 (USD Million) (Thousand Units)
- 12.1 Indirect sales
- 12.2 Direct sales
Chapter 13 Market Estimates & Forecast, By Region, 2021 - 2034 (USD Million) (Thousand Units)
- 13.1 Key trends
- 13.2 North America
- 13.2.1 U.S.
- 13.2.2 Canada
- 13.3 Europe
- 13.3.1 UK
- 13.3.2 Germany
- 13.3.3 France
- 13.3.4 Italy
- 13.3.5 Spain
- 13.3.6 Russia
- 13.4 Asia Pacific
- 13.4.1 China
- 13.4.2 India
- 13.4.3 Japan
- 13.4.4 South Korea
- 13.4.5 Australia
- 13.5 Latin America
- 13.5.1 Brazil
- 13.5.2 Mexico
- 13.6 MEA
- 13.6.1 South Africa
- 13.6.2 Saudi Arabia
- 13.6.3 UAE
Chapter 14 Company Profiles
- 14.1 ABB Ltd
- 14.2 GE Vernova Inc.
- 14.3 Siemens AG
- 14.4 Hitachi Energy Ltd
- 14.5 Qualitrol Company LLC
- 14.6 Doble Engineering Company
- 14.7 Vaisala Oyj
- 14.8 MTE Meter Test Equipment AG
- 14.9 Weidmann Electrical Technology AG
- 14.10 Advanced Energy Industries Inc.
- 14.11 Sieyuan Electric Co Ltd
- 14.12 Gatron GmbH
- 14.13 Morgan Schaffer
- 14.14 EMH Energie-Messtechnik
- 14.15 LumaSense Technologies

