


 |
市场调查报告书
商品编码
1871155
绿色氨生产市场机会、成长驱动因素、产业趋势分析及预测(2025-2034年)Green Ammonia Production Market Opportunity, Growth Drivers, Industry Trend Analysis, and Forecast 2025 - 2034 |
||||||
2024 年全球绿色氨生产市场价值为 28.1 亿美元,预计到 2034 年将以 6.3% 的复合年增长率增长至 76.6 亿美元。
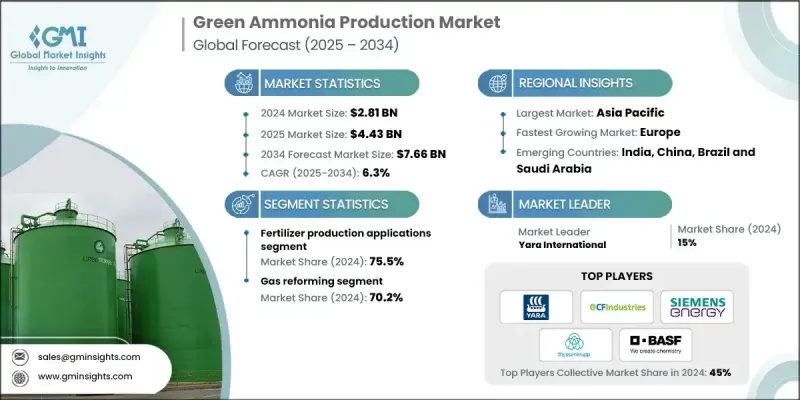
由于绿色氨作为一种新一代能源载体,兼具高效能、低成本生产和多功能性等优点,市场正蓬勃发展。绿色氨技术利用钙钛矿结构化合物作为吸光层,能够有效率地将太阳能转换为电能。低温溶液法製备工艺,例如旋涂、喷墨印刷和刮涂,显着降低了生产成本。绿色氨能够实现再生能源的长距离储存和输送,并正成为再生能源併网、发电和电网稳定的关键组成部分。拥有丰富再生资源的国家正在大力投资绿色氨出口项目,以供应再生能源能力有限的地区,使绿色氨成为全球贸易的低碳商品,并促进国际清洁能源合作和经济发展。
| 市场范围 | |
|---|---|
| 起始年份 | 2024 |
| 预测年份 | 2025-2034 |
| 起始值 | 28.1亿美元 |
| 预测值 | 76.6亿美元 |
| 复合年增长率 | 6.3% |
预计到2034年,製药业将以10.5%的复合年增长率成长,这主要得益于该产业对永续化学原料和特种化学品生产日益增长的需求。工业脱碳措施正促使製造商采用更环保的替代方案,从而创造了对经认证的绿色氨的高端需求。
2024年,天然气重整技术市占率达到70.2%,预计2034年将以5.5%的复合年增长率成长。该製程受益于现有的天然气基础设施、二氧化碳储存以及相比完全可再生氢能係统更低的资本成本。天然气重整技术使生产商能够在利用现有技术的同时减少排放,因此非常适合再生电力成本高或间歇性强的地区。碳定价、政策诱因以及氨作为一种低碳可交易商品的出现,进一步加速了该技术的普及应用。
预计到2024年,美国绿色氨生产市场规模将达到4.584亿美元,主要得益于政府的大力投入和策略性的研究计画。美国拥有丰富的风能和太阳能资源,这使得其能够以经济高效的方式生产绿色氢气,用于合成氨。此外,人们对永续农业实践的日益重视,也进一步推动了绿色氨作为传统肥料更清洁替代品的应用。
绿色氨生产市场的主要参与者包括Fertiberia、Enaex、Orsted、IFFCO、Nutrien、CF Industries Holdings Inc.、AM Green Ammonia、Statkraft、Talus Renewables、ACME Group、PT Pupuk Sriwidjaja Palembang (Pusri)、Scatec、BASF、ENGIE Pupuk Sriwidjaja Palembang (Pusri)、Scatec、BASF、ENGIE、CSBP、Grok Palembang、Gusri这些公司正致力于技术创新、策略合作和产能扩张,以巩固其市场地位。他们投资于低成本、高效率的生产方法以及可扩展的再生能源氨合成技术。与全球能源和化学企业的合作正在加速出口能力和市场渗透。此外,各企业也优先考虑认证和永续标准,以获得绿色氨的溢价。
目录
第一章:方法论与范围
第二章:执行概要
第三章:行业洞察
- 产业生态系统
- 监管环境
- 绿色氨生产厂
- 操作
- 计划
- 产业影响因素
- 成长驱动因素
- 产业陷阱与挑战
- 成长潜力分析
- 波特的分析
- PESTEL 分析
第四章:竞争格局
- 介绍
- 按地区分類的公司市占率分析
- 北美洲
- 欧洲
- 亚太地区
- 世界其他地区
- 战略仪錶板
- 策略倡议
- 公司标竿分析
- 创新与技术格局
第五章:市场规模及预测:依製程划分,2021-2034年
- 主要趋势
- 气体重整
- 水重整
- 其他的
第六章:市场规模及预测:依最终用途划分,2021-2034年
- 主要趋势
- 化肥生产
- 储能
- 电子燃料
- 製药
- 其他的
第七章:市场规模及预测:依地区划分,2021-2034年
- 主要趋势
- 北美洲
- 我们
- 加拿大
- 欧洲
- 德国
- 法国
- 义大利
- 英国
- 波兰
- 亚太地区
- 中国
- 印度
- 日本
- 韩国
- 澳洲
- 世界其他地区
第八章:公司简介
- ACME Group
- AM Green Ammonia
- BASF
- CSBP Limited
- CF Industries Holdings Inc.
- Envision Energy
- ENGIE
- Enaex
- First Ammonia
- Fertiberia
- Group DF
- IFFCO
- LSB Industries
- Nutrien
- Ørsted
- PT Pupuk Sriwidjaja Palembang (Pusri)
- Statkraft
- Scatec
- Talus Renewables
- Yara International
- Industry Segmentation
The Global Green Ammonia Production Market was valued at USD 2.81 Billion in 2024 and is estimated to grow at a CAGR of 6.3% to reach USD 7.66 Billion by 2034.
The market is gaining momentum due to green ammonia's role as a next-generation energy carrier that combines high efficiency, cost-effective production, and versatility. By using perovskite-structured compounds as light-absorbing layers, green ammonia technologies convert solar energy into electricity efficiently. Low-temperature solution-based fabrication methods, such as spin-coating, inkjet printing, and blade-coating, significantly reduce production costs. Green ammonia enables the storage and transport of renewable energy over long distances and is becoming a key component in renewable integration, power generation, and grid stabilization. Countries with abundant renewable resources are investing heavily in green ammonia export projects to supply regions with limited renewable capacity, transforming green ammonia into a globally traded, low-carbon commodity and fostering international clean energy collaboration and economic development.
| Market Scope | |
|---|---|
| Start Year | 2024 |
| Forecast Year | 2025-2034 |
| Start Value | $2.81 Billion |
| Forecast Value | $7.66 Billion |
| CAGR | 6.3% |
The pharmaceuticals segment is anticipated to grow at a CAGR of 10.5% through 2034, driven by the industry's growing interest in sustainable chemical feedstocks and specialty chemical production. Industrial decarbonization efforts are prompting manufacturers to adopt greener alternatives, creating premium demand for certified green ammonia.
The gas reforming segment held a 70.2% share in 2024 and is expected to grow at a 5.5% CAGR through 2034. This process benefits from existing natural gas infrastructure, access to CO2 storage, and lower capital costs compared to fully renewable hydrogen systems. Gas reforming allows producers to cut emissions while leveraging established technology, making it ideal for regions with high or intermittent renewable electricity costs. Carbon pricing, policy incentives, and the emergence of ammonia as a low-carbon tradeable commodity further accelerate adoption.
U.S. Green Ammonia Production Market was valued at USD 458.4 million by 2024, supported by strong government funding and strategic research initiatives. The U.S. benefits from abundant wind and solar resources, enabling cost-effective green hydrogen production for ammonia synthesis. Growing emphasis on sustainable agricultural practices is further driving the adoption of green ammonia as a cleaner alternative to conventional fertilizers.
Key players in the Green Ammonia Production Market include Fertiberia, Enaex, Orsted, IFFCO, Nutrien, CF Industries Holdings Inc., AM Green Ammonia, Statkraft, Talus Renewables, ACME Group, PT Pupuk Sriwidjaja Palembang (Pusri), Scatec, BASF, ENGIE, CSBP Limited, Group DF, Envision Energy, Yara International, and LSB Industries. Companies in the Green Ammonia Production Market are focusing on technological innovation, strategic partnerships, and capacity expansion to strengthen their market presence. Firms are investing in low-cost, high-efficiency production methods and scalable renewable energy integration for ammonia synthesis. Collaborations with global energy and chemical companies are accelerating export capabilities and market penetration. Players are also prioritizing certification and sustainability standards to command premium pricing for green ammonia.
Table of Contents
Chapter 1 Methodology & Scope
- 1.1 Research design
- 1.1.1 Research approach
- 1.1.2 Data collection methods
- 1.1.3 Base estimates and calculations
- 1.1.4 Base year calculation
- 1.1.5 Key trends for market estimates
- 1.2 Forecast model
- 1.3 Primary research & validation
- 1.3.1 Primary sources
- 1.4 Data mining sources
- 1.5 Market definitions
Chapter 2 Executive Summary
- 2.1 Industry 3600 synopsis, 2021 - 2034
- 2.2 Business trends
- 2.3 Process trends
- 2.4 End Use trends
- 2.5 Regional trends
Chapter 3 Industry Insights
- 3.1 Industry ecosystem
- 3.2 Regulatory landscape
- 3.3 Green ammonia production plants
- 3.3.1 Operational
- 3.3.2 Planned
- 3.4 Industry impact forces
- 3.4.1 Growth drivers
- 3.4.2 Industry pitfalls & challenges
- 3.5 Growth potential analysis
- 3.6 Porter's analysis
- 3.6.1 Bargaining power of suppliers
- 3.6.2 Bargaining power of buyers
- 3.6.3 Threat of new entrants
- 3.6.4 Threat of substitutes
- 3.7 PESTEL analysis
Chapter 4 Competitive landscape, 2025
- 4.1 Introduction
- 4.2 Company market share analysis, by region, 2024
- 4.2.1 North America
- 4.2.2 Europe
- 4.2.3 Asia Pacific
- 4.2.4 Rest of world
- 4.3 Strategic dashboard
- 4.4 Strategic initiatives
- 4.5 Company benchmarking
- 4.6 Innovation & technology landscape
Chapter 5 Market Size and Forecast, By Process, 2021 - 2034 (USD Million & Million Tonnes)
- 5.1 Key trends
- 5.2 Gas reforming
- 5.3 Water reforming
- 5.4 Others
Chapter 6 Market Size and Forecast, By End Use, 2021 - 2034 (USD Million & Million Tonnes)
- 6.1 Key trends
- 6.2 Fertilizer production
- 6.3 Energy storage
- 6.4 E-fuel
- 6.5 Pharmaceuticals
- 6.6 Others
Chapter 7 Market Size and Forecast, By Region, 2021 - 2034 (USD Million & Million Tonnes)
- 7.1 Key trends
- 7.2 North America
- 7.2.1 U.S.
- 7.2.2 Canada
- 7.3 Europe
- 7.3.1 Germany
- 7.3.2 France
- 7.3.3 Italy
- 7.3.4 UK
- 7.3.5 Poland
- 7.4 Asia Pacific
- 7.4.1 China
- 7.4.2 India
- 7.4.3 Japan
- 7.4.4 South Korea
- 7.4.5 Australia
- 7.5 Rest of World
Chapter 8 Company Profiles
- 8.1 ACME Group
- 8.2 AM Green Ammonia
- 8.3 BASF
- 8.4 CSBP Limited
- 8.5 CF Industries Holdings Inc.
- 8.6 Envision Energy
- 8.7 ENGIE
- 8.8 Enaex
- 8.9 First Ammonia
- 8.10 Fertiberia
- 8.11 Group DF
- 8.12 IFFCO
- 8.13 LSB Industries
- 8.14 Nutrien
- 8.15 Ørsted
- 8.16 PT Pupuk Sriwidjaja Palembang (Pusri)
- 8.17 Statkraft
- 8.18 Scatec
- 8.19 Talus Renewables
- 8.20 Yara International
- 8.21 Industry Segmentation
 利用废弃物生物质生产绿色氢气的市场预测—全球製程、原料、技术、应用、最终用户和地区分析—2034年
 全球氨燃料市场:市场规模、份额、趋势分析(按产品、应用和地区划分)、细分市场预测(2025-2033 年)