


 |
市场调查报告书
商品编码
1876603
零售受众测量解决方案市场机会、成长驱动因素、产业趋势分析及预测(2025-2034 年)Retail Audience Measurement Solutions Market Opportunity, Growth Drivers, Industry Trend Analysis, and Forecast 2025 - 2034 |
||||||
2024 年全球零售受众测量解决方案市场价值为 15 亿美元,预计到 2034 年将以 15.9% 的复合年增长率增长至 66 亿美元。
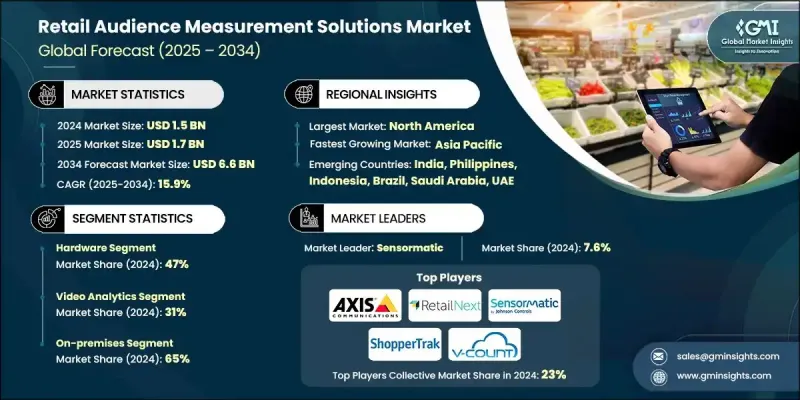
实体零售环境的快速数位转型正在重塑店内分析格局。人工智慧、电脑视觉和感测器融合等先进技术使零售商能够即时洞察顾客行为,包括客流量、停留时间和人口统计资料。这些洞察使品牌能够基于数据做出关于店铺布局、商品策略和营运效率的决策,同时严格遵守资料隐私法规。这些系统的整合减少了店舖管理中的低效环节,提高了转换率,并增强了全通路客户体验。分析提供者、硬体製造商和人工智慧软体开发人员之间的合作正在加速创新,从而催生出端到端的受众测量平台。市场参与者也正在利用云端原生基础设施、隐私保护型人工智慧模型和多感测器分析功能来升级其软体生态系统。这些进步正在促进高度可扩展、合规且精准的受众测量系统的部署,从而改变零售商优化业绩和提升消费者在实体零售空间参与度的方式。
| 市场范围 | |
|---|---|
| 起始年份 | 2024 |
| 预测年份 | 2025-2034 |
| 起始值 | 15亿美元 |
| 预测值 | 66亿美元 |
| 复合年增长率 | 15.9% |
硬体领域占据47%的市场份额,预计到2034年将以15.1%的复合年增长率成长。硬体有助于从零售环境中收集精准的即时资料。摄影机、热感应器、Wi-Fi和蓝牙追踪器以及智慧计数器等设备构成了客流追踪系统的核心。零售商越来越重视耐用且可扩展的硬体解决方案,这些方案能够与分析平台无缝集成,从而提供准确的洞察。这项转变的驱动力在于对智慧门市基础设施日益增长的需求,而人工智慧驱动的决策在很大程度上依赖可靠且高品质的资料收集。
2024年,视讯分析领域约占市场占有率的31%,预计2025年至2034年间将以超过16.5%的复合年增长率成长。该领域的领先地位源于其能够产生关于消费者行为、客流量和排队管理的详细即时洞察。透过采用人工智慧驱动的影片分析,零售商可以优化店铺布局、提升产品陈列效果并改善店内互动。这项技术使零售商能够监控客流模式、识别客流高峰时段并分析顾客停留时间,从而帮助他们做出数据驱动的决策,提高销售效率和营运绩效。
美国零售受众测量解决方案市场占85%的份额,预计2024年市场规模将达到4.793亿美元。在数位转型计画以及人工智慧和云端分析技术日益普及的推动下,美国零售业正经历着快速变革。先进的受众洞察技术正在革新门市运营,提升行销效率,并确保符合隐私法规。联邦和州政府层级支持数位创新和资料治理的政策,正鼓励零售商投资先进且符合隐私权法规的测量平台。
全球零售受众测量解决方案市场的主要参与者包括 Dor Technologies、Quividi、RetailNext、Axis Communications、Sensormatic、Broox Technologies、Advertima、V-Count、ShopperTrak(泰科集团旗下)和 Density。这些公司正采取以创新、合作和数据驱动优化为核心的策略来拓展市场。许多公司正大力投资人工智慧、机器学习和电脑视觉技术,以提高店内分析的准确性。软体开发商和硬体製造商之间的策略合作正在推动整合式端到端系统的建置。此外,各公司也正在向云端和边缘运算平台转型,以实现更快、可扩展且符合隐私保护要求的资料处理。
目录
第一章:方法论
- 市场范围和定义
- 研究设计
- 研究方法
- 资料收集方法
- 资料探勘来源
- 全球的
- 地区/国家
- 基准估算和计算
- 基准年计算
- 市场估算的关键趋势
- 初步研究和验证
- 原始资料
- 预测模型
- 研究假设和局限性
第二章:执行概要
第三章:行业洞察
- 产业生态系分析
- 供应商格局
- 利润率分析
- 成本结构
- 每个阶段的价值增加
- 影响价值链的因素
- 中断
- 产业影响因素
- 成长驱动因素
- 人工智慧和电脑视觉技术的应用日益普及
- 店内业绩和投资报酬率分析的需求激增
- 全通路和数据驱动型零售策略的成长
- 对健康、安全和入住率监测的需求不断增长
- 产业陷阱与挑战
- 严格的资料隐私和消费者保护法规
- 系统整合和资料管理的复杂性
- 市场机会
- 零售媒体网路和受众货币化的扩展
- 中小企业和加盟零售商对基于 SaaS 的采用率不断提高
- 在购物中心、机场和公共场所的部署量不断增长
- 即时分析与自动化系统的融合日益增强
- 成长驱动因素
- 成长潜力分析
- 监管环境
- 北美洲
- 欧洲
- 亚太地区
- 拉丁美洲
- 波特的分析
- PESTEL 分析
- 技术与创新格局
- 当前技术趋势
- 新兴技术
- 专利分析
- 价格趋势
- 按地区
- 搭车
- 成本細項分析
- 商业案例及投资报酬率分析
- 总拥有成本框架
- 投资报酬率计算方法
- 实施时间表和里程碑
- 风险评估与缓解策略
- 永续性和环境影响分析
- 永续实践
- 减少废弃物策略
- 生产中的能源效率
- 环保倡议
- 碳足迹考量
- 未来展望与机会
- 新兴应用机会
- 投资需求及资金来源
- 风险评估与缓解策略
- 针对市场参与者的策略建议
- 客户成功指标与KPI框架
- 供应商评估与选择标准
- 实施时间表和专案管理
- 变革管理及组织影响
第四章:竞争格局
- 介绍
- 公司市占率分析
- 北美洲
- 欧洲
- 亚太地区
- 拉丁美洲
- 主要市场参与者的竞争分析
- 竞争定位矩阵
- 战略展望矩阵
- 关键进展
- 併购
- 合作伙伴关係与合作
- 新产品发布
- 扩张计划和资金
第五章:市场估算与预测:依组件划分,2021-2034年
- 主要趋势
- 硬体
- 感应器
- 相机
- 网路装置
- 软体
- 分析仪表板
- 数据视觉化和人工智慧模组
- API集成
- 服务
- 安装和校准
- 管理分析和报告
- 维护与支援
第六章:市场估算与预测:依应用领域划分,2021-2034年
- 主要趋势
- 客流量和人流量
- 队列管理
- 店铺布局及陈列图优化
- 人口统计和行为分析
- 其他的
第七章:市场估计与预测:依技术划分,2021-2034年
- 主要趋势
- 影片分析
- 红外线/热感
- 3D立体视觉感测器
- Wi-Fi/蓝牙追踪
- 人工智慧和机器学习演算法
- 其他
第八章:市场估算与预测:依部署模式划分,2021-2034年
- 主要趋势
- 本地部署
- 云
- 杂交种
第九章:市场估算与预测:依最终用途划分,2021-2034年
- 主要趋势
- 超市和大型超市
- 便利商店
- 百货公司
- 专卖店
- 其他的
第十章:市场估计与预测:依地区划分,2021-2034年
- 主要趋势
- 北美洲
- 我们
- 加拿大
- 欧洲
- 德国
- 英国
- 法国
- 义大利
- 西班牙
- 俄罗斯
- 亚太地区
- 中国
- 印度
- 日本
- 澳洲
- 韩国
- 菲律宾
- 印尼
- 拉丁美洲
- 巴西
- 墨西哥
- 阿根廷
- MEA
- 南非
- 沙乌地阿拉伯
- 阿联酋
第十一章:公司简介
- 全球参与者
- Advertima
- Axis Communications
- Broox Technologies
- Circana
- Comscore
- Density
- Dor Technologies
- Nielsen
- Oracle
- Quividi
- RetailNext
- Sensormatic
- ShopperTrak (Tyco)
- The Trade Desk
- V-Count
- 区域玩家
- Criteo
- Databricks
- InfoSum
- iSpot.tv
- LiveRamp
- MetaRouter
- Palantir Technologies
- Snowflake
- 新兴参与者
- Amplitude
- FullStory
- Heap
- Hotjar
- LogRocket
- Mixpanel
- Quantum Metric
The Global Retail Audience Measurement Solutions Market was valued at USD 1.5 billion in 2024 and is estimated to grow at a CAGR of 15.9% to reach USD 6.6 billion by 2034.
The rapid digital transformation of physical retail environments is reshaping the in-store analytics landscape. Advanced technologies such as artificial intelligence, computer vision, and sensor fusion are enabling retailers to capture real-time insights into shopper behavior, including footfall, dwell time, and demographic data. These insights empower brands to make data-driven decisions on store layouts, merchandising strategies, and operational efficiency while maintaining strict data privacy compliance. The integration of these systems reduces inefficiencies in store management, enhances conversion rates, and strengthens the omnichannel customer experience. Collaboration among analytics providers, hardware manufacturers, and AI software developers is accelerating innovation, resulting in end-to-end audience measurement platforms. Market participants are also modernizing their software ecosystems with cloud-native infrastructure, privacy-preserving AI models, and multi-sensor analytics capabilities. These advancements are facilitating the deployment of highly scalable, compliant, and accurate audience measurement systems that transform how retailers optimize performance and enhance consumer engagement in physical retail spaces.
| Market Scope | |
|---|---|
| Start Year | 2024 |
| Forecast Year | 2025-2034 |
| Start Value | $1.5 Billion |
| Forecast Value | $6.6 Billion |
| CAGR | 15.9% |
The hardware segment held a 47% share and is expected to grow at a CAGR of 15.1% through 2034. Hardware helps in collecting precise, real-time data from retail environments. Devices such as cameras, thermal sensors, Wi-Fi and Bluetooth trackers, and smart counters form the backbone of audience tracking systems. Retailers are increasingly prioritizing durable and scalable hardware solutions that seamlessly integrate with analytics platforms to deliver accurate insights. This shift is driven by the rising demand for intelligent store infrastructures, where AI-driven decisions depend heavily on reliable and high-quality data collection.
The video analytics segment accounted for approximately 31% of the market share in 2024 and is forecasted to grow at a CAGR of more than 16.5% between 2025 and 2034. The dominance of this segment stems from its ability to generate detailed, real-time insights into consumer behavior, foot traffic, and queue management. By adopting AI-powered video analytics, retailers can refine store layouts, enhance product placement, and improve in-store interactions. This technology allows retailers to monitor customer flow patterns, identify peak activity hours, and analyze dwell times, helping them make data-backed decisions to increase sales efficiency and operational performance.
United States Retail Audience Measurement Solutions Market held an 85% share, generating USD 479.3 million in 2024. The U.S. retail landscape is undergoing rapid evolution, fueled by large-scale digital transformation initiatives and the increasing adoption of AI and cloud-based analytics. Enhanced audience insight technologies are revolutionizing in-store operations, improving marketing effectiveness, and ensuring compliance with privacy regulations. Supportive federal and state-level policies promoting digital innovation and data governance are encouraging retailers to invest in sophisticated, privacy-compliant measurement platforms.
Prominent companies operating in the Global Retail Audience Measurement Solutions Market include Dor Technologies, Quividi, RetailNext, Axis Communications, Sensormatic, Broox Technologies, Advertima, V-Count, ShopperTrak (Tyco), and Density. Companies in the Retail Audience Measurement Solutions Market are adopting strategies centered on innovation, partnerships, and data-driven optimization to expand their market reach. Many are investing heavily in AI, machine learning, and computer vision to enhance the accuracy of in-store analytics. Strategic collaborations between software developers and hardware manufacturers are fostering the creation of integrated end-to-end systems. Firms are also transitioning to cloud-based and edge computing platforms to deliver faster, scalable, and privacy-compliant data processing.
Table of Contents
Chapter 1 Methodology
- 1.1 Market scope and definition
- 1.2 Research design
- 1.2.1 Research approach
- 1.2.2 Data collection methods
- 1.3 Data mining sources
- 1.3.1 Global
- 1.3.2 Regional/Country
- 1.4 Base estimates and calculations
- 1.4.1 Base year calculation
- 1.4.2 Key trends for market estimation
- 1.5 Primary research and validation
- 1.5.1 Primary sources
- 1.6 Forecast model
- 1.7 Research assumptions and limitations
Chapter 2 Executive Summary
- 2.1 Industry 360° synopsis, 2021 - 2034
- 2.2 Key market trends
- 2.2.1 Regional
- 2.2.2 Component
- 2.2.3 Technology
- 2.2.4 Deployment Mode
- 2.2.5 End Use
- 2.2.6 Application
- 2.3 TAM Analysis, 2025-2034
- 2.4 CXO perspectives: Strategic imperatives
- 2.4.1 Executive decision points
- 2.4.2 Critical success factors
- 2.5 Future outlook and strategic recommendations
Chapter 3 Industry Insights
- 3.1 Industry ecosystem analysis
- 3.1.1 Supplier landscape
- 3.1.2 Profit margin analysis
- 3.1.3 Cost structure
- 3.1.4 Value addition at each stage
- 3.1.5 Factor affecting the value chain
- 3.1.6 Disruptions
- 3.2 Industry impact forces
- 3.2.1 Growth drivers
- 3.2.1.1 Increase in adoption of AI and computer-vision technologies
- 3.2.1.2 Surge in demand for in-store performance and ROI analytics
- 3.2.1.3 Growth in omnichannel and data-driven retail strategies
- 3.2.1.4 Rise in demand for health, safety, and occupancy monitoring
- 3.2.2 Industry pitfalls and challenges
- 3.2.2.1 Stringent data privacy and consumer protection regulations
- 3.2.2.2 Complexity in system integration and data management
- 3.2.3 Market opportunities
- 3.2.3.1 Expansion of retail media networks and audience monetization
- 3.2.3.2 Increase in SaaS-based adoption among SMB and franchise retailers
- 3.2.3.3 Growth in deployments across malls, airports, and public spaces
- 3.2.3.4 Rising integration of real-time analytics with automation systems
- 3.2.1 Growth drivers
- 3.3 Growth potential analysis
- 3.4 Regulatory landscape
- 3.4.1 North America
- 3.4.2 Europe
- 3.4.3 Asia Pacific
- 3.4.4 LAMEA
- 3.5 Porter's analysis
- 3.6 PESTEL analysis
- 3.7 Technology and Innovation landscape
- 3.7.1 Current technological trends
- 3.7.2 Emerging technologies
- 3.8 Patent analysis
- 3.9 Price trends
- 3.9.1 By region
- 3.9.2 By vehicle
- 3.10 Cost breakdown analysis
- 3.11 Business Case & ROI Analysis
- 3.11.1 Total cost of ownership framework
- 3.11.2 ROI calculation methodologies
- 3.11.3 Implementation timeline & milestones
- 3.11.4 Risk assessment & mitigation strategies
- 3.12 Sustainability and environmental impact analysis
- 3.12.1 Sustainable practices
- 3.12.2 Waste reduction strategies
- 3.12.3 Energy efficiency in production
- 3.12.4 Eco-friendly initiatives
- 3.12.5 Carbon footprint considerations
- 3.13 Future outlook & opportunities
- 3.13.1 Emerging Application Opportunities
- 3.13.2 Investment Requirements & Funding Sources
- 3.13.3 Risk Assessment & Mitigation Strategies
- 3.13.4 Strategic Recommendations for Market Participants
- 3.14 Customer success metrics & KPI framework
- 3.15 Vendor evaluation & selection criteria
- 3.16 Implementation timelines & project management
- 3.17 Change management & organizational impact
Chapter 4 Competitive Landscape, 2024
- 4.1 Introduction
- 4.2 Company market share analysis
- 4.2.1 North America
- 4.2.2 Europe
- 4.2.3 Asia Pacific
- 4.2.4 LAMEA
- 4.3 Competitive analysis of major market players
- 4.4 Competitive positioning matrix
- 4.5 Strategic outlook matrix
- 4.6 Key developments
- 4.6.1 Mergers & acquisitions
- 4.6.2 Partnerships & collaborations
- 4.6.3 New Product Launches
- 4.6.4 Expansion Plans and funding
Chapter 5 Market Estimates & Forecast, By Component, 2021 - 2034 ($Bn, Units)
- 5.1 Key trends
- 5.2 Hardware
- 5.2.1 Sensors
- 5.2.2 Cameras
- 5.2.3 Network Devices
- 5.3 Software
- 5.3.1 Analytics dashboard
- 5.3.2 Data visualization and AI modules
- 5.3.3 API integrations
- 5.4 Services
- 5.4.1 Installation and calibration
- 5.4.2 Managed analytics & reporting
- 5.4.3 Maintenance & support
Chapter 6 Market Estimates & Forecast, By Application, 2021 - 2034 ($Bn, Units)
- 6.1 Key trends
- 6.2 Customer Traffic & Footfall
- 6.3 Queue Management
- 6.4 Store Layout & Planogram Optimization
- 6.5 Demographic & Behavioral Profiling
- 6.6 Others
Chapter 7 Market Estimates & Forecast, By Technology, 2021 - 2034 ($Bn, Units)
- 7.1 Key trends
- 7.2 Video Analytics
- 7.3 Infrared / Thermal Sensing
- 7.4 3D Stereo Vision Sensors
- 7.5 Wi-Fi / Bluetooth Tracking
- 7.6 AI & Machine Learning Algorithms
- 7.7 Other
Chapter 8 Market Estimates & Forecast, By Deployment Mode, 2021 - 2034 ($Bn, Units)
- 8.1 Key trends
- 8.2 On-Premises
- 8.3 Cloud
- 8.4 Hybrid
Chapter 9 Market Estimates & Forecast, By End Use, 2021 - 2034 ($Bn, Units)
- 9.1 Key trends
- 9.2 Supermarkets & Hypermarkets
- 9.3 Convenience stores
- 9.4 Department stores
- 9.5 Specialty stores
- 9.6 Others
Chapter 10 Market Estimates & Forecast, By Region, 2021 - 2034 ($Bn, Units)
- 10.1 Key trends
- 10.2 North America
- 10.2.1 US
- 10.2.2 Canada
- 10.3 Europe
- 10.3.1 Germany
- 10.3.2 UK
- 10.3.3 France
- 10.3.4 Italy
- 10.3.5 Spain
- 10.3.6 Russia
- 10.4 Asia Pacific
- 10.4.1 China
- 10.4.2 India
- 10.4.3 Japan
- 10.4.4 Australia
- 10.4.5 South Korea
- 10.4.6 Philippines
- 10.4.7 Indonesia
- 10.5 Latin America
- 10.5.1 Brazil
- 10.5.2 Mexico
- 10.5.3 Argentina
- 10.6 MEA
- 10.6.1 South Africa
- 10.6.2 Saudi Arabia
- 10.6.3 UAE
Chapter 11 Company Profiles
- 11.1 Global Players
- 11.1.1 Advertima
- 11.1.2 Axis Communications
- 11.1.3 Broox Technologies
- 11.1.4 Circana
- 11.1.5 Comscore
- 11.1.6 Density
- 11.1.7 Dor Technologies
- 11.1.8 Nielsen
- 11.1.9 Oracle
- 11.1.10 Quividi
- 11.1.11 RetailNext
- 11.1.12 Sensormatic
- 11.1.13 ShopperTrak (Tyco)
- 11.1.14 The Trade Desk
- 11.1.15 V-Count
- 11.2 Regional Players
- 11.2.1 Criteo
- 11.2.2 Databricks
- 11.2.3 InfoSum
- 11.2.4 iSpot.tv
- 11.2.5 LiveRamp
- 11.2.6 MetaRouter
- 11.2.7 Palantir Technologies
- 11.2.8 Snowflake
- 11.3 Emerging Players
- 11.3.1 Amplitude
- 11.3.2 FullStory
- 11.3.3 Heap
- 11.3.4 Hotjar
- 11.3.5 LogRocket
- 11.3.6 Mixpanel
- 11.3.7 Quantum Metric
 通讯测试与测量市场分析及预测(至2035年):依类型、产品、服务、技术、组件、应用、设备、部署类型、最终用户与功能划分
 通讯测试与测量市场(按服务提供、技术、测试环境、分销管道和最终用户)—2025-2032 年全球预测
 零售受众测量解决方案市场规模、份额和趋势分析报告:按组件、应用、最终用途、地区和细分市场预测,2025 年至 2033 年
 通讯测试与测量市场机会、成长动力、产业趋势分析及 2025 - 2034 年预测
 到 2030 年的通讯测试和测量市场预测:按产品类型、测试类型、产品、技术、应用、最终用户和地区进行的全球分析
 全球通讯测试和测量市场规模、份额和趋势分析报告,按测试解决方案(有线和无线)、产品(硬体、软体和服务)、测试类型、最终用户、区域展望和预测, 2024 - 2031
 通讯测试和测量市场:按产品、测试解决方案、测试类型、最终用户、地区划分 - 到 2029 年的预测