


 |
市场调查报告书
商品编码
1876657
溶剂回收系统市场机会、成长驱动因素、产业趋势分析及预测(2025-2034年)Solvent Recovery Systems Market Opportunity, Growth Drivers, Industry Trend Analysis, and Forecast 2025 - 2034 |
||||||
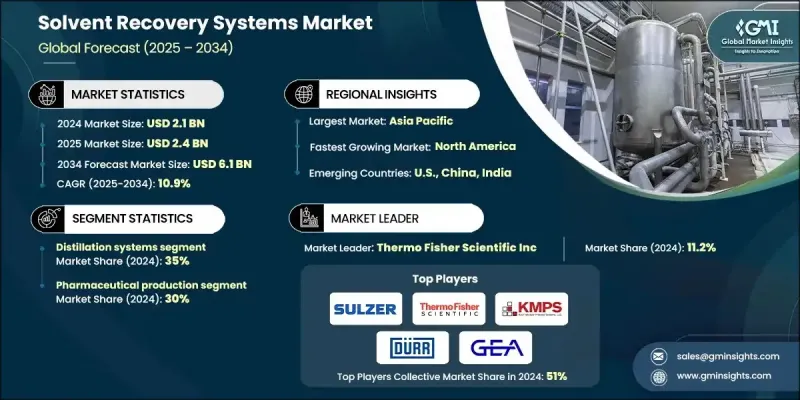
2024 年全球溶剂回收系统市场价值为 21 亿美元,预计到 2034 年将以 10.9% 的复合年增长率增长至 61 亿美元。
强劲的成长前景表明,各行业正迅速向永续营运、更严格的环境管理和更高的生产效率转型。全球监管机构持续严格限制挥发性有机化合物(VOC)排放和危险废弃物,并鼓励企业采用溶剂回收而非处置的解决方案。区域和国家环境框架下日益严格的合规要求促使製造商投资高性能回收系统。同时,这些解决方案也带来了显着的成本优势,使企业能够减少高达50%的溶剂采购和废弃物管理支出,通常两年内即可收回成本。采用薄膜技术的更先进回收技术如今更胜一筹,与传统蒸馏相比,可降低高达40%的能源消耗和资本支出。随着各产业越来越重视资源循环利用,溶剂回收系统正成为营运规划和长期永续发展目标的重要组成部分。
| 市场范围 | |
|---|---|
| 起始年份 | 2024 |
| 预测年份 | 2025-2034 |
| 起始值 | 21亿美元 |
| 预测值 | 61亿美元 |
| 复合年增长率 | 10.9% |
真空蒸馏技术预计在2024年将占据25%的市场份额,因为该技术对高温下易降解的溶剂非常有效。这些系统在减压条件下运行,可在较低温度下进行分离,同时确保溶剂的品质。其效率通常可达90-95%,所提供的纯度水准足以满足对控制标准要求严格的应用需求。
预计到2024年,製药製造业将占据30%的市场份额,这主要得益于对纯度的高要求以及对良好生产规范(GMP)的严格遵守。许多工厂需要能够达到99%以上纯度的回收系统来支持活性成分的生产,这推动了真空蒸馏和有机溶剂奈米过滤技术的应用。这些系统在保障产品完整性的同时,也最大限度地提高了溶剂的再利用率。随着企业遵守严格的监管要求,需要进行全面的流程跟踪,具备内建文件功能的自动化设备也变得至关重要。
2024年美国溶剂回收系统市场规模为3.232亿美元,预计2034年将达9.3亿美元。北美在2024年占据19.8%的市场份额,这主要得益于美国环保署(EPA)更严格的指令以及对工业可持续发展日益增长的承诺。旨在减少挥发性有机化合物(VOC)排放的联邦法规持续推动众多製造领域的系统安装。随着製药业在关键地区的扩张,对符合GMP和FDA要求的回收解决方案的需求依然旺盛,进一步促进了整体市场成长。
溶剂回收系统市场的主要参与者包括 Maratek Environmental、Thermo Fisher Scientific、Durr Group、Spooner AMCEC、Sulzer、Hydrite Chemical、鸿益环保设备、CBG Biotech、Koch Modular Process Systems、OFRU Recycling 和 GEA Group。这些公司依靠多种核心策略来提升其竞争力。许多公司大力投资先进的分离技术,以提高能源效率、降低营运成本,并支援对溶剂回收要求较高的应用。此外,各公司也专注于模组化和可客製化的系统设计,以满足不同产业的需求。扩大全球製造能力和建立区域服务网路有助于缩短交货週期并加强客户支援。
目录
第一章:方法论与范围
第二章:执行概要
第三章:行业洞察
- 产业生态系分析
- 供应商格局
- 利润率
- 每个阶段的价值增加
- 影响价值链的因素
- 中断
- 产业影响因素
- 成长驱动因素
- 产业陷阱与挑战
- 市场机会
- 成长潜力分析
- 监管环境
- 北美洲
- 欧洲
- 亚太地区
- 拉丁美洲
- 中东和非洲
- 波特的分析
- PESTEL 分析
- 价格趋势
- 按地区
- 未来市场趋势
- 技术与创新格局
- 当前技术趋势
- 新兴技术
- 专利格局
- 贸易统计(HS编码)(註:仅提供重点国家的贸易统计资料)
- 主要进口国
- 主要出口国
- 永续性和环境方面
- 永续实践
- 减少废弃物策略
- 生产中的能源效率
- 环保倡议
- 碳足迹考量
第四章:竞争格局
- 介绍
- 公司市占率分析
- 按地区
- 北美洲
- 欧洲
- 亚太地区
- 拉丁美洲
- 中东和非洲
- 按地区
- 公司矩阵分析
- 主要市场参与者的竞争分析
- 竞争定位矩阵
- 关键进展
- 併购
- 合作伙伴关係与合作
- 新产品发布
- 扩张计划
第五章:市场规模及预测:依製程类型划分,2021-2034年
- 主要趋势
- 蒸馏系统
- 真空蒸馏系统
- 膜分离系统
- 微波增强恢復系统
- 吸附系统
第六章:市场规模及预测:依应用领域划分,2021-2034年
- 主要趋势
- 汽车製造
- 喷漆车间及涂装作业
- 零件清洁和除油
- 组装过程中的溶剂混合与回收
- 电池製造(电动车和混合动力车)
- 其他的
- 药品生产
- 活性药物成分(API)生产
- 实验室溶剂回收
- 其他的
- 印刷与包装
- 柔版印刷
- 凹版印刷
- 平版印刷
- 其他的
- 电子製造
- PCB製造与清洗
- 半导体晶圆加工
- 其他的
- 航太与国防
- 复合材料製造
- 表面处理与准备
- 维护、修理和大修 (MRO)
- 其他的
- 化学加工
- 其他的
第七章:市场规模及预测:依安装类型划分,2021-2034年
- 主要趋势
- 现场系统
- 异地系统
第八章:市场规模及预测:依地区划分,2021-2034年
- 主要趋势
- 北美洲
- 我们
- 加拿大
- 欧洲
- 英国
- 德国
- 法国
- 义大利
- 西班牙
- 欧洲其他地区
- 亚太地区
- 中国
- 印度
- 日本
- 韩国
- 澳洲
- 亚太其他地区
- 拉丁美洲
- 巴西
- 墨西哥
- 阿根廷
- 拉丁美洲其他地区
- 中东和非洲
- 南非
- 沙乌地阿拉伯
- 阿联酋
- 中东和非洲其他地区
第九章:公司简介
- Sulzer
- Thermo Fisher Scientific
- Koch Modular Process Systems
- Durr Group
- GEA Group
- Hydrite Chemical
- Maratek Environmental
- OFRU Recycling
- HongYi Environmental Equipment
- Spooner AMCEC
- CBG Biotech
- NexGen Enviro Systems
- TruSteel
- CleanPlanet Chemical
- Progressive Recovery
The Global Solvent Recovery Systems Market was valued at USD 2.1 billion in 2024 and is estimated to grow at a CAGR of 10.9% to reach USD 6.1 billion by 2034.
The strong growth outlook shows how quickly industries are moving toward sustainable operations, stricter environmental management, and improved production efficiency. Regulatory bodies worldwide continue enforcing aggressive limits on VOC emissions and hazardous waste, encouraging companies to adopt solutions that recover solvents rather than dispose of them. Increasing compliance demands under regional and national environmental frameworks have pushed manufacturers to invest in high-performance recovery systems. At the same time, these solutions deliver major cost advantages, enabling companies to reduce their solvent purchasing and waste management spending by up to 50%, with typical payback times often occurring within two years. More advanced recovery technologies using membranes now offer additional benefits, cutting energy use and capital expenses by as much as 40% compared with traditional distillation. As industries place greater emphasis on circular resource usage, solvent recovery systems are becoming an essential part of operational planning and long-term sustainability goals.
| Market Scope | |
|---|---|
| Start Year | 2024 |
| Forecast Year | 2025-2034 |
| Start Value | $2.1 Billion |
| Forecast Value | $6.1 Billion |
| CAGR | 10.9% |
The vacuum distillation technologies segment accounted for a 25% share in 2024, as they are effective for solvents that degrade under high heat. These systems operate under reduced pressure, allowing separation at lower temperatures while protecting solvent quality. Their efficiency ratings commonly reach 90-95%, providing purity levels suited for applications that require stringent control standards.
The pharmaceutical manufacturing segment held a 30% share in 2024, driven by demanding purity expectations and unwavering adherence to Good Manufacturing Practice guidelines. Many facilities require recovery systems capable of achieving purity levels above 99% to support active ingredient production, which fuels the adoption of vacuum distillation and organic solvent nanofiltration technologies. These systems safeguard product integrity while maximizing solvent reuse. Automated equipment with built-in documentation capabilities is also becoming essential as companies follow strict regulatory mandates that require comprehensive process tracking.
U.S. Solvent Recovery Systems Market generated USD 323.2 million in 2024 and is projected to reach USD 930 million by 2034. North America held a 19.8% share in 2024, supported by tougher EPA directives and a growing commitment to industrial sustainability. Federal regulations designed to reduce VOC emissions continue to accelerate system installations across many manufacturing segments. As the pharmaceutical sector expands in key regions, demand for recovery solutions that align with GMP and FDA expectations remains high, strengthening overall market growth.
Key companies participating in the Solvent Recovery Systems Market include Maratek Environmental, Thermo Fisher Scientific, Durr Group, Spooner AMCEC, Sulzer, Hydrite Chemical, HongYi Environmental Equipment, CBG Biotech, Koch Modular Process Systems, OFRU Recycling, and GEA Group. Companies in the Solvent Recovery Systems Market rely on several core strategies to expand their competitive standing. Many invest heavily in advanced separation technologies that improve energy efficiency, reduce operating costs, and support high-purity recovery for sensitive applications. Firms also focus on modular and customizable system designs to meet the needs of diverse industries. Expanding global manufacturing capability and building regional service networks help shorten lead times and strengthen customer support.
Table of Contents
Chapter 1 Methodology & Scope
- 1.1 Market scope and definition
- 1.2 Research design
- 1.2.1 Research approach
- 1.2.2 Data collection methods
- 1.3 Data mining sources
- 1.3.1 Global
- 1.3.2 Regional/Country
- 1.4 Base estimates and calculations
- 1.4.1 Base year calculation
- 1.4.2 Key trends for market estimation
- 1.5 Primary research and validation
- 1.5.1 Primary sources
- 1.6 Forecast model
- 1.7 Research assumptions and limitations
Chapter 2 Executive Summary
- 2.1 Industry 3600 synopsis
- 2.2 Key market trends
- 2.2.1 Process type
- 2.2.2 Application
- 2.2.3 Installation type
- 2.3 TAM analysis, 2025-2034
- 2.4 CXO perspectives: Strategic imperatives
- 2.4.1 Executive decision points
- 2.4.2 Critical success factors
- 2.5 Outlook and strategic recommendations
Chapter 3 Industry Insights
- 3.1 Industry ecosystem analysis
- 3.1.1 Supplier landscape
- 3.1.2 Profit margin
- 3.1.3 Value addition at each stage
- 3.1.4 Factor affecting the value chain
- 3.1.5 Disruptions
- 3.2 Industry impact forces
- 3.2.1 Growth drivers
- 3.2.2 Industry pitfalls and challenges
- 3.2.3 Market opportunities
- 3.3 Growth potential analysis
- 3.4 Regulatory landscape
- 3.4.1 North America
- 3.4.2 Europe
- 3.4.3 Asia Pacific
- 3.4.4 Latin America
- 3.4.5 Middle East & Africa
- 3.5 Porter's analysis
- 3.6 PESTEL analysis
- 3.7 Price trends
- 3.7.1 By region
- 3.8 Future market trends
- 3.9 Technology and innovation landscape
- 3.9.1 Current technological trends
- 3.9.2 Emerging technologies
- 3.10 Patent landscape
- 3.11 Trade statistics (HS code) (Note: the trade statistics will be provided for key countries only)
- 3.11.1 Major importing countries
- 3.11.2 Major exporting countries
- 3.12 Sustainability and environmental aspects
- 3.12.1 Sustainable practices
- 3.12.2 Waste reduction strategies
- 3.12.3 Energy efficiency in production
- 3.12.4 Eco-friendly initiatives
- 3.13 Carbon footprint considerations
Chapter 4 Competitive Landscape, 2024
- 4.1 Introduction
- 4.2 Company market share analysis
- 4.2.1 By region
- 4.2.1.1 North America
- 4.2.1.2 Europe
- 4.2.1.3 Asia Pacific
- 4.2.1.4 Latin America
- 4.2.1.5 Middle East & Africa
- 4.2.1 By region
- 4.3 Company matrix analysis
- 4.4 Competitive analysis of major market players
- 4.5 Competitive positioning matrix
- 4.6 Key developments
- 4.6.1 Mergers & acquisitions
- 4.6.2 Partnerships & collaborations
- 4.6.3 New product launches
- 4.6.4 Expansion plans
Chapter 5 Market Size and Forecast, By Process Type, 2021-2034 (USD Billion, Kilo Tons)
- 5.1 Key trends
- 5.2 Distillation systems
- 5.3 Vacuum distillation systems
- 5.4 Membrane separation systems
- 5.5 Microwave-enhanced recovery systems
- 5.6 Adsorption systems
Chapter 6 Market Size and Forecast, By Application, 2021-2034 (USD Billion, Kilo Tons)
- 6.1 Key trends
- 6.2 Automotive manufacturing
- 6.2.1 Paint shop & coating operations
- 6.2.2 Parts cleaning & degreasing
- 6.2.3 Solvent blending & recycling in assembly
- 6.2.4 Battery manufacturing (EVs & hybrids)
- 6.2.5 Others
- 6.3 Pharmaceutical production
- 6.3.1 Active pharmaceutical ingredient (API) manufacturing
- 6.3.2 Laboratory solvent recovery
- 6.3.3 Others
- 6.4 Printing & packaging
- 6.4.1 Flexographic printing
- 6.4.2 Gravure printing
- 6.4.3 Lithographic printing
- 6.4.4 Others
- 6.5 Electronics manufacturing
- 6.5.1 PCB manufacturing & cleaning
- 6.5.2 Semiconductor wafer processing
- 6.5.3 Others
- 6.6 Aerospace & defense
- 6.6.1 Composite material fabrication
- 6.6.2 Surface treatment & preparation
- 6.6.3 Maintenance, repair & overhaul (MRO)
- 6.6.4 Others
- 6.7 Chemical processing
- 6.7.1 Others
Chapter 7 Market Size and Forecast, By Installation Type, 2021-2034 (USD Billion, Kilo Tons)
- 7.1 Key trends
- 7.2 On-site systems
- 7.3 Off-site systems
Chapter 8 Market Size and Forecast, By Region, 2021-2034 (USD Billion, Kilo Tons)
- 8.1 Key trends
- 8.2 North America
- 8.2.1 U.S.
- 8.2.2 Canada
- 8.3 Europe
- 8.3.1 UK
- 8.3.2 Germany
- 8.3.3 France
- 8.3.4 Italy
- 8.3.5 Spain
- 8.3.6 Rest of Europe
- 8.4 Asia Pacific
- 8.4.1 China
- 8.4.2 India
- 8.4.3 Japan
- 8.4.4 South Korea
- 8.4.5 Australia
- 8.4.6 Rest of Asia Pacific
- 8.5 Latin America
- 8.5.1 Brazil
- 8.5.2 Mexico
- 8.5.3 Argentina
- 8.5.4 Rest of Latin America
- 8.6 Middle East & Africa
- 8.6.1 South Africa
- 8.6.2 Saudi Arabia
- 8.6.3 UAE
- 8.6.4 Rest of Middle East & Africa
Chapter 9 Company Profiles
- 9.1 Sulzer
- 9.2 Thermo Fisher Scientific
- 9.3 Koch Modular Process Systems
- 9.4 Durr Group
- 9.5 GEA Group
- 9.6 Hydrite Chemical
- 9.7 Maratek Environmental
- 9.8 OFRU Recycling
- 9.9 HongYi Environmental Equipment
- 9.10 Spooner AMCEC
- 9.11 CBG Biotech
- 9.12 NexGen Enviro Systems
- 9.13 TruSteel
- 9.14 CleanPlanet Chemical
- 9.15 Progressive Recovery
 2026年全球溶剂回收与再利用市场报告
 NMP回收服务市场依製程技术、服务模式、纯度等级、应用、终端用户产业及通路划分,全球预测,2026-2032年溶剂回收和再利用市场按类型、技术、回收系统类型和最终用途产业划分-2025-2032年全球预测
 溶剂回收和再循环市场-全球产业规模、份额、趋势、机会和预测,按技术、溶剂类型、最终用途产业、地区和竞争细分,2020-2030 年预测
 2025-2033年按类型(现场溶剂回收、场外溶剂回收)、应用(印刷工业、油漆和涂料工业、石油和化学工业、製药工业等)和地区分類的溶剂回收市场报告
 到 2030 年溶剂回收和再循环市场预测:按溶剂类型、回收方法、技术、应用、最终用户和地区进行的全球分析
 全球溶剂回收再循环市场