


 |
市场调查报告书
商品编码
1885811
绿色氢气生产化学品市场机会、成长驱动因素、产业趋势分析及预测(2025-2034年)Green Hydrogen Production Chemicals Market Opportunity, Growth Drivers, Industry Trend Analysis, and Forecast 2025 - 2034 |
||||||
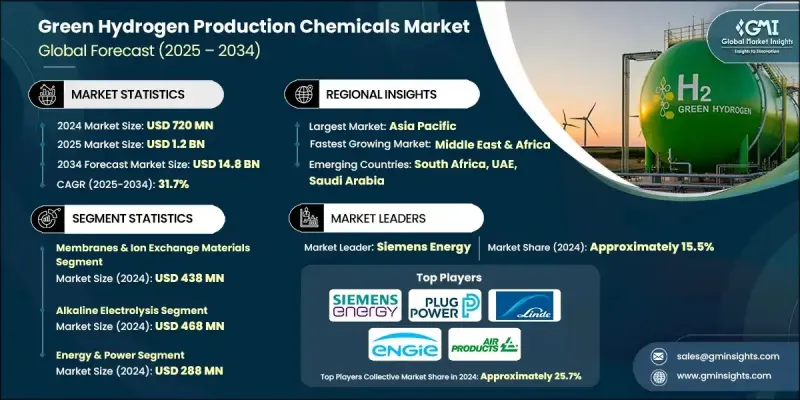
2024 年绿色氢气生产化学品市场价值为 7.2 亿美元,预计到 2034 年将以 31.7% 的复合年增长率增长至 148 亿美元。
随着各国政府加强脱碳力度,并推出直接支持绿色氢气生产所需化学原料的补贴机制,产业发展动能持续加速。这些措施改善了专案融资,增强了投资者信心,并激励各行业转型为低碳化工製程。风能和太阳能成本的快速下降也提振了市场前景,使生产商能够使用更经济实惠的再生电力来营运电解槽,而再生电力仍然是主要的成本驱动因素。随着再生能源价格的持续下降,大规模生产绿色氢气及其衍生化学品变得越来越可行,从而提升了市场的商业吸引力。同时,更低的资本成本和电解槽技术的效率提升降低了整体生产成本。这种转变正推动製造商扩大生产规模,开发新型先进的製程化学品,并采用高性能催化剂和薄膜技术,从而增强整个供应链的价值创造。
| 市场范围 | |
|---|---|
| 起始年份 | 2024 |
| 预测年份 | 2025-2034 |
| 起始值 | 7.2亿美元 |
| 预测值 | 148亿美元 |
| 复合年增长率 | 31.7% |
2024年,膜和离子交换材料市场规模为4.38亿美元,预计2025年至2034年将以41.2%的复合年增长率成长。随着生产商致力于提升电解槽系统的运作性能,这些材料正被更广泛地整合到电解槽系统中。为了最大限度地提高转化效率并减少能量损失,更高等级的催化剂和更纯净的电解液正被广泛应用;同时,耐用膜对于保障PEM和AEM装置的可靠性至关重要。它们在确保系统连续运作和稳定性能方面发挥的作用,正在推动该领域的长期需求。
2024年,碱性电解市场规模达4.68亿美元,预计2025年至2034年将以28.4%的复合年增长率成长。随着碱性电解和质子交换膜(PEM)电解技术在商业应用中的普及,市场需求不断成长。碱性电解系统需要性能优异的催化剂和稳定的电解液来维持稳定的产出,而PEM技术则依赖高效膜、离子交换材料和先进催化剂。这些技术在工业中心和氢能设施中日益广泛的应用,也使得对可靠、高品质的化学原料的需求不断增长,这些原料能够确保系统的性能和较长的使用寿命。
2024年,北美绿色氢气生产化学品市场规模预估为5,040万美元。再生能源的普及和联邦政府的激励政策正在推动该地区氢气生产活动和化学品消费的成长。电解槽开发、清洁能源基础设施和氢气运输网路投资的增加,进一步推动了催化剂、薄膜、净化化学品和水处理剂在新专案中的应用。该领域的主要参与者包括ENGIE、西门子能源股份公司、林德集团、Plug Power公司、空气产品公司等。
全球绿色氢气生产化学品市场的领导企业正透过多项重点策略强化其竞争地位。许多企业大力投资研发,致力于设计更有效率的催化剂、薄膜和电解质,以提升电解槽性能并降低整体生产成本。与再生能源开发商、电解槽製造商和工业终端用户建立策略合作伙伴关係日益普遍,从而确保长期供应协议和一体化专案开发。企业也在扩大产能以满足不断增长的需求,并实现生产本地化以降低物流成本并获得区域性激励措施。此外,企业也致力于永续发展,并拓展产品组合,涵盖先进材料、特种化学原料和下一代氢能技术,这些倡议进一步巩固了其市场地位。
目录
第一章:方法论
- 市场范围和定义
- 研究设计
- 研究方法
- 资料收集方法
- 资料探勘来源
- 全球的
- 地区/国家
- 基准估算和计算
- 基准年计算
- 市场估算的关键趋势
- 初步研究和验证
- 原始资料
- 预测模型
- 研究假设和局限性
第二章:执行概要
第三章:行业洞察
- 产业生态系分析
- 供应商格局
- 利润率
- 每个阶段的价值增加
- 影响价值链的因素
- 中断
- 产业影响因素
- 成长驱动因素
- 产业陷阱与挑战
- 市场机会
- 成长潜力分析
- 监管环境
- 北美洲
- 欧洲
- 亚太地区
- 拉丁美洲
- 中东和非洲
- 波特的分析
- PESTEL 分析
- 价格趋势
- 按地区
- 副产品
- 未来市场趋势
- 技术与创新格局
- 当前技术趋势
- 新兴技术
- 专利格局
- 贸易统计(註:仅提供重点国家的贸易统计)
- 主要进口国
- 主要出口国
- 永续性和环境方面
- 永续实践
- 减少废弃物策略
- 生产中的能源效率
- 环保倡议
- 碳足迹考量
第四章:竞争格局
- 介绍
- 公司市占率分析
- 按地区
- 北美洲
- 欧洲
- 亚太地区
- 拉丁美洲
- MEA
- 按地区
- 公司矩阵分析
- 主要市场参与者的竞争分析
- 竞争定位矩阵
- 关键进展
- 併购
- 合作伙伴关係与合作
- 新产品发布
- 扩张计划
第五章:市场估算与预测:依化学品类型划分,2021-2034年
- 主要趋势
- 催化剂
- 电解催化剂(PEM、碱性、固体氧化物)
- 光催化剂
- 电解质
- 酸性电解质
- 碱性电解质
- 膜和离子交换材料
- 质子交换膜
- 阴离子交换膜
- 水处理化学品
- 去离子剂
- 防垢剂
- 腐蚀抑制剂
- 气体净化化学品
- 除氧剂
- 吸湿剂
第六章:市场估算与预测:依生产技术划分,2021-2034年
- 主要趋势
- 碱性电解
- 质子交换膜(PEM)电解
- 固态氧化物电解
- 光电化学水分解
- 热化学过程
第七章:市场估算与预测:依最终用途产业划分,2021-2034年
- 主要趋势
- 能源与电力
- 运输
- 工业加工
- 化学製造
- 电子
第八章:市场估算与预测:依地区划分,2021-2034年
- 主要趋势
- 北美洲
- 我们
- 加拿大
- 欧洲
- 德国
- 英国
- 法国
- 义大利
- 西班牙
- 欧洲其他地区
- 亚太地区
- 中国
- 印度
- 日本
- 澳洲
- 韩国
- 亚太其他地区
- 拉丁美洲
- 巴西
- 墨西哥
- 阿根廷
- 拉丁美洲其他地区
- 中东和非洲
- 沙乌地阿拉伯
- 南非
- 阿联酋
- 中东和非洲其他地区
第九章:公司简介
- Air Liquide SA
- Air Products and Chemicals, Inc.
- Linde plc
- Siemens Energy AG
- ENGIE
- Plug Power Inc.
- Bloom Energy Corporation
- Nel Hydrogen
- Cummins Inc.
- McPhy Energy SA
- thyssenkrupp AG
- Ballard Power Systems Inc.
- Reliance Industries Ltd.
- Adani Green Energy Ltd.
- Sinopec
The Green Hydrogen Production Chemicals Market was valued at USD 720 million in 2024 and is estimated to grow at a CAGR of 31.7% to reach USD 14.8 billion by 2034.
Industry momentum continues to accelerate as governments intensify decarbonization mandates and roll out subsidy frameworks that directly support chemical inputs used in green hydrogen production. These measures have improved project financing, increased investor assurance, and motivated industries to transition toward low-carbon chemical processes. Rapid declines in the cost of wind and solar power have also strengthened the market outlook, enabling producers to operate electrolysers with more affordable renewable electricity, which remains the primary cost driver. As renewable pricing continues to fall, large-scale green hydrogen and derivative chemical production has become increasingly viable, expanding the market's commercial attractiveness. Meanwhile, lower capital costs and improved efficiencies in electrolyser technology have reduced overall production expenses. This shift is pushing manufacturers to scale up, develop new and advanced process chemicals, and adopt high-performance catalysts and membranes, strengthening value creation across the supply chain.
| Market Scope | |
|---|---|
| Start Year | 2024 |
| Forecast Year | 2025-2034 |
| Start Value | $720 Million |
| Forecast Value | $14.8 Billion |
| CAGR | 31.7% |
The membranes and ion-exchange materials segment was valued at USD 438 million in 2024 and is forecast to grow at a CAGR of 41.2% from 2025 to 2034. These materials are being integrated more widely into electrolyser systems as producers aim to enhance operational performance. Higher-grade catalysts and purer electrolytes are being deployed to maximize conversion efficiency and reduce energy losses, while durable membranes are becoming essential to support the reliability of PEM and AEM units. Their role in enabling continuous operation and stable system performance is driving long-term demand in this segment.
The alkaline electrolysis segment reached USD 468 million in 2024 and is expected to grow at a CAGR of 28.4% from 2025 to 2034. Demand is rising as alkaline and PEM electrolysis technologies gain traction in commercial settings. Alkaline systems require robust catalysts and stable electrolytes to maintain steady output, while PEM technologies depend on high-efficiency membranes, ion-exchange materials, and advanced catalysts. Their growing deployment across industrial hubs and hydrogen-driven facilities is increasing the need for reliable, high-quality chemical inputs that support performance and long operating lifespans.
North America Green Hydrogen Production Chemicals Market was valued at USD 50.4 million in 2024. Expanding renewable energy adoption and federal incentive programs are boosting hydrogen manufacturing activities and chemical consumption across the region. Rising investments in electrolyser development, clean-energy infrastructures, and hydrogen transport networks are further increasing the use of catalysts, membranes, purification chemicals, and water-treatment agents across new projects. Key companies active in this space include ENGIE, Siemens Energy AG, Linde plc, Plug Power Inc., Air Products and Chemicals, Inc., and other participants.
Leading companies in the Global Green Hydrogen Production Chemicals Market are strengthening their competitive position through several focused strategies. Many are investing heavily in R&D to design higher-efficiency catalysts, membranes, and electrolytes that enhance electrolyser performance and reduce overall production costs. Strategic partnerships with renewable energy developers, electrolyser manufacturers, and industrial end users are increasingly common, ensuring long-term supply agreements and integrated project development. Companies are also expanding manufacturing capacity to meet rising demand and are localizing production to reduce logistics costs and qualify for regional incentives. Sustainability commitments and portfolio diversification into advanced materials, specialized chemical inputs, and next-generation hydrogen technologies are further reinforcing their market foothold.
Table of Contents
Chapter 1 Methodology
- 1.1 Market scope and definition
- 1.2 Research design
- 1.2.1 Research approach
- 1.2.2 Data collection methods
- 1.3 Data mining sources
- 1.3.1 Global
- 1.3.2 Regional/Country
- 1.4 Base estimates and calculations
- 1.4.1 Base year calculation
- 1.4.2 Key trends for market estimation
- 1.5 Primary research and validation
- 1.5.1 Primary sources
- 1.6 Forecast model
- 1.7 Research assumptions and limitations
Chapter 2 Executive Summary
- 2.1 Industry 360° synopsis
- 2.2 Key market trends
- 2.2.1 Regional
- 2.2.2 Chemical Type
- 2.2.3 Production Technology
- 2.2.4 End Use Industry
- 2.3 TAM Analysis, 2025-2034
- 2.4 CXO perspectives: Strategic imperatives
- 2.4.1 Executive decision points
- 2.4.2 Critical success factors
- 2.5 Future Outlook and Strategic Recommendations
Chapter 3 Industry Insights
- 3.1 Industry ecosystem analysis
- 3.1.1 Supplier Landscape
- 3.1.2 Profit Margin
- 3.1.3 Value addition at each stage
- 3.1.4 Factor affecting the value chain
- 3.1.5 Disruptions
- 3.2 Industry impact forces
- 3.2.1 Growth drivers
- 3.2.2 Industry pitfalls and challenges
- 3.2.3 Market opportunities
- 3.3 Growth potential analysis
- 3.4 Regulatory landscape
- 3.4.1 North America
- 3.4.2 Europe
- 3.4.3 Asia Pacific
- 3.4.4 Latin America
- 3.4.5 Middle East & Africa
- 3.5 Porter's analysis
- 3.6 PESTEL analysis
- 3.7 Price trends
- 3.7.1 By region
- 3.7.2 By product
- 3.8 Future market trends
- 3.9 Technology and Innovation landscape
- 3.9.1 Current technological trends
- 3.9.2 Emerging technologies
- 3.10 Patent Landscape
- 3.11 Trade statistics (Note: the trade statistics will be provided for key countries only)
- 3.11.1 Major importing countries
- 3.11.2 Major exporting countries
- 3.12 Sustainability and Environmental Aspects
- 3.12.1 Sustainable Practices
- 3.12.2 Waste Reduction Strategies
- 3.12.3 Energy Efficiency in Production
- 3.12.4 Eco-friendly Initiatives
- 3.13 Carbon Footprint Considerations
Chapter 4 Competitive Landscape, 2024
- 4.1 Introduction
- 4.2 Company market share analysis
- 4.2.1 By region
- 4.2.1.1 North America
- 4.2.1.2 Europe
- 4.2.1.3 Asia Pacific
- 4.2.1.4 LATAM
- 4.2.1.5 MEA
- 4.2.1 By region
- 4.3 Company matrix analysis
- 4.4 Competitive analysis of major market players
- 4.5 Competitive positioning matrix
- 4.6 Key developments
- 4.6.1 Mergers & acquisitions
- 4.6.2 Partnerships & collaborations
- 4.6.3 New Product Launches
- 4.6.4 Expansion Plans
Chapter 5 Market Estimates and Forecast, By Chemical Type, 2021- 2034 (USD Million, Kilo Tons)
- 5.1 Key trends
- 5.2 Catalysts
- 5.2.1 Electrolysis catalysts (PEM, alkaline, solid oxide)
- 5.2.2 Photocatalysts
- 5.3 Electrolytes
- 5.3.1 Acidic electrolytes
- 5.3.2 Alkaline electrolytes
- 5.4 Membranes & ion exchange materials
- 5.4.1 Proton exchange membranes
- 5.4.2 Anion exchange membranes
- 5.5 Water treatment chemicals
- 5.5.1 Deionization agents
- 5.5.2 Anti-scaling agents
- 5.5.3 Corrosion inhibitors
- 5.6 Gas purification chemicals
- 5.6.1 Oxygen removal agents
- 5.6.2 Moisture absorbers
Chapter 6 Market Estimates and Forecast, By Production Technology, 2021 - 2034 (USD Million, Kilo Tons)
- 6.1 Key trends
- 6.2 Alkaline electrolysis
- 6.3 Proton exchange membrane (PEM) electrolysis
- 6.4 Solid oxide electrolysis
- 6.5 Photoelectrochemical water splitting
- 6.6 Thermochemical processes
Chapter 7 Market Estimates and Forecast, By End Use Industry, 2021 - 2034 (USD Million, Kilo Tons)
- 7.1 Key trends
- 7.2 Energy & power
- 7.3 Transportation
- 7.4 Industrial processing
- 7.5 Chemical manufacturing
- 7.6 Electronics
Chapter 8 Market Estimates and Forecast, By Region, 2021 - 2034 (USD Million, Kilo Tons)
- 8.1 Key trends
- 8.2 North America
- 8.2.1 U.S.
- 8.2.2 Canada
- 8.3 Europe
- 8.3.1 Germany
- 8.3.2 UK
- 8.3.3 France
- 8.3.4 Italy
- 8.3.5 Spain
- 8.3.6 Rest of Europe
- 8.4 Asia Pacific
- 8.4.1 China
- 8.4.2 India
- 8.4.3 Japan
- 8.4.4 Australia
- 8.4.5 South Korea
- 8.4.6 Rest of Asia Pacific
- 8.5 Latin America
- 8.5.1 Brazil
- 8.5.2 Mexico
- 8.5.3 Argentina
- 8.5.4 Rest of Latin America
- 8.6 Middle East & Africa
- 8.6.1 Saudi Arabia
- 8.6.2 South Africa
- 8.6.3 UAE
- 8.6.4 Rest of Middle East & Africa
Chapter 9 Company Profiles
- 9.1 Air Liquide S.A.
- 9.2 Air Products and Chemicals, Inc.
- 9.3 Linde plc
- 9.4 Siemens Energy AG
- 9.5 ENGIE
- 9.6 Plug Power Inc.
- 9.7 Bloom Energy Corporation
- 9.8 Nel Hydrogen
- 9.9 Cummins Inc.
- 9.10 McPhy Energy S.A.
- 9.11 thyssenkrupp AG
- 9.12 Ballard Power Systems Inc.
- 9.13 Reliance Industries Ltd.
- 9.14 Adani Green Energy Ltd.
- 9.15 Sinopec
 七叶苷市场:按产品形式、应用、最终用户和销售管道划分 - 2026-2032年全球预测
 2026年全球1,1'-羰基二咪唑(CDI)市场研究报告全球无 PFAS 聚合物加工助剂市场(按聚合物类型、加工方式、应用和最终用途产业划分)预测(2026-2032 年)按产品类型、治疗领域、给药途径、最终用户、销售管道和分销管道分類的塞格他林市场全球预测(2026-2032 年)无氰电镀添加剂市场:依最终用途产业、添加剂类型、基材、製程类型、功能优势、应用方式和形式划分,全球预测,2026-2032年磺胺氯吡嗪钠市场:按剂型、动物类型、应用、通路和最终用户划分,全球预测,2026-2032年磺胺甲氧嘧啶钠市场按剂型、分销管道、应用和最终用户划分,全球预测(2026-2032)铬酸雾抑制剂市场:依终端用户产业、应用、剂型、通路和抑制剂技术划分,全球预测,2026-2032年香料化合物市场按应用、产品类型和分销管道划分,全球预测(2026-2032年)
 硅油季铵盐市场规模、份额和成长分析:按产品类型、应用、最终用户、配方类型、地区和产业预测,2026-2033年