


 |
市场调查报告书
商品编码
1885871
双向电动车充电(V2G/V2H)系统市场机会、成长驱动因素、产业趋势分析及预测(2025-2034年)Bidirectional EV Charging (V2G/V2H) System Market Opportunity, Growth Drivers, Industry Trend Analysis, and Forecast 2025 - 2034 |
||||||
2024 年全球双向电动车充电(V2G/V2H)系统市值为 14 亿美元,预计到 2034 年将以 24.8% 的复合年增长率增长至 125 亿美元。
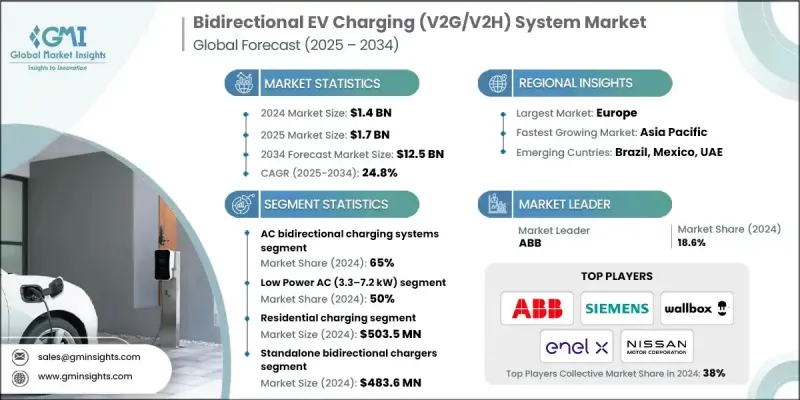
市场成长的驱动力来自电动车的快速普及、商用和私家电动车车队的扩张以及对智慧能源管理解决方案日益增长的需求。随着车网互动(V2G)和车家互动(V2H)技术的进步,各利害关係人正致力于提升营运效率、电网稳定性以及优化负载分配。市场正朝着数据驱动、自动化和互联互通的V2G/V2H网路转型,从而改变传统的能源管理方式。物联网双向充电器、人工智慧驱动的负载平衡演算法以及基于云端的能源平台的日益普及正在革新运营模式,实现预测性能源消耗、公用事业公司与车队运营商之间的无缝协调以及实时监控,从而提高效率、降低峰值负载并减少运营成本。这些创新为住宅、商业和车队应用领域提供了可扩展、经济高效且具弹性的双向充电生态系统。
| 市场范围 | |
|---|---|
| 起始年份 | 2024 |
| 预测年份 | 2025-2034 |
| 起始值 | 14亿美元 |
| 预测值 | 125亿美元 |
| 复合年增长率 | 24.8% |
2024 年,交流双向充电系统市占率达到 65%,预计 2025 年至 2034 年间将以 25.2% 的复合年增长率成长。交流双向系统是实现高效 V2G/V2H 能量流动的关键,它利用车载交流充电器、智慧负载控制器和通讯接口,促进电动车向家庭或电网释放能量。
低功率交流电(3.3-7.2 kW)市场在 2024 年占据了 50% 的市场份额,预计到 2034 年将以 24.5% 的复合年增长率成长。该市场主要由住宅和小型商业应用驱动,提供经济高效、易于安装的解决方案,相容于大多数电动车,并透过物联网监控和人工智慧驱动的能源调度得到增强。
德国双向电动车充电(V2G/V2H)系统市场占40%的份额,预计2024年市场规模将达到1.948亿美元。德国的领先地位得益于其强大的汽车製造业、优惠的监管政策以及互联互通的V2G基础设施的广泛应用。德国正日益广泛地应用基于人工智慧的负载优化、物联网双向充电器、预测性能源调度以及云端整合能源管理平台,以确保电网的可靠性和运作效率,同时遵守不断变化的能源法规。
推动双向电动车充电(V2G/V2H)系统市场成长的关键企业包括 Nuvve、Wallbox Chargers、Eaton、ABB、西门子、Enel X、ChargePoint、The Mobility House、施耐德电机和日产汽车。各公司正透过策略性措施巩固其市场地位,例如扩展区域充电网路、与公用事业公司和车队营运商建立合作关係,以及投资基于人工智慧和物联网的双向技术。产品创新包括经济高效的低功耗交流解决方案和可扩展的商用 V2G 系统。各公司也致力于整合云端平台、预测性能源调度和智慧负载平衡,以提高效能和合规性。行销活动的目标客户涵盖住宅、商业和车队用户,旨在提高产品普及率;同时,併购和长期服务协议有助于增强分销管道、品牌知名度和全球市场份额。
目录
第一章:方法论与范围
第二章:执行概要
第三章:行业洞察
- 产业生态系分析
- 供应商格局
- 利润率
- 成本结构
- 每个阶段的价值增加
- 影响价值链的因素
- 中断
- 产业影响因素
- 成长驱动因素
- 电动车快速普及和车队扩张
- 智慧电网与能源管理需求
- 技术进步
- 政府政策与激励措施
- 产业陷阱与挑战
- 高昂的基础设施和实施成本
- 监管和标准化方面的差距
- 市场机会
- 与再生能源和家庭能源系统的集成
- 车队及商业应用
- 监管激励措施和支持性政策
- 智慧城市和车队电气化项目
- 成长驱动因素
- 成长潜力分析
- 监管环境
- 北美监管环境
- 欧盟指令和授权
- 亚太政策框架
- 互联标准和公用事业要求
- 车辆安全与认证要求
- 建筑规范和电气规范更新
- 保险与责任监理框架
- 资料隐私与消费者保护法规
- 波特的分析
- PESTEL 分析
- 技术与创新格局
- 交流双向充电技术演进
- 直流双向充电技术进展
- 车载架构与车载架构的权衡
- 电力电子和逆变技术趋势
- 电池管理系统集成
- 智慧逆变器功能和併网支援能力
- 无线/感应式双向充电研究
- 依组件进行技术准备度评估
- 下一代技术研发管线
- 价格趋势
- 按地区
- 副产品
- 生产统计
- 生产中心
- 消费中心
- 进出口
- 成本細項分析
- 专利分析
- 永续性和环境方面
- 永续实践
- 减少废弃物策略
- 生产中的能源效率
- 环保倡议
- 最佳情况
- 试点专案和部署案例研究
3.14.1. Utility v2 g 试点计画概述
- Pg&e BMW 储值计划
- 康爱迪生智能充电
3.14.4. Opg v2 g 飞行员
3.14.5. 英国 v2 g 试验
3.14.6. 日本V2H部署计划
- 消费者行为与采纳分析
- 各地区消费者意识水平
- 购买决策因素和优先事项
- 支付意愿分析
- 公用事业计划的参与率
- 流失率和留存率分析
- 客户满意度指标
- 宏观经济因素及市场影响
- 能源价格波动的影响
- 电力价格结构与分时电价
- 批发能源市场价格趋势
- 利率环境与融资成本
- 通货膨胀对设备成本的影响
第四章:竞争格局
- 介绍
- 公司市占率分析
- 北美洲
- 欧洲
- 亚太地区
- 拉丁美洲
- 中东和非洲
- 主要市场参与者的竞争分析
- 竞争定位矩阵
- 战略展望矩阵
- 关键进展
- 併购
- 合作伙伴关係与合作
- 新产品发布
- 扩张计划和资金
第五章:市场估算与预测:以收费方式划分,2021-2034年
- 主要趋势
- 交流双向充电系统
- 直流双向充电系统
第六章:市场估算与预测:依电力容量划分,2021-2034年
- 主要趋势
- 低功率交流电(3.3-7.2千瓦)
- 中等功率交流电(11-22千瓦)
- 直流快速充电(50-150千瓦)
- 高功率直流电(150度以上)
第七章:市场估算与预测:依充电地点划分,2021-2034年
- 主要趋势
- 住宅收费
- 工作场所充电
- 车队仓库充电
- 公共收费
第八章:市场估算与预测:以一体化程度划分,2021-2034年
- 主要趋势
- 独立式双向充电器
- 与太阳能光电发电系统集成
- 与固定式电池储能係统集成
- 全整合家庭能源系统
- 微电网整合系统
第九章:市场估算与预测:依最终用途划分,2021-2034年
- 主要趋势
- 住宅用户
- 商业和车队营运商
- 电力公司和电网运营商
- 工业设施
- 公共部门及紧急服务
第十章:市场估计与预测:依地区划分,2021-2034年
- 主要趋势
- 北美洲
- 我们
- 加拿大
- 欧洲
- 英国
- 德国
- 法国
- 义大利
- 西班牙
- 比利时
- 荷兰
- 瑞典
- 亚太地区
- 中国
- 印度
- 日本
- 澳洲
- 新加坡
- 韩国
- 越南
- 印尼
- 拉丁美洲
- 巴西
- 墨西哥
- 阿根廷
- MEA
- 阿联酋
- 南非
- 沙乌地阿拉伯
第十一章:公司简介
- Global Player
- ABB
- ChargePoint
- Eaton
- Enel X
- Nissan Motor
- Nuvve
- Schneider Electric
- Shell Recharge Solutions
- Siemens
- Wallbox Chargers
- Regional Player
- Blink charging
- Engie EV solutions
- Evbox
- Pod point
- Star charge
- Tesla energy
- TGOOD
- The mobility house
- Tritium
- Virta
- 新兴参与者
- Freewire technologies
- Greenlots
- Incharge energy
- Ohme
11.3.5. Ovo 能源 V2 G 解决方案
The Global Bidirectional EV Charging (V2G/V2H) System Market was valued at USD 1.4 billion in 2024 and is estimated to grow at a CAGR of 24.8% to reach USD 12.5 billion by 2034.
Market growth is fueled by the rapid adoption of electric vehicles, the expansion of commercial and private EV fleets, and rising demand for smart energy management solutions. As vehicle-to-grid and vehicle-to-home technologies advance, stakeholders are focusing on enhancing operational efficiency, grid stability, and optimized load distribution. The market is shifting toward data-driven, automated, and connected V2G/V2H networks, transforming conventional energy management approaches. Increasing use of IoT-enabled bidirectional chargers, AI-powered load balancing algorithms, and cloud-based energy platforms is revolutionizing operations, enabling predictive energy discharge, seamless coordination between utilities and fleet operators, and real-time monitoring to improve efficiency, reduce peak load, and lower operational costs. These innovations support scalable, cost-effective, and resilient bidirectional charging ecosystems across residential, commercial, and fleet applications.
| Market Scope | |
|---|---|
| Start Year | 2024 |
| Forecast Year | 2025-2034 |
| Start Value | $1.4 Billion |
| Forecast Value | $12.5 Billion |
| CAGR | 24.8% |
The AC bidirectional charging systems segment accounted for a 65% share in 2024 and is projected to grow at a CAGR of 25.2% between 2025 and 2034. AC bidirectional systems are integral for efficient V2G/V2H energy flow, leveraging onboard AC chargers, smart load controllers, and communication interfaces to facilitate energy discharge from EVs to homes or grids.
The low-power AC segment (3.3-7.2 kW) held a 50% share in 2024 and is expected to grow at a CAGR of 24.5% through 2034. This segment is primarily driven by residential and small commercial applications, offering cost-effective, easily installable solutions compatible with most EVs, enhanced by IoT monitoring and AI-enabled energy scheduling.
Germany Bidirectional EV Charging (V2G/V2H) System Market held a 40% share, generating USD 194.8 million in 2024. The country's leadership is supported by strong automotive manufacturing, regulatory incentives, and widespread adoption of connected, V2G-enabled infrastructure. Germany is increasingly implementing AI-based load optimization, IoT-enabled bidirectional chargers, predictive energy scheduling, and cloud-integrated energy management platforms to ensure grid reliability and operational efficiency while adhering to evolving energy regulations.
Key players driving growth in the Bidirectional EV Charging (V2G/V2H) System Market include Nuvve, Wallbox Chargers, Eaton, ABB, Siemens, Enel X, ChargePoint, The Mobility House, Schneider Electric, and Nissan Motor. Companies are strengthening their presence through strategic initiatives such as expanding regional charging networks, forming partnerships with utilities and fleet operators, and investing in AI and IoT-based bidirectional technologies. Product innovations include cost-efficient, low-power AC solutions and scalable commercial V2G systems. Firms also focus on integrating cloud platforms, predictive energy scheduling, and smart load balancing to improve performance and compliance. Marketing efforts target residential, commercial, and fleet customers to increase adoption, while mergers, acquisitions, and long-term service agreements enhance distribution, brand recognition, and market foothold globally.
Table of Contents
Chapter 1 Methodology & Scope
- 1.1 Market scope and definition
- 1.2 Research design
- 1.2.1 Research approach
- 1.2.2 Data collection methods
- 1.3 Data mining sources
- 1.3.1 Global
- 1.3.2 Regional/Country
- 1.4 Base estimates and calculations
- 1.4.1 Base year calculation
- 1.4.2 Key trends for market estimation
- 1.5 Primary research and validation
- 1.5.1 Primary sources
- 1.6 Forecast
- 1.7 Research assumptions and limitations
Chapter 2 Executive Summary
- 2.1 Industry 360° synopsis, 2021 - 2034
- 2.2 Key market trends
- 2.2.1 Regional
- 2.2.2 Charging
- 2.2.3 Power capacity
- 2.2.4 Charging location
- 2.2.5 Integration level
- 2.2.6 End Use
- 2.3 TAM Analysis, 2025-2034
- 2.4 CXO perspectives: Strategic imperatives
- 2.4.1 Executive decision points
- 2.4.2 Critical success factors
- 2.5 Future outlook and strategic recommendations
Chapter 3 Industry Insights
- 3.1 Industry ecosystem analysis
- 3.1.1 Supplier Landscape
- 3.1.2 Profit Margin
- 3.1.3 Cost structure
- 3.1.4 Value addition at each stage
- 3.1.5 Factor affecting the value chain
- 3.1.6 Disruptions
- 3.2 Industry impact forces
- 3.2.1 Growth drivers
- 3.2.1.1 Rapid EV adoption & fleet expansion
- 3.2.1.2 Smart grid & energy management needs
- 3.2.1.3 Technological advancements
- 3.2.1.4 Government policies & incentives
- 3.2.2 Industry pitfalls and challenges
- 3.2.2.1 High infrastructure & implementation costs
- 3.2.2.2 Regulatory & standardization gaps
- 3.2.3 Market opportunities
- 3.2.3.1 Integration with renewable energy & home energy systems
- 3.2.3.2 Fleet & commercial applications
- 3.2.3.3 Regulatory incentives and supportive policies
- 3.2.3.4 Smart city and fleet electrification projects
- 3.2.1 Growth drivers
- 3.3 Growth potential analysis
- 3.4 Regulatory landscape
- 3.4.1 North America regulatory environment
- 3.4.2 European union directives & mandates
- 3.4.3 Asia pacific policy frameworks
- 3.4.4 Interconnection standards & utility requirements
- 3.4.5 Vehicle safety & certification requirements
- 3.4.6 Building code & electrical code updates
- 3.4.7 Insurance & liability regulatory framework
- 3.4.8 Data privacy & consumer protection regulations
- 3.5 Porter's analysis
- 3.6 PESTEL analysis
- 3.7 Technology and Innovation Landscape
- 3.7.1 AC bidirectional charging technology evolution
- 3.7.2 DC bidirectional charging advancements
- 3.7.3 Onboard vs offboard architecture trade-offs
- 3.7.4 Power electronics & inverted technology trends
- 3.7.5 Battery management system integration
- 3.7.6 Smart inverter functions & grid support capabilities
- 3.7.7 Wireless/inductive bidirectional charging research
- 3.7.8 Technology readiness assessment by component
- 3.7.9 Next-generation technology pipeline
- 3.8 Price trends
- 3.8.1 By region
- 3.8.2 By product
- 3.9 Production statistics
- 3.9.1 Production hubs
- 3.9.2 Consumption hubs
- 3.9.3 Export and import
- 3.10 Cost breakdown analysis
- 3.11 Patent analysis
- 3.12 Sustainability and Environmental Aspects
- 3.12.1 Sustainable practices
- 3.12.2 Waste reduction strategies
- 3.12.3 Energy efficiency in production
- 3.12.4 Eco-friendly initiatives
- 3.13 Best case scenarios
- 3.14 Pilot programs & deployment case studies
- 3.14.1. Utility v2 g pilot programs overview
- 3.14.2 Pg&e BMW chargeforward program
- 3.14.3 Con Edison smart charge
- 3.14.4. Opg v2 g pilot
- 3.14.5. Uk v2 g trials
- 3.14.6. Japanese v2 h deployment programs
- 3.15 Consumer Behavior & Adoption Analysis
- 3.15.1 Consumer awareness levels by region
- 3.15.2 Purchase decision factors & priorities
- 3.15.3 Willingness to pay analysis
- 3.15.4 Participation rates in utility programs
- 3.15.5 Churn rates & retention analysis
- 3.15.6 Customer satisfaction metrics
- 3.16 Macroeconomic Factors & Market Impact
- 3.16.1 Energy price volatility impact
- 3.16.2 Electricity rate structures & time-of-use pricing
- 3.16.3 Wholesale energy market price trends
- 3.16.4 Interest rate environment & financing costs
- 3.16.5 Inflation impact on equipment costs
Chapter 4 Competitive Landscape, 2024
- 4.1 Introduction
- 4.2 Company market share analysis
- 4.2.1 North America
- 4.2.2 Europe
- 4.2.3 Asia Pacific
- 4.2.4 Latin America
- 4.2.5 Middle East & Africa
- 4.3 Competitive analysis of major market players
- 4.4 Competitive positioning matrix
- 4.5 Strategic outlook matrix
- 4.6 Key developments
- 4.6.1 Mergers & acquisitions
- 4.6.2 Partnerships & collaborations
- 4.6.3 New product launches
- 4.6.4 Expansion plans and funding
Chapter 5 Market Estimates & Forecast, By Charging, 2021 - 2034 ($ Bn, Units)
- 5.1 Key trends
- 5.2 AC bidirectional charging systems
- 5.3 DC bidirectional charging systems
Chapter 6 Market Estimates & Forecast, By Power Capacity, 2021 - 2034 ($ Bn, Units)
- 6.1 Key trends
- 6.2 Low power AC (3.3-7.2 kW)
- 6.3 Medium power AC (11-22 kW)
- 6.4 DC fast charging (50-150 kW)
- 6.5 High power DC (150+ kW)
Chapter 7 Market Estimates & Forecast, By Charging Location, 2021 - 2034 ($ Bn, Units)
- 7.1 Key trends
- 7.2 Residential charging
- 7.3 Workplace charging
- 7.4 Fleet depot charging
- 7.5 Public charging
Chapter 8 Market Estimates & Forecast, By Integration Level, 2021 - 2034 ($ Bn, Units)
- 8.1 Key trends
- 8.2 Standalone bidirectional chargers
- 8.3 Integrated with solar PV
- 8.4 Integrated with stationary battery storage
- 8.5 Fully integrated home energy systems
- 8.6 Microgrid-integrated systems
Chapter 9 Market Estimates & Forecast, By End Use, 2021 - 2034 ($ Bn, Units)
- 9.1 Key trends
- 9.2 Residential users
- 9.3 Commercial & fleet operators
- 9.4 Electric utilities & grid operators
- 9.5 Industrial facilities
- 9.6 Public sector & emergency services
Chapter 10 Market Estimates & Forecast, By Region, 2021 - 2034 ($ Bn, Units)
- 10.1 Key trends
- 10.2 North America
- 10.2.1 US
- 10.2.2 Canada
- 10.3 Europe
- 10.3.1 UK
- 10.3.2 Germany
- 10.3.3 France
- 10.3.4 Italy
- 10.3.5 Spain
- 10.3.6 Belgium
- 10.3.7 Netherlands
- 10.3.8 Sweden
- 10.4 Asia Pacific
- 10.4.1 China
- 10.4.2 India
- 10.4.3 Japan
- 10.4.4 Australia
- 10.4.5 Singapore
- 10.4.6 South Korea
- 10.4.7 Vietnam
- 10.4.8 Indonesia
- 10.5 Latin America
- 10.5.1 Brazil
- 10.5.2 Mexico
- 10.5.3 Argentina
- 10.6 MEA
- 10.6.1 UAE
- 10.6.2 South Africa
- 10.6.3 Saudi Arabia
Chapter 11 Company Profiles
- 11.1 Global Player
- 11.1.1 ABB
- 11.1.2 ChargePoint
- 11.1.3 Eaton
- 11.1.4 Enel X
- 11.1.5 Nissan Motor
- 11.1.6 Nuvve
- 11.1.7 Schneider Electric
- 11.1.8 Shell Recharge Solutions
- 11.1.9 Siemens
- 11.1.10 Wallbox Chargers
- 11.2 Regional Player
- 11.2.1 Blink charging
- 11.2.2 Engie EV solutions
- 11.2.3 Evbox
- 11.2.4 Pod point
- 11.2.5 Star charge
- 11.2.6 Tesla energy
- 11.2.7 TGOOD
- 11.2.8 The mobility house
- 11.2.9 Tritium
- 11.2.10 Virta
- 11.3 Emerging Players
- 11.3.1 Freewire technologies
- 11.3.2 Greenlots
- 11.3.3 Incharge energy
- 11.3.4 Ohme
- 11.3.5. Ovo energy V2 G solutions
 2026年全球公共充电桩故障排除平台市场报告2026年全球即插即用充电模组市场报告
 2026-2030年全球电动车充电器市场2026年全球智慧墙盒市场报告2026年全球电动车(EV)充电转换器模组市场报告2026年全球直流快速家用充电器市场报告
 壁挂式电动车充电器市场 - 全球产业规模、份额、趋势、机会及预测(按产品类型、最终用途、地区和竞争格局划分,2021-2031年)携带式电动车充电器市场-全球产业规模、份额、趋势、机会及预测(按产品类型、车辆类型、地区和竞争格局划分,2021-2031年)
 电动车充电器市场规模、份额和成长分析(按车辆类型、最终用户、充电类型和地区划分)—2026-2033年产业预测
 电动车 (EV) 维修服务市场预测至 2032 年:按服务类型、车辆类型、组件、服务供应商、动力类型、最终用户和地区分類的全球分析