


 |
市场调查报告书
商品编码
1892646
行动数据分析平台市场机会、成长驱动因素、产业趋势分析及预测(2025-2034 年)Mobility Data Analytics Platforms Market Opportunity, Growth Drivers, Industry Trend Analysis, and Forecast 2025 - 2034 |
||||||
2024 年全球行动数据分析平台市值为 21.6 亿美元,预计到 2034 年将以 18.1% 的复合年增长率成长至 112 亿美元。
随着各机构将重心转向即时多模式出行智能,市场正加速发展。即时多模式出行智慧支援对交通、大众运输、货运和微出行系统的持续监控。这种能力能够强化日常决策,实现自适应讯号调整,缩短网路中断期间的反应时间,并提升出行者资讯的品质。这些优点共同作用,有助于缓解交通拥堵,提高服务可靠性,保障网路安全运行,并提升整体营运绩效。人工智慧驱动的预测与出行数位孪生技术相结合,正在重塑长期规划。这些工具能够更深入地洞察新兴出行模式、潜在拥塞点和基础设施准备情况,使利害关係人能够测试各种场景,指导策略性投资,并提前应对系统风险。随着连网车辆、物联网终端和先进感测技术的快速发展,资料量和资料精度正以惊人的速度成长。随着资料集日益丰富,出行分析能够提供更强大的即时风险侦测能力,支援预测性的维护活动,加强多模式协调,扩展智慧城市功能,丰富使用者体验,并加速智慧和自动驾驶出行创新技术的推广应用。
| 市场范围 | |
|---|---|
| 起始年份 | 2024 |
| 预测年份 | 2025-2034 |
| 起始值 | 21.6亿美元 |
| 预测值 | 112亿美元 |
| 复合年增长率 | 18.1% |
2024年,云端平台创造了14亿美元的收入,预计到2034年将以18.9%的复合年增长率成长。其成长势头主要源于对可扩展基础设施、更低前期投资以及即时存取现代人工智慧工具的需求。这些云端环境还支援快速部署和远端访问,采用软体即服务(SaaS)或平台即服务(PaaS)模式,从而降低了财务风险。对于那些没有资源维护本地系统或高效能运算环境的组织而言,云端平台的应用尤为强劲。
2024年,分析和智慧领域占据32%的市场份额,预计2025年至2034年将以21.2%的复合年增长率成长。该领域的成长与连网汽车技术、远端资讯处理和物联网驱动的资料产生蓬勃发展密切相关。新型即时资料管道和串流架构能够实现更快、更准确的资料收集,从而支援在交通监管、车队优化、交通规划、预测建模和城市交通管理等领域提供即时的营运洞察。
2024年,美国行动数据分析平台市场占了87%的市场。当年,美国市场创造了6.418亿美元的收入,并有望在2034年之前保持强劲成长。即时交通系统和车联网(V2O)的加速普及,正在加强车辆、基础设施和边缘运算分析之间的连结。这些进步有助于更快地回应道路事件,改善自适应讯号运行,并增强互联安全服务。由此,低延迟平台和公私合作部署在道路网路和行动旅行专案中的投资不断增加,所有这些都促进了云端原生营运分析的更广泛应用。
目录
第一章:方法论
第二章:执行概要
第三章:行业洞察
- 产业生态系分析
- 供应商格局
- 利润率分析
- 成本结构
- 每个阶段的价值增加
- 影响价值链的因素
- 中断
- 产业影响因素
- 成长驱动因素
- 城市拥挤和人口成长
- 智慧城市及其投资的扩展
- 连网汽车和物联网设备激增
- 公共交通数位化发展
- 企业对车队和物流优化的需求
- 产业陷阱与挑战
- 资料隐私和安全问题
- 高昂的整合和部署成本
- 市场机会
- 自动驾驶和先进驾驶辅助系统(ADAS)的发展
- 电动车基础设施和充电分析的扩展
- 永续交通和排放监测
- 多模式出行即服务 (MaaS) 的整合
- 成长驱动因素
- 成长潜力分析
- 监管环境
- 波特的分析
- PESTEL 分析
- 技术与创新格局
- 目前技术
- 新兴技术
- 专利分析
- 未来市场趋势
- 主要市场趋势和颠覆性因素
- 客户采纳与满意度分析
- 各行业领域的采用率
- 使用者满意度指标和净推荐值 (NPS)
- 功能利用模式
- 流失率与留存率分析
- 客户成功因素
- 数据品质与整合挑战
- 资料完整性和准确性问题
- 即时数据延迟限制
- 多源资料整合复杂性
- 旧系统相容性
- 数据标准化障碍
- 感测器校准和维护要求
- 投资报酬率和商业价值量化
- 按应用分類的成本节约指标
- 营运效率提升
- 安全与风险降低效益
- 创收机会
- 总拥有成本分析
- 投资回收期基准
- 产业成熟度评估与实施基准
- 成熟度模型框架
- 各行业领域的能力成熟度
- 技术采纳生命週期阶段
- 实施时间表基准
- 资源需求与人员配置模式
- 组织准备度评估
- 使用案例开发与实施路线图
- 用例优先权框架
- 从概念验证到生产路径
- 分阶段实施策略
- 短期见效与长期倡议
- 利害关係人参与与变革管理
- 培训与能力建构方案
- 真实个案研究及实施成果
- 车队管理部署
- 智慧城市交通管理项目
- 公共交通优化计划
- 共享出行平台实施方案
- 智慧停车系统推广
- 经验教训与最佳实践
- 整合与互通性格局
- API标准与协定
- 资料交换格式和规范
- 多厂商整合模式
- 云端平台相容性
- 开源解决方案与专有解决方案
- 跨境资料共享机制
- 网路安全、资料隐私与合规架构
- 威胁情势与攻击途径
- NIST网路安全框架应用
- 隐私设计实施
- 资料匿名化与去识别化
- 合规认证要求
- 事件响应与恢復协议
- 第三方风险管理
第四章:竞争格局
- 介绍
- 公司市占率分析
- 北美洲
- 欧洲
- 亚太地区
- 拉丁美洲
- MEA
- 主要市场参与者的竞争分析
- 竞争定位矩阵
- 战略展望矩阵
- 重要新闻和倡议
- 併购
- 合作伙伴关係与合作
- 新产品发布
- 扩张计划和资金
第五章:市场估算与预测:依部署方式划分,2021-2034年
- 基于云端的
- 现场
- 杂交种
第六章:市场估计与预测:依技术划分,2021-2034年
- 数据收集与遥测
- 资料管理与储存
- 分析与智能
- 可视化和用户介面
- 连接与集成
第七章:市场估计与预测:依应用领域划分,2021-2034年
- 流量和网路优化
- 车队及资产管理
- 公共交通和共享旅游分析
- 安全、合规和事故管理
- 收入、定价和需求预测
- 永续性、排放和环境监测
第八章:市场估算与预测:依最终用途划分,2021-2034年
- 政府和城市规划部门
- 大众运输机构
- 出行和共享交通运输业者
- 物流和车队企业
- 汽车原始设备製造商和一级技术供应商
- 研究、政策和学术机构
第九章:市场估计与预测:依地区划分,2021-2034年
- 北美洲
- 我们
- 加拿大
- 欧洲
- 德国
- 英国
- 法国
- 义大利
- 西班牙
- 北欧
- 荷兰
- 俄罗斯
- 比荷卢经济联盟
- 亚太地区
- 中国
- 印度
- 日本
- 澳新银行
- 新加坡
- 泰国
- 越南
- 韩国
- 拉丁美洲
- 巴西
- 墨西哥
- 阿根廷
- MEA
- 南非
- 沙乌地阿拉伯
- 阿联酋
第十章:公司简介
- 全球参与者
- Geotab
- INRIX
- Mapbox
- Omnitracs
- PTV Planung Transport Verkehr
- Samsara
- Siemens Mobility
- Teledyne FLIR / Acyclica
- Trimble Transportation
- Verizon Connect
- HERE Technologies
- Iteris
- Teralytics
- TomTom
- 区域冠军
- Cubic Transportation Systems
- CVEDIA
- Econolite
- FLASH (Park Assist)
- Kapsch TrafficCom
- ParkMobile
- Powerfleet
- Remix (Via)
- SWARCO
- Swiftly
- Teletrac Navman
- 新兴参与者和颠覆者
- ATOM Mobility
- Descartes Systems
- FourKites
- LVL Parking
- Moovit (Intel)
- Populus
- Ride Report
- StreetLight Data
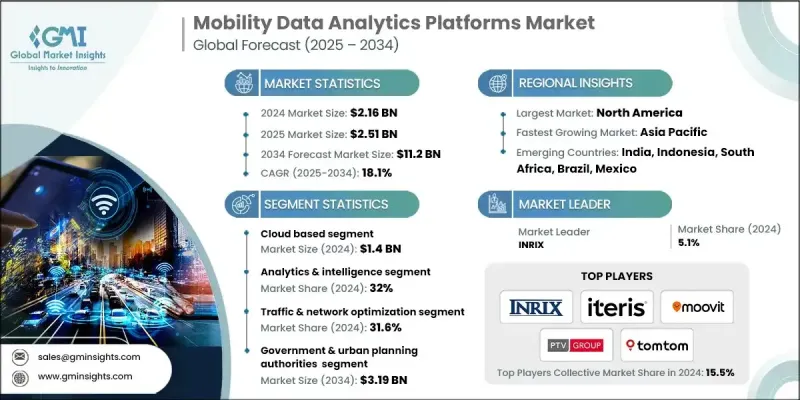
The Global Mobility Data Analytics Platforms Market was valued at USD 2.16 billion in 2024 and is estimated to grow at a CAGR of 18.1% to reach USD 11.2 billion by 2034.
The market is accelerating as organizations focus on real-time multi-modal mobility intelligence, which supports continuous oversight of traffic, transit, freight, and micro-mobility systems. This capability strengthens day-to-day decision-making, enables adaptive signal adjustments, enhances response times during network disruptions, and elevates traveler information quality. Together, these advantages help reduce congestion, improve service reliability, support safer movement across networks, and boost overall operational performance. AI-driven forecasting paired with mobility digital twins is also reshaping long-term planning. These tools offer deeper visibility into emerging travel patterns, potential congestion points, and infrastructure readiness, allowing stakeholders to test scenarios, guide strategic investment, and address system risks in advance. With the rapid rise of connected vehicles, IoT endpoints, and advanced sensing technologies, data volumes and precision are increasing at a dramatic pace. As datasets become richer, mobility analytics deliver stronger real-time risk detection, support predictive maintenance activities, strengthen multimodal coordination, expand smart city capabilities, enrich user experience, and quicken the rollout of intelligent and autonomous mobility innovations.
| Market Scope | |
|---|---|
| Start Year | 2024 |
| Forecast Year | 2025-2034 |
| Start Value | $2.16 Billion |
| Forecast Value | $11.2 Billion |
| CAGR | 18.1% |
The cloud-based platforms generated USD 1.4 billion in 2024 and are predicted to grow at an 18.9% CAGR through 2034. Their momentum is driven by demand for scalable infrastructure, lower upfront investment, and immediate access to modern AI tools. These cloud environments also allow fast implementation and remote accessibility under software-as-a-service or platform-as-a-service models, reducing financial exposure. Adoption has been strong among organizations that do not have the resources to maintain on-site systems or high-performance computing environments.
The analytics and intelligence segment represented a 32% share in 2024 and is expected to grow at a CAGR of 21.2% from 2025 to 2034. Growth in this category is tied to the surge in connected vehicle technologies, telematics, and IoT-driven data creation. New real-time data pipelines and streaming architectures are enabling faster and more accurate data collection, supporting immediate operational insights across traffic oversight, fleet optimization, transit planning, predictive modeling, and urban mobility management.
United States Mobility Data Analytics Platforms Market accounted for 87% share in 2024. The U.S. market generated USD 641.8 million that year and is positioned for strong expansion through 2034. Accelerated adoption of real-time traffic systems and vehicle-to-everything communication is strengthening links between vehicles, infrastructure, and edge-based analytics. These advancements support quicker responses to roadway events, help refine adaptive signal operations, and reinforce connected safety services. The result is rising investment in low-latency platforms and collaborative public-private deployments across road networks and mobility programs, all of which encourage broader use of cloud-native operational analytics.
Key companies active in the Mobility Data Analytics Platforms Market include Teralytics, HERE Technologies, TomTom, Streetlight Data, Cubic Transportation Systems, Iteris, Siemens Mobility, PTV Planung Transport Verkehr, Moovit, and INRIX. Companies competing in the mobility data analytics platforms market are reinforcing their market position by expanding AI-driven analytics capabilities, strengthening cloud-native architectures, and integrating advanced modeling tools that support real-time and predictive insights. Many firms are focusing on partnerships with public agencies, technology providers, and automotive stakeholders to broaden data access and enhance platform interoperability. Investment in scalable APIs and flexible deployment models is helping vendors meet diverse customer needs while keeping operating costs low. Organizations are also prioritizing continuous updates in machine learning, digital twin simulation, and multimodal analytics to differentiate their offerings.
Table of Contents
Chapter 1 Methodology
- 1.1 Market scope and definition
- 1.2 Research design
- 1.2.1 Research approach
- 1.2.2 Data collection methods
- 1.3 Data mining sources
- 1.3.1 Global
- 1.3.2 Regional/Country
- 1.4 Base estimates and calculations
- 1.4.1 Base year calculation
- 1.4.2 Key trends for market estimation
- 1.5 Primary research and validation
- 1.5.1 Primary sources
- 1.6 Forecast
- 1.7 Research assumptions and limitations
Chapter 2 Executive Summary
- 2.1 Industry 360° synopsis, 2021 - 2034
- 2.2 Key market trends
- 2.2.1 Deployment
- 2.2.2 Technology
- 2.2.3 Application
- 2.2.4 End Use
- 2.2.5 Regional
- 2.3 TAM Analysis, 2026-2034
- 2.4 CXO perspectives: Strategic imperatives
- 2.4.1 Executive decision points
- 2.4.2 Critical success factors
- 2.5 Future outlook & strategic recommendations
Chapter 3 Industry Insights
- 3.1 Industry ecosystem analysis
- 3.1.1 Supplier landscape
- 3.1.2 Profit margin analysis
- 3.1.3 Cost structure
- 3.1.4 Value addition at each stage
- 3.1.5 Factor affecting the value chain
- 3.1.6 Disruptions
- 3.2 Industry impact forces
- 3.2.1 Growth drivers
- 3.2.1.1 Urban congestion and population growth
- 3.2.1.2 Expansion of smart city and its investments
- 3.2.1.3 Surge in connected vehicles and IoT devices
- 3.2.1.4 Growth of public transit digitization
- 3.2.1.5 Corporate demand for fleet and logistics optimization
- 3.2.2 Industry pitfalls and challenges
- 3.2.2.1 Data privacy and security concerns
- 3.2.2.2 High integration and deployment costs
- 3.2.3 Market opportunities
- 3.2.3.1 Growth of autonomous and advanced driver assistance systems (ADAS)
- 3.2.3.2 Expansion of EV infrastructure and charging analytics
- 3.2.3.3 Sustainable mobility and emissions monitoring
- 3.2.3.4 Integration of multimodal mobility-as-a-service (MaaS)
- 3.2.1 Growth drivers
- 3.3 Growth potential analysis
- 3.4 Regulatory landscape
- 3.4.1 North America
- 3.4.2 Europe
- 3.4.3 Asia Pacific
- 3.4.4 Latin America
- 3.4.5 Middle east and Africa
- 3.5 Porter's analysis
- 3.6 PESTEL analysis
- 3.7 Technology and Innovation landscape
- 3.7.1 Current technology
- 3.7.2 Emerging technology
- 3.8 Patent analysis
- 3.9 Future market trends
- 3.10 Major market trends and disruptions
- 3.11 Customer Adoption & Satisfaction Analytics
- 3.11.1 Adoption Rates by Industry Segment
- 3.11.2 User Satisfaction Metrics & NPS Scores
- 3.11.3 Feature Utilization Patterns
- 3.11.4 Churn Rates & Retention Analysis
- 3.11.5 Customer Success Factors
- 3.12 Data Quality & Integration Challenges
- 3.12.1 Data Completeness & Accuracy Issues
- 3.12.2 Real-Time Data Latency Constraints
- 3.12.3 Multi-Source Data Integration Complexity
- 3.12.4 Legacy System Compatibility
- 3.12.5 Data Standardization Barriers
- 3.12.6 Sensor Calibration & Maintenance Requirements
- 3.13 ROI & Business Value Quantification
- 3.13.1 Cost Savings Metrics by Application
- 3.13.2 Operational Efficiency Improvements
- 3.13.3 Safety & Risk Reduction Benefits
- 3.13.4 Revenue Generation Opportunities
- 3.13.5 Total Cost of Ownership Analysis
- 3.13.6 Payback Period Benchmarks
- 3.14 Industry Maturity Assessment & Implementation Benchmarks
- 3.14.1 Maturity Model Framework
- 3.14.2 Capability Maturity by Industry Segment
- 3.14.3 Technology Adoption Lifecycle Stage
- 3.14.4 Implementation Timeline Benchmarks
- 3.14.5 Resource Requirements & Staffing Models
- 3.14.6 Organizational Readiness Assessment
- 3.15 Use Case Development & Implementation Roadmaps
- 3.15.1 Use Case Prioritization Framework
- 3.15.2 Proof-of-Concept to Production Pathway
- 3.15.3 Phased Implementation Strategies
- 3.15.4 Quick Wins vs Long-Term Initiatives
- 3.15.5 Stakeholder Engagement & Change Management
- 3.15.6 Training & Capacity Building Programs
- 3.16 Real-World Case Studies & Implementation Outcomes
- 3.16.1 Fleet Management Deployments
- 3.16.2 Smart City Traffic Management Projects
- 3.16.3 Public Transit Optimization Initiatives
- 3.16.4 Shared Mobility Platform Implementations
- 3.16.5 Smart Parking System Rollouts
- 3.16.6 Lessons Learned & Best Practices
- 3.17 Integration & Interoperability Landscape
- 3.17.1 API Standards & Protocols
- 3.17.2 Data Exchange Formats & Specifications
- 3.17.3 Multi-Vendor Integration Patterns
- 3.17.4 Cloud Platform Compatibility
- 3.17.5 Open Source vs Proprietary Solutions
- 3.17.6 Cross-Border Data Sharing Mechanisms
- 3.18 Cybersecurity, Data Privacy & Compliance Architecture
- 3.18.1 Threat Landscape & Attack Vectors
- 3.18.2 NIST Cybersecurity Framework Application
- 3.18.3 Privacy-by-Design Implementation
- 3.18.4 Data Anonymization & De-Identification
- 3.18.5 Compliance Certification Requirements
- 3.18.6 Incident Response & Recovery Protocols
- 3.18.7 Third-Party Risk Management
Chapter 4 Competitive Landscape, 2024
- 4.1 Introduction
- 4.2 Company market share analysis
- 4.2.1 North America
- 4.2.2 Europe
- 4.2.3 Asia Pacific
- 4.2.4 LATAM
- 4.2.5 MEA
- 4.3 Competitive analysis of major market players
- 4.4 Competitive positioning matrix
- 4.5 Strategic outlook matrix
- 4.6 Key news and initiatives
- 4.6.1 Mergers & acquisitions
- 4.6.2 Partnerships & collaborations
- 4.6.3 New Product Launches
- 4.6.4 Expansion Plans and funding
Chapter 5 Market Estimates & Forecast, By Deployment, 2021 - 2034 ($Mn)
- 5.1 Key trends
- 5.2 Cloud-based
- 5.3 On-premises
- 5.4 Hybrid
Chapter 6 Market Estimates & Forecast, By Technology, 2021 - 2034 ($Mn)
- 6.1 Key trends
- 6.2 Data collection & telemetry
- 6.3 Data management & storage
- 6.4 Analytics & intelligence
- 6.5 Visualization & user interface
- 6.6 Connectivity & integration
Chapter 7 Market Estimates & Forecast, By Application, 2021 - 2034 ($Mn)
- 7.1 Key trends
- 7.2 Traffic & network optimization
- 7.3 Fleet & asset management
- 7.4 Public transit & shared mobility analytics
- 7.5 Safety, compliance & incident management
- 7.6 Revenue, pricing & demand forecasting
- 7.7 Sustainability, emissions & environmental monitoring
Chapter 8 Market Estimates & Forecast, By End Use, 2021 - 2034 ($Mn)
- 8.1 Key trends
- 8.2 Government & urban planning authorities
- 8.3 Public transportation agencies
- 8.4 Mobility & shared transport operators
- 8.5 Logistics & fleet-based enterprises
- 8.6 Automotive OEMs & tier-1 tech providers
- 8.7 Research, policy & academic institutions
Chapter 9 Market Estimates & Forecast, By Region, 2021 - 2034 ($Mn)
- 9.1 Key trends
- 9.2 North America
- 9.2.1 US
- 9.2.2 Canada
- 9.3 Europe
- 9.3.1 Germany
- 9.3.2 UK
- 9.3.3 France
- 9.3.4 Italy
- 9.3.5 Spain
- 9.3.6 Nordics
- 9.3.7 Netherlands
- 9.3.8 Russia
- 9.3.9 BENELUX
- 9.4 Asia Pacific
- 9.4.1 China
- 9.4.2 India
- 9.4.3 Japan
- 9.4.4 ANZ
- 9.4.5 Singapore
- 9.4.6 Thailand
- 9.4.7 Vietnam
- 9.4.8 South Korea
- 9.5 Latin America
- 9.5.1 Brazil
- 9.5.2 Mexico
- 9.5.3 Argentina
- 9.6 MEA
- 9.6.1 South Africa
- 9.6.2 Saudi Arabia
- 9.6.3 UAE
Chapter 10 Company Profiles
- 10.1 Global Players
- 10.1.1 Geotab
- 10.1.2 INRIX
- 10.1.3 Mapbox
- 10.1.4 Omnitracs
- 10.1.5 PTV Planung Transport Verkehr
- 10.1.6 Samsara
- 10.1.7 Siemens Mobility
- 10.1.8 Teledyne FLIR / Acyclica
- 10.1.9 Trimble Transportation
- 10.1.10 Verizon Connect
- 10.1.11 HERE Technologies
- 10.1.12 Iteris
- 10.1.13 Teralytics
- 10.1.14 TomTom
- 10.2 Regional Champions
- 10.2.1 Cubic Transportation Systems
- 10.2.2 CVEDIA
- 10.2.3 Econolite
- 10.2.4 FLASH (Park Assist)
- 10.2.5 Kapsch TrafficCom
- 10.2.6 ParkMobile
- 10.2.7 Powerfleet
- 10.2.8 Remix (Via)
- 10.2.9 SWARCO
- 10.2.10 Swiftly
- 10.2.11 Teletrac Navman
- 10.3 Emerging Players & Disruptors
- 10.3.1 ATOM Mobility
- 10.3.2 Descartes Systems
- 10.3.3 FourKites
- 10.3.4 LVL Parking
- 10.3.5 Moovit (Intel)
- 10.3.6 Populus
- 10.3.7 Ride Report
- 10.3.8 StreetLight Data
 2026-2030年全球数据分析市场
 2026年全球数据分析市场报告2026年全球决策管理市场报告
 资料分析市场分析及预测(至2035年):依类型、产品类型、服务、技术、组件、应用、部署类型、最终使用者及功能划分
 数据分析市场规模、份额、成长率和全球行业分析:按类型和应用、区域洞察以及2026-2034年预测
 全球 API 分析市场:预测(至 2034 年)—按分析功能、基于 API 的监控、部署方式、使用情境、最终使用者和地区进行分析-决策管理的市场规模,占有率,成长及世界产业分析:各类型·各用途,各地区洞察与预测(2026年~2034年)
 按产品类型、部署模式和产业部门的自动化报价系统市场,全球预测(2026-2032年)
 日本数据分析市场报告(按类型、解决方案、部署、应用和地区划分,2026-2034 年)
 亚太地区自动资料登录工具及系统市场:按应用、产品和国家分類的分析与预测(2025-2035 年)